 Fourplex
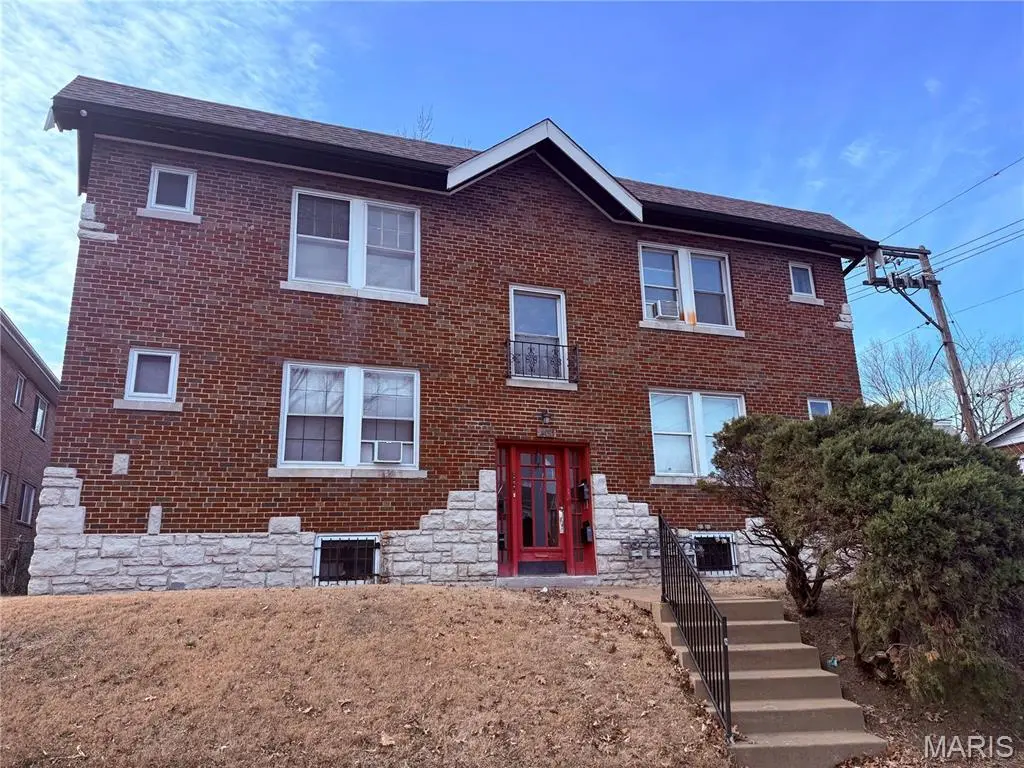
4617 S Broadway · St. Louis, MO
Flood risk 1/10 · Minimal
- FEMA flood zone
- X (unshaded)
- Chance of flooding over 30 yrs
- 0.0%
- Est. flood insurance / yr
- $473 – $860
Fire risk 1/10 · Minimal
- Est. fire insurance / yr
- $1,054 – $1,958
Heat risk 5/10 · Moderate
- Hot days now (above 108°F)
- 7 days/yr
- Hot days in 30 yrs
- 21 days/yr
Wind risk 2/10 · Minimal
- Chance of severe wind over 30 yrs
- 1.0%
Air-quality risk 3/10 · Minor
- Unhealthy air days now
- 3 days/yr
- Unhealthy air days in 30 yrs
- 4 days/yr
Risk factors via First Street. Map © Google.
Why this score? — see what drove the C grade
The composite is a weighted blend of 9 inputs, each scored 0–100. Each bar is that input's sub-score; the figure is the points it added to the 100-point composite (weight × sub-score).
- Cash flow +30.0/30.0
- 1% rule +10.0/10.0
- DSCR +10.0/10.0
- Rent growth +3.3/5.0
- Livability +2.5/5.0
- Condition / age +2.5/5.0
- Schools +1.2/10.0
- ARV discount +0.0/15.0
- Appreciation +0.0/10.0
$219,900
🖨 Deal sheet 📄 Offer letter ✓ Due diligence
Multi-family units
County records classify this as Multi-Family (2-4 Unit). Listing-text estimate: 4 units. confirmed
Listing remarks MLS
We are out of hold status while we were waiting for a few bids to come back. Fantastic value in this well maintained four family in Mount Pleasant featuring two renovated vacant units that are rent ready and ideal for investors looking to add immediate income. The other two units are occupied and professionally managed, currently generating $650 and $645 per month. Rents in the area are in the $700-$750 range so there is a lot of upside for the new buyer. The units boast original hard wood flooring, living rooms, and private bedrooms with an attached sunroom. Clean basement with updated electrical panels, PVC stacks, and some PEX plumbing. Perfect for 1031 exchanges, growing investment portfolios, or first-time multi-family buyers. Can be purchased in a package with three other four families 5516 S Grand (MLS# 25076144), 4127 Virginia (26016314), and 4124 Virginia Ave (25076198). Seller is selling as is. No seller financing deals will be considered. Video walk throughs of the occupied units are linked on the listing. The roof is being coated and re-flashed this week. There is a sewer lateral issue that the seller is willing to credit for with a reasonable offer. Those were taken prior to the tenants move in. Two vacant units and the basement can be shown. Occupied unit can be shown with an accepted contract. Schedule this one today!
Key facts
- Private bedrooms
- Pex plumbing
- Clean basement
Tags
Neighborhood map
What this means for you Summary
Snapshot
- This is a 4 × 4-bed/1.0-bath units multifamily listed at $220k.
Deal economics
- At list price, monthly cash flow is $2k ($30k/yr) — positive. Per door: $615/mo.
- The deal already cash-flows at list — no discount required.
- Meets the 1% rule at list price ($5k rent vs $220k).
- Recommended offer: $200k (9.0% below list) — sets the bar for market timing.
- Cap rate 19.7% vs local median 5.0% in St. Louis — top-decile yield for the area; either an underpriced asset or a hidden risk that comps aren't pricing in. Stress-test before assuming the spread holds.
Location & tenants
- Location reads: area grade C — affects rentability + tenant quality, not the cash-flow math above.
- St. Louis City (urban): math 10% / reading 18% proficiency, ranked #312 of 324 in MO (top 96%) — low school quality limits family demand, transient renter base, plan for 1-2y turnover; 80% free/reduced lunch — lower-income household profile, screen leases tightly.
- Market conditions: Rents rising (+3.3%/yr); 125 active listings in the ZIP; 294 units permitted in St. Louis city in 2024 (227 in 5+ unit buildings).
- At $4,870/mo this rent would consume 124% of the median local household income ($47k/yr) (locally 1364% of renters already pay >50% of income on rent) — very limited rent-growth headroom before tenants either downsize or default.
Forward outlook
- Local home prices are declining (-3.0%/yr); year-one equity from $2k of loan paydown is wiped out by about $7k of value loss. Plan a longer hold.
- St. Louis County population projected to shrink 6% by 2050 — rents likely to lag national; underwrite the cash flow, not the appreciation.
- At projected returns (-3.0% appreciation + 3.3% rent growth), your $62k cash investment doubles in ~3 years — after that, you're playing with house money.
Negotiation context
- It's been on market 100 days — a 9% lower offer ($200k) is reasonable based on typical stale-listing flexibility.
- 2 sale attempts with the ask held roughly flat each time — persistent listings suggest the price (not the market) is what's stuck; bring a comps-based counter.
- Current owner paid $144k; list at $220k implies a 53% gain — meaningful room to come down on a strong offer.
Risks & watch-outs
- Watch-outs: built in 1928 — expect roof / HVAC / electrical / plumbing capex.
- Climate carrying-cost: extreme-heat days projected 7→21/yr by 2055 (HVAC capex compounding) — expect insurance premiums to compound above CPI over the hold.
Questions for the listing agent
- It's been on market 100 days. Have you received any prior offers? Is the seller open to a 9% concession, seller financing, or rate buy-down credit?
- Can we see the unit-by-unit rent roll, current vacancy, and any below-market leases? What's the average tenancy length?
- What capital expenditures (roof, boiler, parking lot, exteriors) have been made in the last 5 years, and what's planned in the next 2?
- Built in 1928 — when were the roof, HVAC, electrical panel, plumbing, and water heater last replaced?
- Why hasn't it sold? Are there any deal-killer items the seller is aware of (foundation, flood, title, zoning, code violations)?
- Is there a deadline driving the sale (1031 exchange, divorce, estate, relocation)? That informs how much negotiation room exists.
- What's the average days-on-market for RENTAL listings here right now (not sales)? A rising rental-DOM trend means longer vacancies and softer asking-rent achievability than the comps imply.
- What's the recent tenant-quality profile in this submarket — average credit score on applications, eviction rate, late-payment / NSF rate, and stable-employment percentage? A property-management company in the area should have these aggregated.
- How much new apartment / multifamily construction is in the pipeline within 1–3 miles? Heavy new supply (>2% of stock underway) typically softens rents 12–24 months out; light construction supports rent growth.
Investment metrics
- 1% rule
- 2.21% ✓
- Cap rate
- 19.71%
- Cash-on-cash
- 47.91%
- DSCR
- 3.13
- GRM
- 3.8
CMA / ARV
- ARV (median comp)
- $163,138
- List price
- $219,900
- Delta
- 34.79%
- Verdict
- OVERPRICED
- Comps
- 20 within 1.0 mi
Projected returns pro-forma
-3.0% appreciation · 3.27% rent growth · sell at horizon
- IRR
- 45.7%
- Equity multiple
- 2.99×
- Total profit
- $122,264
- Equity at exit
- $32,788
- IRR
- 51.6%
- Equity multiple
- 6.09×
- Total profit
- $313,530
- Equity at exit
- $19,013
Cash invested: $61,572 (down + closing). Projections, not guarantees.
Landlord ↔ Tenant lean methodology
- Overall (STATE)
- 81 Strongly Landlord-Friendly
- State Missouri
- 81 Strongly Landlord-Friendly · R+10
- County
- — inherits STATE
- City
- — inherits STATE
ZIP-level market 63111
- Rents YoY
- 3.3%
- Active inventory
- 125
- Price-to-rent
- 15.1×
Monthly cashflow live
- Estimated rent
- $4,870 medium interval (Pro) →
- Mortgage (P&I)
- −$1,153
- Tax from tax record
- −$144 /mo · $1,729/yr
- Insurance
- −$92
- HOA
- −$0
- Vacancy / Maint / Mgmt
- −$1,023
- Net cashflow
- $2,458
Break-even live
4-unit breakdown (identical units grouped — click to expand)
| Units | Beds | Baths | Est. rent |
|---|---|---|---|
| 4× units | 4 | 1 | $4,872 |
| #1 | 4 | 1 | $1,218 |
| #2 | 4 | 1 | $1,218 |
| #3 | 4 | 1 | $1,218 |
| #4 | 4 | 1 | $1,218 |
| Total (4 units) | $4,870 | ||
UW: 25.0% down · 7.5% · 30yr · 1.5% tax · 5.0% vac · 8.0% maint · 8.0% mgmt
Financing live
Cash to close
- Down payment
- $54,975
- Closing costs
- $6,597
- Reserves months
- —
- Total cash needed
- —
Loan-product check · same deal, 3 products live
Conventional
25% down · 7.5% · 30yr
- Down + closing
- —
- Monthly P&I
- —
- Monthly cashflow
- —
- DSCR
- —
- Eligible?
- —
Personal DTI + credit; lowest rate.
DSCR
20% down · 8.5% · 30yr
- Down + closing
- —
- Monthly P&I
- —
- Monthly cashflow
- —
- DSCR
- —
- Eligible?
- —
No personal income docs; deal must DSCR.
Hard money
10% down · 12.0% · 12mo
- Down + closing
- —
- Monthly P&I
- —
- Monthly cashflow
- —
- DSCR
- —
- Eligible?
- —
Short-term bridge; refi at stabilization.
Listing history 19 events
-
2026-06-18days on market $219,900 Active 100 DOM
-
2026-06-17days on market $219,900 Active 99 DOM
-
2026-06-16days on market $219,900 Active 98 DOM
-
2026-06-15days on market $219,900 Active 97 DOM
-
2026-06-13days on market $219,900 Active 95 DOM
-
2026-06-09days on market $219,900 Active 91 DOM
-
2026-06-08days on market $219,900 Active 90 DOM
-
2026-06-08days on market $219,900 Active 89 DOM
-
2026-06-05days on market $219,900 Active 86 DOM
-
2026-06-03days on market $219,900 Active 85 DOM
-
2026-06-02days on market $219,900 Active 84 DOM
-
2026-06-01days on market $219,900 Active 83 DOM
-
2026-05-31days on market $219,900 Active 82 DOM
-
2026-04-14status Active 1354-char remark
Show marketing remark (1354 chars)
We are out of hold status while we were waiting for a few bids to come back. Fantastic value in this well maintained four family in Mount Pleasant featuring two renovated vacant units that are rent ready and ideal for investors looking to add immediate income. The other two units are occupied and professionally managed, currently generating $650 and $645 per month. Rents in the area are in the $700-$750 range so there is a lot of upside for the new buyer. The units boast original hard wood flooring, living rooms, and private bedrooms with an attached sunroom. Clean basement with updated electrical panels, PVC stacks, and some PEX plumbing. Perfect for 1031 exchanges, growing investment portfolios, or first-time multi-family buyers. Can be purchased in a package with three other four families 5516 S Grand (MLS# 25076144), 4127 Virginia (26016314), and 4124 Virginia Ave (25076198). Seller is selling as is. No seller financing deals will be considered. Video walk throughs of the occupied units are linked on the listing. The roof is being coated and re-flashed this week. There is a sewer lateral issue that the seller is willing to credit for with a reasonable offer. Those were taken prior to the tenants move in. Two vacant units and the basement can be shown. Occupied unit can be shown with an accepted contract. Schedule this one today!
-
2026-02-04$225,000 Active 1354-char remark
Show marketing remark (1354 chars)
We are out of hold status while we were waiting for a few bids to come back. Fantastic value in this well maintained four family in Mount Pleasant featuring two renovated vacant units that are rent ready and ideal for investors looking to add immediate income. The other two units are occupied and professionally managed, currently generating $650 and $645 per month. Rents in the area are in the $700-$750 range so there is a lot of upside for the new buyer. The units boast original hard wood flooring, living rooms, and private bedrooms with an attached sunroom. Clean basement with updated electrical panels, PVC stacks, and some PEX plumbing. Perfect for 1031 exchanges, growing investment portfolios, or first-time multi-family buyers. Can be purchased in a package with three other four families 5516 S Grand (MLS# 25076144), 4127 Virginia (26016314), and 4124 Virginia Ave (25076198). Seller is selling as is. No seller financing deals will be considered. Video walk throughs of the occupied units are linked on the listing. The roof is being coated and re-flashed this week. There is a sewer lateral issue that the seller is willing to credit for with a reasonable offer. Those were taken prior to the tenants move in. Two vacant units and the basement can be shown. Occupied unit can be shown with an accepted contract. Schedule this one today!
-
2023-02-09soldstatus
-
2020-11-10soldstatus $144,000
-
2010-09-22soldstatus
-
2007-07-18soldstatus $160,000
ⓘ Source: listings_history table (triggers on properties + properties_extension) + one-shot
backfill from property_details.listing_events for pre-trigger history.
Tax reassessment forecast MO · Resets to sale price
- Current annual tax
- $1,729 · $144/mo
- Projected year-2 tax
- $2,133 · $178/mo
- Expected delta
- +$404/yr (+$34/mo · 23.4%)
ⓘ Screening estimate from a state-policy table — verify with the county assessor before closing.
Climate risk First Street
- Flood 1/10 Low FEMA zone X (unshaded) · 0% chance over 30 yrs
- Wildfire 1/10 Low
- Heat 5/10 Major 7 d/yr ≥108°F today · 21 d/yr by 30 yrs out
- Wind 2/10 Low 100% chance of damaging wind over 30 yrs
- Air quality 3/10 Moderate 3 unhealthy d/yr today · 4 by 30 yrs out
Nearby sold comps map
Loading sold comps map…
Walkable amenities ~0.75 mi
Loading nearby amenities…
Taxation est. · year 1
- Rental income
- $58,440
- − Mortgage interest
- −$12,318
- − Property taxes
- −$1,729
- − Insurance
- −$1,100
- − Repairs & maintenance
- −$4,675
- − Management
- −$4,675
- − Depreciation
- −$6,397
- Taxable income
- $27,546
- Est. tax owed @ 24.0%
- −$6,611
- After-tax cash flow
- $22,890/yr
For passive investors: Depreciation is non-cash, so a rental often shows a tax loss while cash-flowing — sheltering income. Rental losses are passive: they offset passive income freely, and up to $25,000/yr can offset ordinary (W-2) income if you actively participate and your MAGI is under $100k (phasing out to $0 by $150k); unused losses carry forward. On sale, claimed depreciation is recaptured at up to 25%, and gains may owe capital-gains tax (a 1031 exchange can defer both). Figures are a year-1 estimate at your 24.0% rate — not tax advice; consult a CPA.
Schools (NCES district)
- District
- St. Louis City
- NCES district ID
- 2929280
- Math proficiency
- 10% ▼ -6.00%
- Reading proficiency
- 18% ▼ -3.00%
- Median HH income
- $35,685
- Composite
- 11.54/100
- National rank
- #9699
- State rank
- #312 of 324 in MO
Livability — St. Louis
No livability data for this city. (Only ~50 U.S. cities are tracked.)
Census & demographics
- Census place
- St. Louis, MO
- County
- Saint Louis City · 254,015 people
- City population
- 283,259
- Metro
- St. Louis, MO-IL
- Population (ZIP)
- 18,851
- Household income
- $47,039
- Rent vs Own
- Severe rent burden
- 1364.0
Population outlook (St. Louis County) Hauer SSP2
- Today (2025)
- 315,737 people
- By 2030
- 313,865 · -0.6%
- By 2040
- 305,439 · -3.3%
- By 2050
- 296,529 · -6.1%
- By 2075
- 271,028 · -14.2%
- By 2100
- 255,359 · -19.1%
Race, ethnicity, and origin ACS 2023
- Neighborhood character
- Diverse neighborhood (Simpson 0.65)
- Race & ethnicity
- Black 42% White 41% Two or more races 11% Hispanic / Latino 9% Asian 1%
- Hispanic origin (detail)
- Mexican 6%
- Common ancestry
- Lithuanian 3% Slovak 1% Romanian 1%
- Foreign-born
- 7% · Canada, India
- Languages at home
- 90% English-only · Spanish 7% Other Indo-European 1%
Political lean MEDSL · St. Louis
- 2024 margin
- Solid D (+64.7) · D 81.4% · R 16.7% · Other 2.0%
- 2008→2024 swing
- -3.5pp toward R · 2008: 68.2pp · 2024: 64.7pp
- All cycles
- 2024: D+64.7 2020: D+66.2 2016: D+63.7 2012: D+66.6 2008: D+68.2
Not yet ingested
- Civics
- —
Market trends
- HPI YoY
- ▼ -92.80%
- Current HPI
- 169.4644
- Rent YoY
- ▲ 3.27%
- Metro
- St. Louis, MO-IL
- State GDP YoY
- ▲ 1.84%
- F500 in state
- 20
Industry mix (Fortune 500 HQ in MO)
| Industry | F500 HQs | Revenue |
|---|---|---|
| Healthcare | 1 | $163B |
|
||
| Insurance | 1 | $21B |
|
||
| Industrial Technology | 1 | $17B |
|
||
| Retail | 1 | $16B |
|
||
| Industrial Distribution | 1 | $10B |
|
||
| Utilities | 1 | $9B |
|
||
Price history
+40.6% since first listed6 events — show timeline
- 2026-04-14 Relisted — MARIS as Distributed by MLS Grid
- 2026-02-04 Listed $225,000 MARIS as Distributed by MLS Grid
- 2023-02-09 Sold (Public Records) — Public Records
- 2020-11-10 Sold (Public Records) $144,000 Public Records
- 2010-09-22 Sold (Public Records) — Public Records
- 2007-07-18 Sold (Public Records) $160,000 Public Records
Property tax history
+5.4%/yrLatest (2024): $1,729 · +5.1% YoY. Source: county tax records.
Cash-flow waterfall
monthlySold comps — $/sqft
last 12 mo · ≤1 miLoading sold comps…