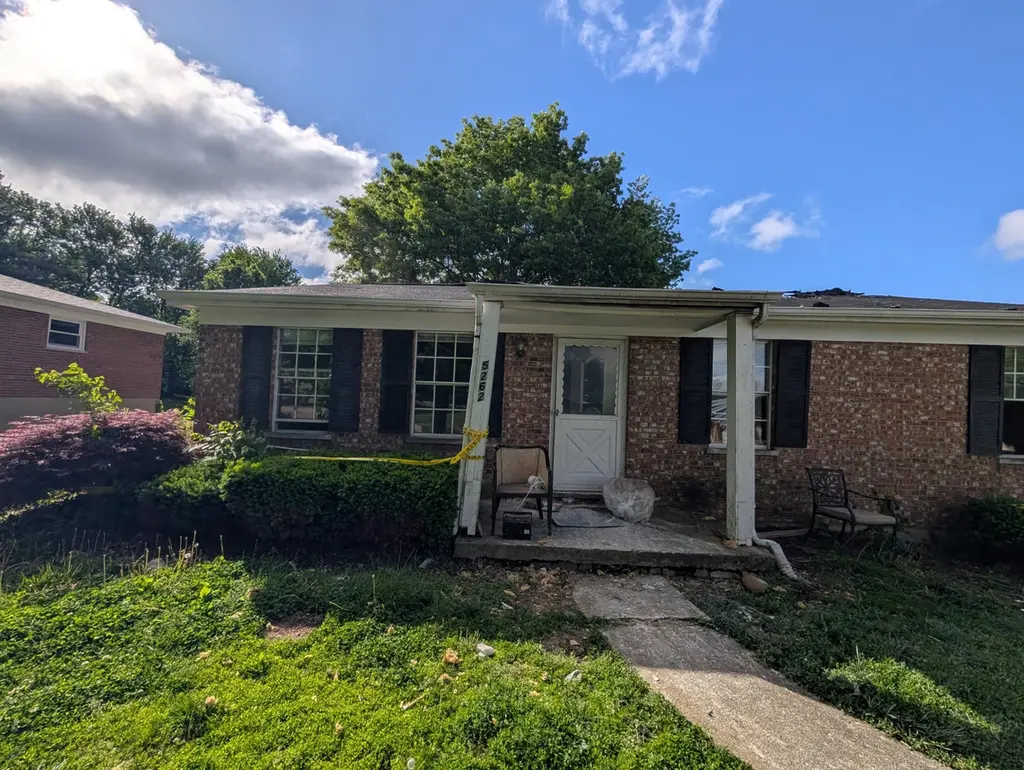
5262 Pioneer Dr · Independence, KY
Flood risk 1/10 · Minimal
- FEMA flood zone
- X (unshaded)
- Chance of flooding over 30 yrs
- 0.0%
- Est. flood insurance / yr
- $507 – $1,088
Fire risk 1/10 · Minimal
- Est. fire insurance / yr
- $839 – $1,559
Heat risk 4/10 · Minor
- Hot days now (above 102°F)
- 7 days/yr
- Hot days in 30 yrs
- 19 days/yr
Wind risk 2/10 · Minimal
- Chance of severe wind over 30 yrs
- 1.0%
Air-quality risk 3/10 · Minor
- Unhealthy air days now
- 2 days/yr
- Unhealthy air days in 30 yrs
- 4 days/yr
Risk factors via First Street. Map © Google.
Why this score? — see what drove the B grade
The composite is a weighted blend of 9 inputs, each scored 0–100. Each bar is that input's sub-score; the figure is the points it added to the 100-point composite (weight × sub-score).
- Cash flow +30.0/30.0
- 1% rule +10.0/10.0
- DSCR +10.0/10.0
- ARV discount +7.5/15.0
- Schools +4.0/10.0
- Rent growth +3.8/5.0
- Livability +3.6/5.0
- Condition / age +2.5/5.0
- Appreciation +0.0/10.0
$139,900
🖨 Deal sheet 📄 Offer letter ✓ Due diligence
Listing remarks MLS
Here's an opportunity for instant equity! This home hasn't been updated since 1981 but has a great layout. This all brick ranch sits on a .6 acre lot towards the end of a cul de sac. This is an estate sale and the home will need a complete cosmetic update. Roof and a/c are about 10 years old, driveway about 5 years. Home being sold as-is and no repairs will be made.
Key facts
- Solid foundation
- Functional layout
- 0.62 acre lot
Tags
Property features AI
Exterior
- Parking: Garage (1 car)
- Security: Smoke detector(s)
- Utilities: Public water; Public sewer; Natural gas available
- Home design: Single family residence; One level; House
- Construction: Built in 1987; Brick construction; Composition shingle roof; Poured concrete foundation
- Exterior features: Cul-de-sac lot
Interior
- Kitchen: Kitchen (11 x 11); Breakfast room (11 x 9)
- Bedrooms: Primary bedroom (14 x 12); Bedroom 2 (13 x 10)
- Bathrooms: 2 full bathrooms
- Heating & cooling: Forced air heating; Central air conditioning
- Interior features: Full basement; Smoke detector(s)
- Laundry & utility: Washer hookup; Electric dryer hookup
Neighborhood map
What this means for you Summary
Snapshot
- This is a 3-bed/1.0-bath single-family listed at $140k.
Deal economics
- At list price, monthly cash flow is $865 ($10k/yr) — positive.
- The deal already cash-flows at list — no discount required.
- Meets the 1% rule at list price ($2k rent vs $140k).
- Cap rate 13.7% vs local median 3.7% in Independence — top-decile yield for the area; either an underpriced asset or a hidden risk that comps aren't pricing in. Stress-test before assuming the spread holds.
Location & tenants
- Location reads 72/100 on livability (#130 in KY) — a middle-class / working-renter tenant base. Strengths: crime A+, employment A+, cost of living A+; Watch: amenities F, commute F, health & safety F.
- Kenton County (suburban): math 42% / reading 48% proficiency, ranked #14 of 165 in KY (top 8%) — families likely to look elsewhere, expect single-tenant / working-renter base with shorter leases.
- Zoned schools: Kenton Elementary School (math 59% / reading 52%, grade C, #60 of 676 statewide, top 9%, 627 students, 42% FRL); Woodland Middle School (math 38% / reading 50%, grade D, #40 of 217 statewide, top 19%, 616 students, 48% FRL); Simon Kenton High School (math 40% / reading 44%, grade F, #32 of 254 statewide, top 13%, 1,859 students, 37% FRL).
- Market conditions: Rents rising fast (+5.4%/yr); 253 active listings in the ZIP; 2 comparable units currently listed for rent nearby; solid renter incomes; 699 units permitted in Kenton County in 2024 (287 in 5+ unit buildings).
Forward outlook
- Local home prices are declining (-3.0%/yr); year-one equity from $967 of loan paydown is wiped out by about $4k of value loss. Plan a longer hold.
- Kenton County population projected at +5% by 2050 — modest demand growth; plan on rents tracking national, not racing it.
- At projected returns (-3.0% appreciation + 5.4% rent growth), your $39k cash investment doubles in ~5 years — after that, you're playing with house money.
Negotiation context
- Only 8 days on market — expect competitive offers; lowballing is unlikely to land.
- 2 sale attempts since 8y ago with the ask held roughly flat each time — persistent listings suggest the price (not the market) is what's stuck; bring a comps-based counter.
Questions for the listing agent
- Is there a deadline driving the sale (1031 exchange, divorce, estate, relocation)? That informs how much negotiation room exists.
- Schools are B-rated — typically a magnet for longer-tenancy family renters. What's the average tenant stay here, and is there a school-zone premium baked into asking?
- What's the average days-on-market for RENTAL listings here right now (not sales)? A rising rental-DOM trend means longer vacancies and softer asking-rent achievability than the comps imply.
- What's the recent tenant-quality profile in this submarket — average credit score on applications, eviction rate, late-payment / NSF rate, and stable-employment percentage? A property-management company in the area should have these aggregated.
- How much new for-sale + rental construction is in the pipeline within 1–3 miles? Heavy new supply typically softens prices + rents 12–24 months out; constrained supply supports both.
Investment metrics
- 1% rule
- 1.71% ✓
- Cap rate
- 13.72%
- Cash-on-cash
- 26.51%
- DSCR
- 2.18
- GRM
- 4.9
CMA / ARV
- ARV (on-the-fly)
- $303,282
- Comps found
- 12
Show comp detail 12 sales within ~0.75 mi
| Address | Dist | Beds/Ba | Sqft | Sold | Price | $/sf | Match |
|---|---|---|---|---|---|---|---|
| 46 Carrie Way | 0.09mi | 3/2.5 | 1,225 (+1%) | 1mo | $352,000 | $287 | 88 |
| 120 Carrie Way | 0.28mi | 3/2.5 | 1,287 (+6%) | 7mo | $340,000 | $264 | 66 |
| 5190 Christopher Dr | 0.40mi | 3/1.5 | 1,120 (-8%) | 1mo | $255,000 | $228 | 65 |
| 5316 Bedford Ct | 0.67mi | 3/2.0 | 1,232 (+1%) | 0mo | $307,000 | $249 | 62 |
| 5186 Christopher Dr | 0.41mi | 3/1.5 | 1,337 (+10%) | 6mo | $256,500 | $192 | 58 |
| 5217 Belle Dr | 0.62mi | 2/2.0 (-1) | 1,206 (-1%) | 4mo | $232,000 | $192 | 57 |
| 2083 Hartland Blvd | 0.65mi | 4/2.5 (+1) | 1,232 (+1%) | 2mo | $320,000 | $260 | 55 |
| 5237 Millcreek Cir | 0.46mi | 3/2.0 | 1,292 (+6%) | 12mo | $325,000 | $252 | 54 |
| 164 Friar Tuck Dr | 0.44mi | 3/2.0 | 1,098 (-10%) | 10mo | $235,000 | $214 | 51 |
| 5114 Christopher Dr | 0.62mi | 3/2.5 | 1,320 (+8%) | 0mo | $275,000 | $208 | 51 |
| 10381 Chambersburg Dr | 0.73mi | 3/2.5 | 1,117 (-8%) | 1mo | $290,000 | $260 | 46 |
| 64 Sylvan Dr | 0.73mi | 3/1.5 | 1,080 (-11%) | 5mo | $269,000 | $249 | 41 |
Match score weights: distance 35% · size 25% · config 20% · recency 20%. Top-matched comps best support the ARV.
Projected returns pro-forma
-3.0% appreciation · 5.37% rent growth · sell at horizon
- IRR
- 23.1%
- Equity multiple
- 1.98×
- Total profit
- $38,378
- Equity at exit
- $20,860
- IRR
- 32.6%
- Equity multiple
- 4.32×
- Total profit
- $129,916
- Equity at exit
- $12,096
Cash invested: $39,172 (down + closing). Projections, not guarantees.
Landlord ↔ Tenant lean methodology
- Overall (STATE)
- 83 Strongly Landlord-Friendly
- State Kentucky
- 83 Strongly Landlord-Friendly · R+16
- County
- — inherits STATE
- City
- — inherits STATE
ZIP-level market 41051
- Home prices YoY
- -32.6%
- Rents YoY
- 5.4%
- Active inventory
- 253
- Price-to-rent
- 4.9×
Monthly cashflow live
- Estimated rent
- $2,399 medium interval (Pro) →
- Mortgage (P&I)
- −$734
- Tax from tax record
- −$237 /mo · $2,850/yr
- Insurance
- −$58
- HOA
- −$0
- Vacancy / Maint / Mgmt
- −$504
- Net cashflow
- $865
Break-even live
UW: 25.0% down · 7.5% · 30yr · 1.5% tax · 5.0% vac · 8.0% maint · 8.0% mgmt
Financing live
Cash to close
- Down payment
- $34,975
- Closing costs
- $4,197
- Reserves months
- —
- Total cash needed
- —
Loan-product check · same deal, 3 products live
Conventional
25% down · 7.5% · 30yr
- Down + closing
- —
- Monthly P&I
- —
- Monthly cashflow
- —
- DSCR
- —
- Eligible?
- —
Personal DTI + credit; lowest rate.
DSCR
20% down · 8.5% · 30yr
- Down + closing
- —
- Monthly P&I
- —
- Monthly cashflow
- —
- DSCR
- —
- Eligible?
- —
No personal income docs; deal must DSCR.
Hard money
10% down · 12.0% · 12mo
- Down + closing
- —
- Monthly P&I
- —
- Monthly cashflow
- —
- DSCR
- —
- Eligible?
- —
Short-term bridge; refi at stabilization.
Rent comps 2 comps
| Address | Beds | Baths | Sqft | Rent | $/sqft | DOM | Units | Dist |
|---|---|---|---|---|---|---|---|---|
| 10702 Brent Ridge Cir Independence, KY | 2.0–3.0 | 2.0–3.0 | 1520 | $2,775 | $1.83 | 1d | 4 | 1.07mi |
| 1800 Brentwood Ln Independence, KY | 1.0–2.0 | 1.0–2.0 | 845 | $1,309 | $1.55 | 1d | 3 | 1.16mi |
Listing history 6 events
-
2026-06-08statusdays on market $139,900 Pending 8 DOM
-
2026-06-07days on market $139,900 Active 7 DOM
-
2026-06-03days on market $139,900 Active 3 DOM
-
2026-06-02days on market $139,900 Active 2 DOM
-
2026-06-01remarks 504-char remark
-
2026-06-01$139,900 Active 1 DOM
ⓘ Source: listings_history table (triggers on properties + properties_extension) + one-shot
backfill from property_details.listing_events for pre-trigger history.
Tax reassessment forecast KY · Resets to sale price
- Current annual tax
- $2,850 · $237/mo
- Projected year-2 tax
- $2,850 · $237/mo
- Expected delta
- $0/yr ($0/mo · 0.0%)
ⓘ Screening estimate from a state-policy table — verify with the county assessor before closing.
Climate risk First Street
- Flood 1/10 Low FEMA zone X (unshaded) · 0% chance over 30 yrs
- Wildfire 1/10 Low
- Heat 4/10 Moderate 7 d/yr ≥102°F today · 19 d/yr by 30 yrs out
- Wind 2/10 Low 100% chance of damaging wind over 30 yrs
- Air quality 3/10 Moderate 2 unhealthy d/yr today · 4 by 30 yrs out
Nearby sold comps map
Loading sold comps map…
Walkable amenities ~0.75 mi
Loading nearby amenities…
Taxation est. · year 1
- Rental income
- $28,782
- − Mortgage interest
- −$7,837
- − Property taxes
- −$2,850
- − Insurance
- −$700
- − Repairs & maintenance
- −$2,303
- − Management
- −$2,303
- − Depreciation
- −$4,070
- Taxable income
- $8,721
- Est. tax owed @ 24.0%
- −$2,093
- After-tax cash flow
- $8,292/yr
For passive investors: Depreciation is non-cash, so a rental often shows a tax loss while cash-flowing — sheltering income. Rental losses are passive: they offset passive income freely, and up to $25,000/yr can offset ordinary (W-2) income if you actively participate and your MAGI is under $100k (phasing out to $0 by $150k); unused losses carry forward. On sale, claimed depreciation is recaptured at up to 25%, and gains may owe capital-gains tax (a 1031 exchange can defer both). Figures are a year-1 estimate at your 24.0% rate — not tax advice; consult a CPA.
Schools (NCES district)
- District
- Kenton County
- NCES district ID
- 2103090
- Math proficiency
- 42% ▼ -13.00%
- Reading proficiency
- 48% ▼ -14.00%
- Median HH income
- $66,183
- Composite
- 40.17/100
- National rank
- #3789
- State rank
- #14 of 165 in KY
Livability — Independence
- Score
- 72/100
- State rank
- #130
- US rank
- #6165
Category grades
Schools grade is shown separately in the Schools card above.
Census & demographics
- Census place
- Independence, KY
- County
- Kenton County · 142,881 people
- City population
- 33,054
- Metro
- Cincinnati, OH-KY-IN
- Population (ZIP)
- 33,054
- Household income
- $104,201
- Rent vs Own
- Severe rent burden
- 243.0
Population outlook (Kenton County) Hauer SSP2
- Today (2025)
- 174,205 people
- By 2030
- 177,897 · +2.1%
- By 2040
- 182,671 · +4.9%
- By 2050
- 183,543 · +5.4%
- By 2075
- 178,977 · +2.7%
- By 2100
- 159,920 · -8.2%
Race, ethnicity, and origin ACS 2023
- Neighborhood character
- Predominantly White (93%)
- Race & ethnicity
- White 93% Two or more races 3% Hispanic / Latino 2% Black 1% Asian 1%
- Common ancestry
- Italian 3% Lithuanian 3% Slovak 2%
- Foreign-born
- 3% · China, Canada
- Languages at home
- 96% English-only · Spanish 1% Chinese 1% Other Asian/Pacific 1%
Political lean MEDSL · Kenton
- 2024 margin
- Strong R (+21.7) · D 38.2% · R 59.9% · Other 1.9%
- 2008→2024 swing
- -0.9pp no change · 2008: -20.9pp · 2024: -21.7pp
- All cycles
- 2024: R+21.7 2020: R+19.3 2016: R+26.1 2012: R+24.3 2008: R+20.9
Not yet ingested
- Civics
- —
Market trends
- HPI YoY
- ▼ -105.60%
- Current HPI
- 218.492
- Rent YoY
- ▲ 5.37%
- Metro
- Cincinnati, OH-KY-IN
- State GDP YoY
- ▲ 1.81%
- F500 in state
- 4
Industry mix (Fortune 500 HQ in KY)
| Industry | F500 HQs | Revenue |
|---|---|---|
| Healthcare | 1 | $118B |
|
||
| Food / Beverage | 1 | $7B |
|
||
Price history
+3.6% since first listed6 events — show timeline
- 2026-05-19 Listed $139,900 NKMLS
- 2022-07-08 Price Changed $1,645 RENT.
- 2019-12-19 Sold (Public Records) $155,233 Public Records
- 2018-07-20 Sold (Public Records) $127,500 Public Records
- 2018-07-13 Sold (MLS) $127,500 NKMLS
- 2018-06-07 Listed $135,000 NKMLS
Property tax history
+10.3%/yrLatest (2025): $2,850 · -4.9% YoY. Source: county tax records.
Cash-flow waterfall
monthlySold comps — $/sqft
last 12 mo · ≤1 miLoading sold comps…