 🏗️ New Construction
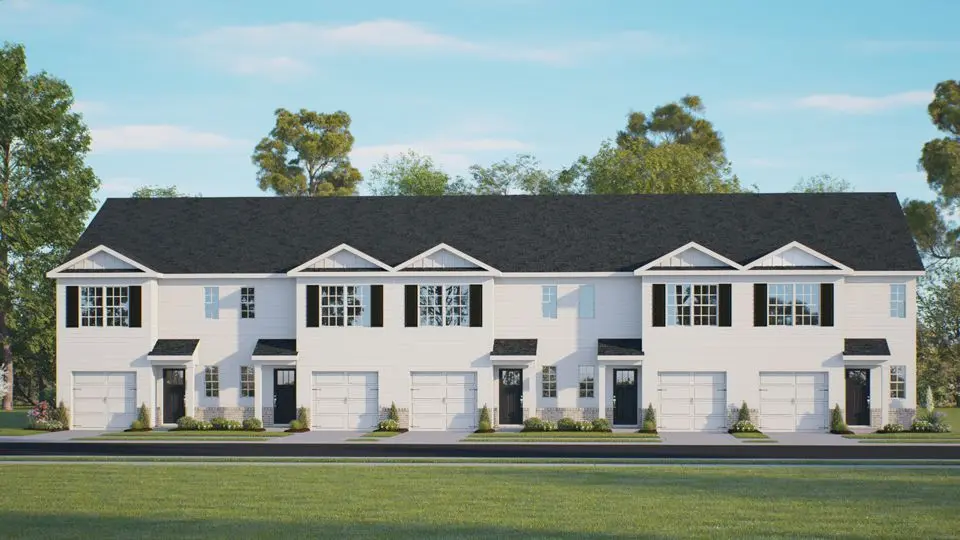
PEARSON Plan · Mauldin, SC
Flood risk No data
- FEMA flood zone
- —
- Chance of flooding over 30 yrs
- —
- Est. flood insurance / yr
- —
Fire risk No data
- Est. fire insurance / yr
- —
Heat risk No data
- Hot days now (above threshold)
- —
- Hot days in 30 yrs
- —
Wind risk No data
- Chance of severe wind over 30 yrs
- —
Air-quality risk No data
- Unhealthy air days now
- —
- Unhealthy air days in 30 yrs
- —
Risk factors via First Street. Map © Google.
Why this score? — see what drove the D grade
The composite is a weighted blend of 9 inputs, each scored 0–100. Each bar is that input's sub-score; the figure is the points it added to the 100-point composite (weight × sub-score).
- Cash flow +13.3/30.0
- ARV discount +7.5/15.0
- Livability +4.4/5.0
- Schools +4.2/10.0
- DSCR +4.0/10.0
- Condition / age +4.0/5.0
- 1% rule +3.7/10.0
- Rent growth +3.4/5.0
- Appreciation +0.0/10.0
$250,990
🖨 Deal sheet (PDF) 📄 Offer letter ✓ Due diligence
Listing remarks
The Pearson is a spacious and modern home designed with open concept living in mind. This home offers three bedrooms, two and a half bathrooms and a one-car garage. Upon entering the home, you'll be greeted by an inviting foyer that leads directly into the heart of the home. This impressive space features a living room, dinning area, and a well-appointed kitchen. The kitchen is equipped with a pantry, stainless steel appliances, making it perfect for both cooking and casual dining. The Pearson features a luxurious primary suite, complete with a large walk-in closet and en suite bathroom with dual vanities. The additional two bedrooms provide comfort and privacy and share a full bathroom. Th
Key facts
- Inviting foyer
- En suite bathroom
- Open concept living
Tags
Property features AI
Finance
- Other: Property listed as Active; Address: 449 Silicon Dr, Greenville SC 29605
- Financial info: List price $250,990
Exterior
- Parking: 1-car garage (1 total parking space)
- Home design: PEARSON plan (new construction)
- Exterior features: Living area approximately 1,418 (plan)
Interior
- Bedrooms: 3 bedrooms
- Bathrooms: 2 full bathrooms, 1 half bathroom
- Interior features: Open floor plan (plan home)
Neighborhood map
What this means for you Summary
Snapshot
- This is a 3-bed/2.5-bath townhouse listed at $251k. Condition is rated good.
Deal economics
- At list price, monthly cash flow is $-2 ($-20/yr) — negative.
- To cash-flow at today's rent, offer at most $248k (1.2% below list).
- To meet the 1% rule (rent ≥ 1% of price), the offer needs to be $217k (13.6% below list).
- Recommended offer: $217k (13.6% below list) — sets the bar for 1% rule.
- Cap rate 6.3% vs local median 4.0% in Mauldin — top-decile yield for the area; either an underpriced asset or a hidden risk that comps aren't pricing in. Stress-test before assuming the spread holds.
Location & tenants
- Location reads 87/100 on livability (#2 in SC, #321 nationally) — a professional / high-income tenant draw. Strengths: commute A+, cost of living A+, housing A+.
- Greenville 01 (suburban): math 44% / reading 54% proficiency, ranked #10 of 80 in SC (top 12%) — families likely to look elsewhere, expect single-tenant / working-renter base with shorter leases.
- Market conditions: Rents rising (+3.7%/yr); 410 active listings in the ZIP; 6 comparable units currently listed for rent nearby; rentals leasing fast (median 5d on market — plan ~1-2 weeks tenant-placement turnaround); 5,595 units permitted in Greenville County in 2024 (566 in 5+ unit buildings).
- This rent runs 40% of the median local income ($66k/yr) — at the standard rent-burdened threshold; future hikes will face affordability resistance.
Forward outlook
- Local home prices are declining (-3.0%/yr); year-one equity from $2k of loan paydown is wiped out by about $7k of value loss. Plan a longer hold.
- Greenville County population projected at +34% by 2050 — long-run rental-demand tailwind backs the buy-and-hold thesis.
Negotiation context
- It's been on market 78 days — a 6% lower offer ($236k) is reasonable based on typical stale-listing flexibility.
Questions for the listing agent
- What do current leases actually rent for vs. the listed asking? Can we see a recent rent roll and the last 12 months of T-12 income?
- It's been on market 78 days. Have you received any prior offers? Is the seller open to a 14% concession, seller financing, or rate buy-down credit?
- Why hasn't it sold? Are there any deal-killer items the seller is aware of (foundation, flood, title, zoning, code violations)?
- Is there a deadline driving the sale (1031 exchange, divorce, estate, relocation)? That informs how much negotiation room exists.
- Schools are A-rated — typically a magnet for longer-tenancy family renters. What's the average tenant stay here, and is there a school-zone premium baked into asking?
- The area grade is low — what's the realistic commute time and amenity access for the typical tenant pool here? Any planned neighborhood developments (good or bad) we should know about?
- What's the average days-on-market for RENTAL listings here right now (not sales)? A rising rental-DOM trend means longer vacancies and softer asking-rent achievability than the comps imply.
- What's the recent tenant-quality profile in this submarket — average credit score on applications, eviction rate, late-payment / NSF rate, and stable-employment percentage? A property-management company in the area should have these aggregated.
- How much new for-sale + rental construction is in the pipeline within 1–3 miles? Heavy new supply typically softens prices + rents 12–24 months out; constrained supply supports both.
Investment metrics
- 1% rule
- 0.87% ✗
- Cap rate
- 6.28%
- Cash-on-cash
- -0.03%
- DSCR
- 1.00
- GRM
- 9.5
CMA / ARV
- ARV (on-the-fly)
- $248,150
- Comps found
- 2
Show comp detail 2 sales within ~0.75 mi
| Address | Dist | Beds/Ba | Sqft | Sold | Price | $/sf | Match |
|---|---|---|---|---|---|---|---|
| 342 Chapelwood Way Lot 1143 | 0.68mi | 3/2.5 | 1,443 (+2%) | 16mo | $239,900 | $166 | 53 |
| 319 Chapelwood Way | 0.68mi | 3/2.5 | 1,429 (+1%) | 23mo | $249,900 | $175 | 48 |
Match score weights: distance 35% · size 25% · config 20% · recency 20%. Top-matched comps best support the ARV.
Projected returns pro-forma
-3.0% appreciation · 3.72% rent growth · sell at horizon
- IRR
- -15.5%
- Equity multiple
- 0.44×
- Total profit
- $-38,703
- Equity at exit
- $37,000
- IRR
- -5.8%
- Equity multiple
- 0.61×
- Total profit
- $-27,118
- Equity at exit
- $21,455
Cash invested: $69,482 (down + closing). Projections, not guarantees.
Landlord ↔ Tenant lean methodology
- Overall (STATE)
- 90 Strongly Landlord-Friendly
- State South Carolina
- 90 Strongly Landlord-Friendly · R+6
- County
- — inherits STATE
- City
- — inherits STATE
ZIP-level market 29605
- Rents YoY
- 3.7%
- Active inventory
- 410
- Price-to-rent
- 9.6×
Monthly cashflow live
- Estimated rent
- $2,169 high interval (Pro) →
- Mortgage (P&I)
- −$1,301
- Tax est. 1.5%
- −$310 /mo · $3,722/yr
- Insurance
- −$103
- HOA
- −$0
- Vacancy / Maint / Mgmt
- −$455
- Net cashflow
- $-2
Break-even live
Sensitivity live
| Price | -10% $170 | -5% $84 | +0% $-2 | +5% $-87 | +10% $-173 |
|---|---|---|---|---|---|
| Rent | -10% $-173 | -5% $-87 | +0% $-2 | +5% $84 | +10% $170 |
| Rate | -1.0pp $123 | -0.5pp $61 | base $-2 | +0.5pp $-66 | +1.0pp $-131 |
UW: 25.0% down · 7.5% · 30yr · 1.5% tax · 5.0% vac · 8.0% maint · 8.0% mgmt
Financing live
Cash to close
- Down payment
- $62,038
- Closing costs
- $7,444
- Reserves months
- —
- Total cash needed
- —
Loan-product check · same deal, 3 products live
Conventional
25% down · 7.5% · 30yr
- Down + closing
- —
- Monthly P&I
- —
- Monthly cashflow
- —
- DSCR
- —
- Eligible?
- —
Personal DTI + credit; lowest rate.
DSCR
20% down · 8.5% · 30yr
- Down + closing
- —
- Monthly P&I
- —
- Monthly cashflow
- —
- DSCR
- —
- Eligible?
- —
No personal income docs; deal must DSCR.
Hard money
10% down · 12.0% · 12mo
- Down + closing
- —
- Monthly P&I
- —
- Monthly cashflow
- —
- DSCR
- —
- Eligible?
- —
Short-term bridge; refi at stabilization.
Rent comps 6 comps
| Address | Beds | Baths | Sqft | Rent | $/sqft | DOM | Units | Dist |
|---|---|---|---|---|---|---|---|---|
| 476 Pollyanna Dr Greenville, SC | 3.0–4.0 | 2.0–2.5 | 1749 | $1,875 | $1.07 | 5d | 1 | 0.85mi |
| 204 Yukon Dr Greenville, SC | 3.0 | 2.0 | 1344 | $1,899 | $1.41 | 4d | 1 | 0.90mi |
| 132 Portchester Ln Greenville, SC | 4.0 | 2.0 | 1680 | $2,049 | $1.22 | 25d | 1 | 1.04mi |
| 1 Southern Pine Dr Greenville, SC | 3.0–5.0 | 2.5–3.0 | 2058 | $2,369 | $1.15 | 5d | 1 | 1.12mi |
| 11 Pequot Dr Greenville, SC | 3.0 | 2.0 | 1595 | $2,599 | $1.63 | 5d | 1 | 1.41mi |
| 517 Spokane Dr Simpsonville, SC | 3.0 | 2.0 | 1601 | $2,399 | $1.50 | 13d | 1 | 1.43mi |
Listing history 15 events
-
2026-06-22days on market $250,990 Active 78 DOM
-
2026-06-18days on market $250,990 Active 75 DOM
-
2026-06-17days on market $250,990 Active 74 DOM
-
2026-06-16days on market $250,990 Active 73 DOM
-
2026-06-15days on market $250,990 Active 72 DOM
-
2026-06-13days on market $250,990 Active 70 DOM
-
2026-06-13days on market $250,990 Active 69 DOM
-
2026-06-10days on market $250,990 Active 67 DOM
-
2026-06-09days on market $250,990 Active 66 DOM
-
2026-06-08days on market $250,990 Active 65 DOM
-
2026-06-07days on market $250,990 Active 64 DOM
-
2026-06-03days on market $250,990 Active 60 DOM
-
2026-06-03days on market $250,990 Active 59 DOM
-
2026-06-01days on market $250,990 Active 58 DOM
-
2026-05-31days on market $250,990 Active 57 DOM
ⓘ Source: listings_history table (triggers on properties + properties_extension) + one-shot
backfill from property_details.listing_events for pre-trigger history.
Nearby sold comps map
Loading sold comps map…
Walkable amenities ~0.75 mi
Loading nearby amenities…
Taxation est. · year 1
- Rental income
- $26,024
- − Mortgage interest
- −$13,900
- − Property taxes
- −$3,722
- − Insurance
- −$1,241
- − Repairs & maintenance
- −$2,082
- − Management
- −$2,082
- − Depreciation
- −$7,219
- Taxable loss
- −$4,222
- Est. tax savings @ 24.0%
- +$1,013
- After-tax cash flow
- $993/yr
For passive investors: Depreciation is non-cash, so a rental often shows a tax loss while cash-flowing — sheltering income. Rental losses are passive: they offset passive income freely, and up to $25,000/yr can offset ordinary (W-2) income if you actively participate and your MAGI is under $100k (phasing out to $0 by $150k); unused losses carry forward. On sale, claimed depreciation is recaptured at up to 25%, and gains may owe capital-gains tax (a 1031 exchange can defer both). Figures are a year-1 estimate at your 24.0% rate — not tax advice; consult a CPA.
Condition & rehab AI · 12 photos
This modern townhouse is in excellent condition with a good condition score of 80. It is move-in ready with no visible repairs needed and offers high ROI updates that can increase both resale and rental value.
Value-add opportunities
- Both Painting the exterior and interior walls — Fresh paint can enhance curb appeal and interior aesthetics.
- Both Updating the flooring in the bathrooms — Modern flooring can improve the look and feel of the bathrooms.
- Both Adding smart home features — Smart home features can increase both resale and rental value by making the home more convenient and energy-efficient.
Renovation cost estimate screening
Value-add ROI direction
- Both Painting the exterior and interior walls — Fresh paint can enhance curb appeal and interior aesthetics. ↑
- Both Updating the flooring in the bathrooms — Modern flooring can improve the look and feel of the bathrooms. ↑
- Both Adding smart home features — Smart home features can increase both resale and rental value by making the home more convenient and energy-efficient. ↑
ⓘ Cost ranges are severity-bucket heuristics (US national rule-of-thumb). Get contractor quotes + a written scope before underwriting a rehab budget.
Schools (NCES district)
- District
- Greenville 01
- NCES district ID
- 4502310
- Math proficiency
- 44% ▼ -10.00%
- Reading proficiency
- 54% ▼ -2.00%
- Median HH income
- $49,596
- Composite
- 41.88/100
- National rank
- #3370
- State rank
- #10 of 80 in SC
Livability — Mauldin
- Score
- 87/100
- State rank
- #2
- US rank
- #321
Category grades
Schools grade is shown separately in the Schools card above.
Census & demographics
- Census place
- Mauldin, SC
- County
- Greenville County · 573,815 people
- City population
- 14,950
- Metro
- Greenville-Anderson, SC
- Population (ZIP)
- 40,717
- Household income
- $65,648
- Rent vs Own
- Severe rent burden
- 978.0
Population outlook (Greenville County) Hauer SSP2
- Today (2025)
- 574,580 people
- By 2030
- 615,615 · +7.1%
- By 2040
- 695,373 · +21.0%
- By 2050
- 769,367 · +33.9%
- By 2075
- 933,296 · +62.4%
- By 2100
- 1,029,196 · +79.1%
Race, ethnicity, and origin ACS 2023
- Neighborhood character
- Diverse neighborhood (Simpson 0.66)
- Race & ethnicity
- White 45% Black 32% Hispanic / Latino 17% Two or more races 8%
- Hispanic origin (detail)
- Mexican 11%
- Common ancestry
- Slovak 3% Serbian 2% Italian 2%
- Foreign-born
- 9% · Canada, Jamaica
- Languages at home
- 85% English-only · Spanish 13% Other Indo-European 1%
Political lean MEDSL · Greenville
- 2024 margin
- Strong R (+22.2) · D 38.0% · R 60.2% · Other 1.8%
- 2008→2024 swing
- +1.7pp toward D · 2008: -23.9pp · 2024: -22.2pp
- All cycles
- 2024: R+22.2 2020: R+18.2 2016: R+24.7 2012: R+27.8 2008: R+23.9
Not yet ingested
- Civics
- —
Market trends
- HPI YoY
- ▼ -591.71%
- Current HPI
- 231.6906
- Rent YoY
- ▲ 3.72%
- Metro
- Greenville-Anderson, SC
- State GDP YoY
- ▲ 4.51%
- F500 in state
- 2
Industry mix (Fortune 500 HQ in SC)
| Industry | F500 HQs | Revenue |
|---|---|---|
| Packaging | 1 | $7B |
|
||
Cash-flow waterfall
monthlySold comps — $/sqft
last 12 mo · ≤1 miLoading sold comps…