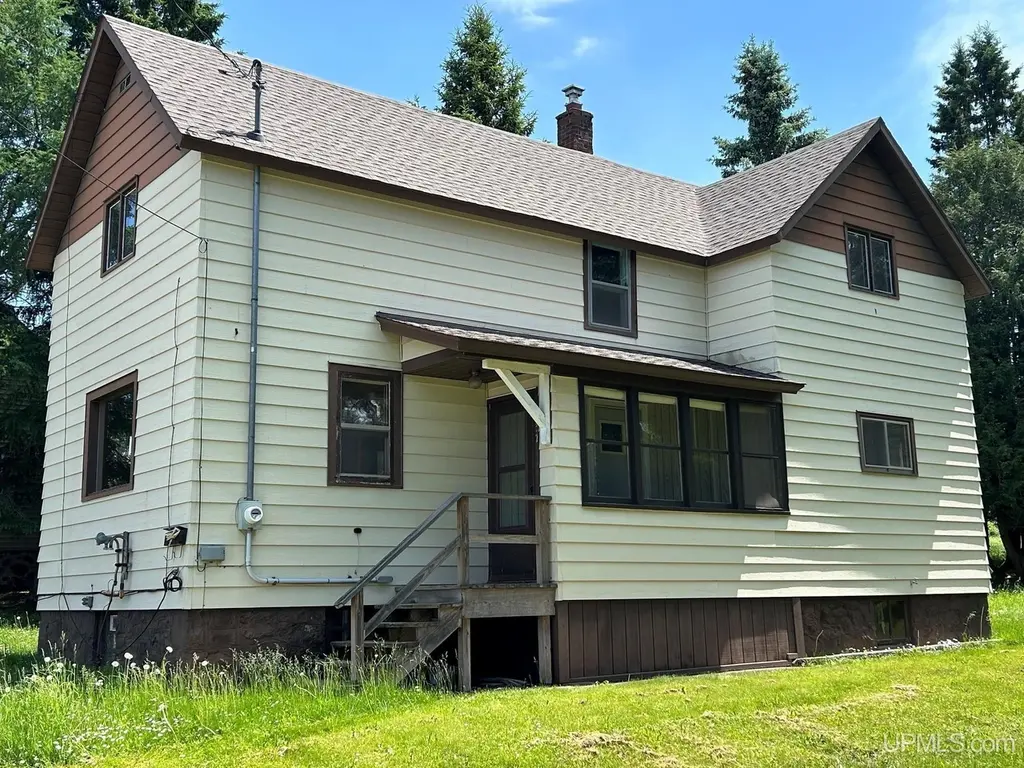
237 E Pine St · Ironwood, MI
Flood risk 1/10 · Minimal
- FEMA flood zone
- X
- Chance of flooding over 30 yrs
- 0.0%
- Est. flood insurance / yr
- $473 – $860
Fire risk 1/10 · Minimal
- Est. fire insurance / yr
- $784 – $1,456
Heat risk 1/10 · Minimal
- Hot days now (above 89°F)
- 7 days/yr
- Hot days in 30 yrs
- 13 days/yr
Wind risk 1/10 · Minimal
- Chance of severe wind over 30 yrs
- —
Air-quality risk 1/10 · Minimal
- Unhealthy air days now
- 0 days/yr
- Unhealthy air days in 30 yrs
- 0 days/yr
Risk factors via First Street. Map © Google.
Why this score? — see what drove the B+ grade
The composite is a weighted blend of 9 inputs, each scored 0–100. Each bar is that input's sub-score; the figure is the points it added to the 100-point composite (weight × sub-score).
- Cash flow +30.0/30.0
- ARV discount +15.0/15.0
- 1% rule +10.0/10.0
- DSCR +10.0/10.0
- Livability +3.5/5.0
- Schools +2.6/10.0
- Rent growth +2.5/5.0
- Condition / age +2.5/5.0
- Appreciation +0.0/10.0
$49,900
🖨 Deal sheet (PDF) 📄 Offer letter ✓ Due diligence
Listing remarks MLS
This low cost Ironwood home is perfect for those on a budget those who can do it themselves. The sellers have you off to an excellent start but replacing a bowed foundation wall, installing a new roof in the last year and refinishing ALL the hardwood floors in the home. If you can put in the kitchen cabinets, finish the bathrooms and finish the install of the hot water heating system you will have yourself a very nice home set up the way you want it with sweat equity in place.
Key facts
- Kitchen cabinets
- New roof
- 0.25 acre lot
Tags
Property features AI
Finance
- Other: No pet restrictions; Property zoned residential; Located on a paved street in a city setting (Ironwood), subdivision: Norrie Addition
Exterior
- Parking: 2 to 3+ parking spaces available
- Utilities: 100 Amp electric service; Natural gas available and connected; Public water (to property and at street); Public sanitary sewer (to property and at street); Cable, phone, and internet (Spectrum) available
- Home design: Residential fixer-upper; 1½-story structure; Built in 1920; Below-grade area present (~700 sq ft finished below grade listed as 0)
- Construction: Block foundation; Michigan-style basement
- Exterior features: Aluminum exterior; Porch; Sidewalks; Large lot frontage (80')
Interior
- Kitchen: Kitchen on main level (approx. 10 x 10); Kitchen flooring finished in wood; No appliances included
- Bedrooms: First-floor bedroom available; Upper-level bedrooms (three total); bedroom sizes include 9 x 12, 8 x 10, and approximately 11'; Bedroom floors finished in wood
- Flooring: Wood flooring throughout primary living areas (living room, dining, kitchen, bedrooms); Linoleum in main-level lavatory
- Bathrooms: One full bathroom and two total lavatories; Main-level lavatory approx. 6 x 6 with linoleum flooring; Second-level bathroom approx. 7 x 6
- Heating & cooling: Natural gas heating with boiler; No central cooling listed; Water heater is electric
- Interior features: Cable/Internet available; Hardwood floors; Has basement (block/Michigan basement)
- Laundry & utility: Basement present (utility/laundry likely located in basement)
Neighborhood map
What this means for you Summary
Snapshot
- This is a 3-bed/1.5-bath single-family listed at $50k.
Deal economics
- At list price, monthly cash flow is $727 ($9k/yr) — positive.
- The deal already cash-flows at list — no discount required.
- Meets the 1% rule at list price ($1k rent vs $50k).
- Cap rate 23.8% vs local median 5.7% in Ironwood — top-decile yield for the area; either an underpriced asset or a hidden risk that comps aren't pricing in. Stress-test before assuming the spread holds.
Location & tenants
- Location reads 70/100 on livability (#325 in MI) — a middle-class / working-renter tenant base. Strengths: cost of living A+, crime A, housing A; Watch: health & safety C-, amenities F, commute F.
- Ironwood Area Schools Of Gogebic County (town): math 23% / reading 40% proficiency, ranked #361 of 540 in MI (top 67%) — families likely to look elsewhere, expect single-tenant / working-renter base with shorter leases.
- Zoned schools: Gogebic Co Community Education (28 students, 79% FRL) — zoned schools average 79% FRL vs 49% district-wide (29 pts higher); higher-poverty schools than district average — tighter screening recommended.
- Market conditions: 70 active listings in the ZIP; 28 units permitted in Gogebic County in 2024 (0 in 5+ unit buildings).
Forward outlook
- Local home prices are declining (-3.0%/yr); year-one equity from $345 of loan paydown is wiped out by about $1k of value loss. Plan a longer hold.
- Gogebic County population projected at -24% by 2050 — secular population decline; favor cash flow + early exit over multi-decade hold.
- At projected returns (-3.0% appreciation + 3.0% rent growth), your $14k cash investment doubles in ~2 years — after that, you're playing with house money.
Negotiation context
- Only 5 days on market — expect competitive offers; lowballing is unlikely to land.
- 4 sale attempts since 2y ago with the ask held roughly flat each time — persistent listings suggest the price (not the market) is what's stuck; bring a comps-based counter.
Risks & watch-outs
- Watch-outs: built in 1920 — expect roof / HVAC / electrical / plumbing capex.
Questions for the listing agent
- Built in 1920 — when were the roof, HVAC, electrical panel, plumbing, and water heater last replaced?
- Is there a deadline driving the sale (1031 exchange, divorce, estate, relocation)? That informs how much negotiation room exists.
- Schools are D-rated, which usually means shorter tenancies and higher turnover. Who's the typical renter profile here, and what's been the actual vacancy rate?
- What's the average days-on-market for RENTAL listings here right now (not sales)? A rising rental-DOM trend means longer vacancies and softer asking-rent achievability than the comps imply.
- What's the recent tenant-quality profile in this submarket — average credit score on applications, eviction rate, late-payment / NSF rate, and stable-employment percentage? A property-management company in the area should have these aggregated.
- How much new for-sale + rental construction is in the pipeline within 1–3 miles? Heavy new supply typically softens prices + rents 12–24 months out; constrained supply supports both.
Investment metrics
- 1% rule
- 2.71% ✓
- Cap rate
- 23.78%
- Cash-on-cash
- 62.44%
- DSCR
- 3.78
- GRM
- 3.1
CMA / ARV
- ARV (on-the-fly)
- $83,664
- Comps found
- 12
Show comp detail 12 sales within ~0.75 mi
| Address | Dist | Beds/Ba | Sqft | Sold | Price | $/sf | Match |
|---|---|---|---|---|---|---|---|
| 101 W Birch St | 0.26mi | 3/1.0 | 1,008 (+1%) | 1mo | $120,000 | $119 | 83 |
| 338 E Tamarack St | 0.14mi | 3/1.5 | 1,056 (+6%) | 3mo | $70,000 | $66 | 81 |
| 325 Houk St | 0.10mi | 2/1.0 (-1) | 960 (-4%) | 8mo | $86,000 | $90 | 76 |
| 217 E Oak St | 0.07mi | 4/1.0 (+1) | 960 (-4%) | 10mo | $62,900 | $66 | 76 |
| 111 E Ash St | 0.28mi | 3/1.0 | 1,105 (+11%) | 1mo | $120,000 | $109 | 66 |
| 209 E Pine St | 0.05mi | 2/1.0 (-1) | 912 (-8%) | 16mo | $77,000 | $84 | 63 |
| 119 W Oak St | 0.22mi | 2/1.0 (-1) | 870 (-13%) | 7mo | $52,510 | $60 | 56 |
| 102 W Ash St | 0.28mi | 2/1.0 (-1) | 1,142 (+15%) | 6mo | $74,900 | $66 | 50 |
| 122 N Curry St | 0.65mi | 3/2.0 | 1,040 (+4%) | 12mo | $90,000 | $87 | 50 |
| 102 N Mansfield St | 0.61mi | 3/1.5 | 1,100 (+10%) | 9mo | $39,900 | $36 | 46 |
| 334 W Ayer St | 0.74mi | 3/1.0 | 1,120 (+12%) | 6mo | $20,000 | $18 | 38 |
| 230 W Frederick St | 0.72mi | 2/1.0 (-1) | 1,083 (+9%) | 12mo | $139,000 | $128 | 34 |
Match score weights: distance 35% · size 25% · config 20% · recency 20%. Top-matched comps best support the ARV.
Projected returns pro-forma
-3.0% appreciation · 3.0% rent growth · sell at horizon
- IRR
- 61.4%
- Equity multiple
- 3.74×
- Total profit
- $38,238
- Equity at exit
- $7,440
- IRR
- 66.0%
- Equity multiple
- 7.66×
- Total profit
- $92,995
- Equity at exit
- $4,314
Cash invested: $13,972 (down + closing). Projections, not guarantees.
Landlord ↔ Tenant lean methodology
- Overall (STATE)
- 62 Landlord-Friendly
- State Michigan
- 62 Landlord-Friendly · EVEN
- County
- — inherits STATE
- City
- — inherits STATE
ZIP-level market 49938
- Home prices YoY
- -23.3%
- Active inventory
- 70
- Price-to-rent
- 3.1×
Monthly cashflow live
- Estimated rent
- $1,352 medium interval (Pro) →
- Mortgage (P&I)
- −$262
- Tax from tax record
- −$58 /mo · $699/yr
- Insurance
- −$21
- HOA
- −$0
- Vacancy / Maint / Mgmt
- −$284
- Net cashflow
- $727
Break-even live
Sensitivity live
| Price | -10% $755 | -5% $741 | +0% $727 | +5% $713 | +10% $699 |
|---|---|---|---|---|---|
| Rent | -10% $620 | -5% $674 | +0% $727 | +5% $780 | +10% $834 |
| Rate | -1.0pp $752 | -0.5pp $740 | base $727 | +0.5pp $714 | +1.0pp $701 |
UW: 25.0% down · 7.5% · 30yr · 1.5% tax · 5.0% vac · 8.0% maint · 8.0% mgmt
Financing live
Cash to close
- Down payment
- $12,475
- Closing costs
- $1,497
- Reserves months
- —
- Total cash needed
- —
Loan-product check · same deal, 3 products live
Conventional
25% down · 7.5% · 30yr
- Down + closing
- —
- Monthly P&I
- —
- Monthly cashflow
- —
- DSCR
- —
- Eligible?
- —
Personal DTI + credit; lowest rate.
DSCR
20% down · 8.5% · 30yr
- Down + closing
- —
- Monthly P&I
- —
- Monthly cashflow
- —
- DSCR
- —
- Eligible?
- —
No personal income docs; deal must DSCR.
Hard money
10% down · 12.0% · 12mo
- Down + closing
- —
- Monthly P&I
- —
- Monthly cashflow
- —
- DSCR
- —
- Eligible?
- —
Short-term bridge; refi at stabilization.
Listing history 6 events
-
2026-06-21days on market $49,900 Active 5 DOM
-
2026-06-21days on market $49,900 Active 4 DOM
-
2026-06-18remarks 488-char remark
-
2026-06-18days on market $49,900 Active 2 DOM
-
2026-06-17remarks 481-char remark
-
2026-06-17$49,900 Active 1 DOM
ⓘ Source: listings_history table (triggers on properties + properties_extension) + one-shot
backfill from property_details.listing_events for pre-trigger history.
Tax reassessment forecast MI · Partial reset (capped growth)
- Current annual tax
- $699 · $58/mo
- Projected year-2 tax
- $734 · $61/mo
- Expected delta
- +$35/yr (+$3/mo · 5.0%)
ⓘ Screening estimate from a state-policy table — verify with the county assessor before closing.
Climate risk First Street
- Flood 1/10 Low FEMA zone X · 0% chance over 30 yrs
- Wildfire 1/10 Low
- Heat 1/10 Low 7 d/yr ≥89°F today · 13 d/yr by 30 yrs out
- Wind 1/10 Low
- Air quality 1/10 Low 0 unhealthy d/yr today · 0 by 30 yrs out
Nearby sold comps map
Loading sold comps map…
Walkable amenities ~0.75 mi
Loading nearby amenities…
Taxation est. · year 1
- Rental income
- $16,219
- − Mortgage interest
- −$2,795
- − Property taxes
- −$699
- − Insurance
- −$250
- − Repairs & maintenance
- −$1,298
- − Management
- −$1,298
- − Depreciation
- −$1,452
- Taxable income
- $8,429
- Est. tax owed @ 24.0%
- −$2,023
- After-tax cash flow
- $6,702/yr
For passive investors: Depreciation is non-cash, so a rental often shows a tax loss while cash-flowing — sheltering income. Rental losses are passive: they offset passive income freely, and up to $25,000/yr can offset ordinary (W-2) income if you actively participate and your MAGI is under $100k (phasing out to $0 by $150k); unused losses carry forward. On sale, claimed depreciation is recaptured at up to 25%, and gains may owe capital-gains tax (a 1031 exchange can defer both). Figures are a year-1 estimate at your 24.0% rate — not tax advice; consult a CPA.
Schools (NCES district)
- District
- Ironwood Area Schools Of Gogebic County
- NCES district ID
- 2619470
- Math proficiency
- 23% ▼ -13.00%
- Reading proficiency
- 40% ▼ -5.00%
- Median HH income
- $33,313
- Composite
- 25.78/100
- National rank
- #7369
- State rank
- #361 of 540 in MI
Livability — Ironwood
- Score
- 70/100
- State rank
- #325
- US rank
- #8024
Category grades
Schools grade is shown separately in the Schools card above.
Census & demographics
- Census place
- Ironwood, MI
- Population (ZIP)
- 7,424
Population outlook (Gogebic County) Hauer SSP2
- Today (2025)
- 13,951 people
- By 2030
- 13,191 · -5.4%
- By 2040
- 11,739 · -15.9%
- By 2050
- 10,580 · -24.2%
- By 2075
- 8,530 · -38.9%
- By 2100
- 6,903 · -50.5%
Race, ethnicity, and origin ACS 2023
- Neighborhood character
- Predominantly White (94%)
- Race & ethnicity
- White 94% Two or more races 3% Hispanic / Latino 2%
- Common ancestry
- Romanian 10% Lithuanian 4% Portuguese 3%
- Foreign-born
- 1%
- Languages at home
- 97% English-only · Spanish 2%
Political lean MEDSL · Gogebic
- 2024 margin
- R (+17.1) · D 40.8% · R 57.9% · Other 1.2%
- 2008→2024 swing
- -34.4pp toward R · 2008: 17.3pp · 2024: -17.1pp
- All cycles
- 2024: R+17.1 2020: R+12.5 2016: R+15.0 2012: D+8.1 2008: D+17.3
Not yet ingested
- Civics
- —
Market trends
- HPI YoY
- ▼ -61.86%
- Current HPI
- 204.0924
- Rent YoY
- —
- Metro
- —
- State GDP YoY
- ▲ 1.37%
- F500 in state
- 28
Industry mix (Fortune 500 HQ in MI)
| Industry | F500 HQs | Revenue |
|---|---|---|
| Automotive Parts | 3 | $48B |
|
||
| Automotive | 2 | $372B |
|
||
| Chemicals | 1 | $45B |
|
||
| Automotive Retail | 1 | $29B |
|
||
| Healthcare / Medical Devices | 1 | $23B |
|
||
| Automotive Technology | 1 | $20B |
|
||
Price history
-9.3% since first listed8 events — show timeline
- 2026-06-16 Listed $49,900 UPAR
- 2026-06-15 Listed $49,900 MiRealSource-MiMLS
- 2024-06-27 Sold (MLS) $45,000 MiRealSource-MiMLS
- 2024-06-27 Sold (MLS) $45,000 UPAR
- 2024-06-13 Pending — UPAR
- 2024-06-13 Pending — MiRealSource-MiMLS
- 2024-06-03 Listed $55,000 UPAR
- 2024-06-03 Listed $55,000 MiRealSource-MiMLS
Property tax history
+33.2%/yrLatest (2024): $699 · +77.4% YoY. Source: county tax records.
Cash-flow waterfall
monthlySold comps — $/sqft
last 12 mo · ≤1 miLoading sold comps…