9305 Dassler Spgs · Converse, TX
Flood risk 1/10 · Minimal
- FEMA flood zone
- X (unshaded)
- Chance of flooding over 30 yrs
- 0.0%
- Est. flood insurance / yr
- $507 – $1,088
Fire risk 5/10 · Moderate
- Est. fire insurance / yr
- $1,222 – $2,270
Heat risk 8/10 · Major
- Hot days now (above 108°F)
- 6 days/yr
- Hot days in 30 yrs
- 19 days/yr
Wind risk 8/10 · Major
- Chance of severe wind over 30 yrs
- 80.0%
Air-quality risk 1/10 · Minimal
- Unhealthy air days now
- 0 days/yr
- Unhealthy air days in 30 yrs
- 0 days/yr
Risk factors via First Street. Map © Google.
Why this score? — see what drove the D+ grade
The composite is a weighted blend of 9 inputs, each scored 0–100. Each bar is that input's sub-score; the figure is the points it added to the 100-point composite (weight × sub-score).
- Cash flow +14.0/30.0
- ARV discount +12.7/15.0
- Condition / age +4.8/5.0
- DSCR +4.2/10.0
- 1% rule +4.1/10.0
- Livability +3.3/5.0
- Schools +2.4/10.0
- Rent growth +2.2/5.0
- Appreciation +0.0/10.0
$224,999
🖨 Deal sheet (PDF) 📄 Offer letter ✓ Due diligence
Listing remarks
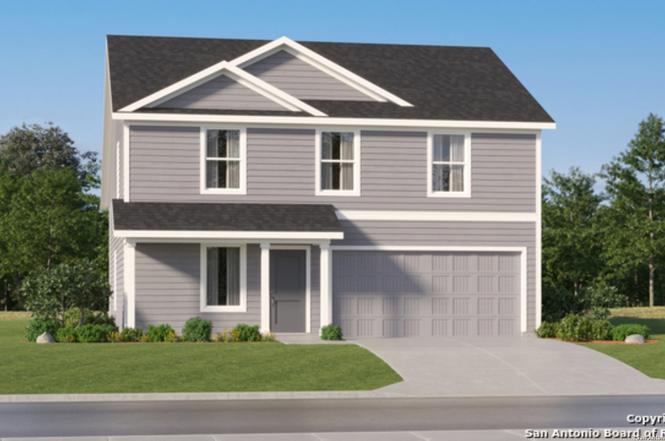
The Littleton - On the first floor of this spacious two-story home is a convenient and modern layout seamlessly connecting the kitchen, dining room and family room together. In a private corner is the tranquil owner's suite with an attached bathroom and walk-in closet. Upstairs is a sprawling central game room made for gatherings of all sizes, along with three secondary bedrooms to provide sleeping accommodations. Estimated Completion May 2026. The completion date, prices and features may vary and are subject to change. Please verify with Lennar directly. Photos are for illustrative purposes only.
Key facts
- Central game room
- Attached bathroom
- Walk-in closet
Tags
Neighborhood map
What this means for you Summary
Snapshot
- This is a 4-bed/2.5-bath single-family listed at $225k. Condition is rated excellent.
Deal economics
- At list price, monthly cash flow is $28 ($333/yr) — positive.
- The deal already cash-flows at list — no discount required.
- To meet the 1% rule (rent ≥ 1% of price), the offer needs to be $204k (9.2% below list).
- Recommended offer: $204k (9.2% below list) — sets the bar for 1% rule.
- Cap rate 6.4% vs local median 4.4% in Converse — top-decile yield for the area; either an underpriced asset or a hidden risk that comps aren't pricing in. Stress-test before assuming the spread holds.
Location & tenants
- Location reads 66/100 on livability (#649 in TX) — a middle-class / working-renter tenant base. Strengths: cost of living A+, housing A+, employment B; Watch: crime C-, amenities F, commute F.
- Judson ISD (suburban): math 21% / reading 33% proficiency, ranked #660 of 826 in TX (top 80%) — low school quality limits family demand, transient renter base, plan for 1-2y turnover.
- Zoned schools: Converse El (math 21% / reading 30%, grade F, #2,982 of 4,322 statewide, top 70%, 604 students, 63% FRL); Judson Middle (math 21% / reading 34%, grade F, #1,156 of 1,662 statewide, top 71%, 1,259 students, 70% FRL); Judson H S (math 19% / reading 38%, grade F, #1,157 of 1,632 statewide, top 72%, 2,666 students, 62% FRL).
- Market conditions: Rents soft (-1.1%/yr); 1219 active listings in the ZIP; 40 comparable units currently listed for rent nearby; rentals at typical pace (median 26d on market — plan ~3-4 weeks tenant-placement turnaround); solid renter incomes; 8,308 units permitted in Bexar County in 2024 (2,506 in 5+ unit buildings).
Forward outlook
- Local home prices are declining (-3.0%/yr); year-one equity from $2k of loan paydown is wiped out by about $7k of value loss. Plan a longer hold.
- Bexar County population projected at +50% by 2050 — long-run rental-demand tailwind backs the buy-and-hold thesis.
Negotiation context
- It's been on market 15 days — a 2% lower offer ($222k) is reasonable based on typical stale-listing flexibility.
- 2 sale attempts; this cycle's ask has dropped $19k (8%) from the opening price — seller is motivated, your offer sets the floor, not the list.
Risks & watch-outs
- Climate carrying-cost: severe wind risk, 80% chance of damaging wind over 30y; moderate wildfire risk; extreme-heat days projected 6→19/yr by 2055 (HVAC capex compounding) — expect insurance premiums to compound above CPI over the hold.
Questions for the listing agent
- What does the HOA fee cover, when was the last increase, and are there any pending special assessments or reserve-fund shortfalls?
- Is there a deadline driving the sale (1031 exchange, divorce, estate, relocation)? That informs how much negotiation room exists.
- The area grade is low — what's the realistic commute time and amenity access for the typical tenant pool here? Any planned neighborhood developments (good or bad) we should know about?
- What's the average days-on-market for RENTAL listings here right now (not sales)? A rising rental-DOM trend means longer vacancies and softer asking-rent achievability than the comps imply.
- What's the recent tenant-quality profile in this submarket — average credit score on applications, eviction rate, late-payment / NSF rate, and stable-employment percentage? A property-management company in the area should have these aggregated.
- How much new for-sale + rental construction is in the pipeline within 1–3 miles? Heavy new supply typically softens prices + rents 12–24 months out; constrained supply supports both.
Investment metrics
- 1% rule
- 0.91% ✗
- Cap rate
- 6.44%
- Cash-on-cash
- 0.53%
- DSCR
- 1.02
- GRM
- 9.2
CMA / ARV
- ARV (on-the-fly)
- $254,475
- Comps found
- 12
Show comp detail 12 sales within ~0.75 mi
| Address | Dist | Beds/Ba | Sqft | Sold | Price | $/sf | Match |
|---|---|---|---|---|---|---|---|
| 9305 Dassler Spgs | 0.00mi | 4/2.5 | 1,885 (0%) | 1mo | $224,999 | $119 | 99 |
| 6624 Titan Park | 0.03mi | 3/2.0 (-1) | 1,904 (+1%) | 1mo | $266,999 | $140 | 89 |
| 6514 Titan Park | 0.10mi | 3/2.0 (-1) | 1,904 (+1%) | 1mo | $265,000 | $139 | 86 |
| 9410 Dassler Spgs | 0.09mi | 4/3.0 | 2,024 (+7%) | 1mo | $264,999 | $131 | 80 |
| 9411 Dassler Spgs | 0.09mi | 4/3.0 | 2,024 (+7%) | 4mo | $274,999 | $136 | 78 |
| 9415 Dassler Spgs | 0.10mi | 4/3.0 | 2,024 (+7%) | 4mo | $264,999 | $131 | 78 |
| 6722 Shiraz Way | 0.15mi | 3/2.0 (-1) | 1,973 (+5%) | 4mo | $218,000 | $110 | 75 |
| 9422 Nubuck Br | 0.45mi | 4/2.0 | 1,849 (-2%) | 3mo | $369,900 | $200 | 71 |
| 6643 Titan Park | 0.06mi | 4/3.5 | 2,149 (+14%) | 5mo | $290,999 | $135 | 66 |
| 6510 Titan Park | 0.11mi | 4/3.5 | 2,149 (+14%) | 5mo | $273,999 | $128 | 64 |
| 9207 Crestway Rd | 0.17mi | 3/2.0 (-1) | 1,634 (-13%) | 2mo | $250,999 | $154 | 61 |
| 9111 Spigel Way | 0.34mi | 3/2.5 (-1) | 2,082 (+10%) | 3mo | $240,000 | $115 | 59 |
Match score weights: distance 35% · size 25% · config 20% · recency 20%. Top-matched comps best support the ARV.
Projected returns pro-forma
-3.0% appreciation · 0.0% rent growth · sell at horizon
- IRR
- -18.9%
- Equity multiple
- 0.36×
- Total profit
- $-40,630
- Equity at exit
- $33,548
- IRR
- -19.4%
- Equity multiple
- 0.11×
- Total profit
- $-56,045
- Equity at exit
- $19,454
Cash invested: $63,000 (down + closing). Projections, not guarantees.
Landlord ↔ Tenant lean methodology
- Overall (STATE)
- 87 Strongly Landlord-Friendly
- State Texas
- 87 Strongly Landlord-Friendly · R+5
- County
- — inherits STATE
- City
- — inherits STATE
ZIP-level market 78109
- Home prices YoY
- -17.8%
- Rents YoY
- -1.1%
- Active inventory
- 1219
- Price-to-rent
- 9.2×
Monthly cashflow live
- Estimated rent
- $2,044 high interval (Pro) →
- Mortgage (P&I)
- −$1,180
- Tax est. 1.5%
- −$281 /mo · $3,375/yr
- Insurance
- −$94
- HOA
- −$32
- Lot rent
- −$0
- Vacancy / Maint / Mgmt
- −$429
- Net cashflow
- $28
Break-even live
Sensitivity live
| Price | -10% $183 | -5% $106 | +0% $28 | +5% $-50 | +10% $-128 |
|---|---|---|---|---|---|
| Rent | -10% $-134 | -5% $-53 | +0% $28 | +5% $109 | +10% $189 |
| Rate | -1.0pp $141 | -0.5pp $85 | base $28 | +0.5pp $-31 | +1.0pp $-90 |
UW: 25.0% down · 7.5% · 30yr · 1.5% tax · 5.0% vac · 8.0% maint · 8.0% mgmt
Financing live
Cash to close
- Down payment
- $56,250
- Closing costs
- $6,750
- Reserves months
- —
- Total cash needed
- —
Loan-product check · same deal, 3 products live
Conventional
25% down · 7.5% · 30yr
- Down + closing
- —
- Monthly P&I
- —
- Monthly cashflow
- —
- DSCR
- —
- Eligible?
- —
Personal DTI + credit; lowest rate.
DSCR
20% down · 8.5% · 30yr
- Down + closing
- —
- Monthly P&I
- —
- Monthly cashflow
- —
- DSCR
- —
- Eligible?
- —
No personal income docs; deal must DSCR.
Hard money
10% down · 12.0% · 12mo
- Down + closing
- —
- Monthly P&I
- —
- Monthly cashflow
- —
- DSCR
- —
- Eligible?
- —
Short-term bridge; refi at stabilization.
Rent comps 40 comps
| Address | Beds | Baths | Sqft | Rent | $/sqft | DOM | Units | Dist |
|---|---|---|---|---|---|---|---|---|
| 9338 Espadrille Run Converse, TX | 5.0 | 2.5 | 2543 | $2,197 | $0.86 | 26d | 1 | 0.19mi |
| 9219 Foxing Blfs Converse, TX | 3.0 | 2.0 | 1526 | $1,850 | $1.21 | 26d | 1 | 0.20mi |
| 9234 Foxing Blfs Converse, TX | 3.0 | 2.5 | 1414 | $1,825 | $1.29 | 5d | 1 | 0.23mi |
| 9206 Foxing Blfs Converse, TX | 5.0 | 2.5 | 2544 | $2,295 | $0.90 | 26d | 1 | 0.24mi |
| 9219 Bennett Frst Converse, TX | 3.0 | 2.0 | 1526 | $1,900 | $1.25 | 46d | 1 | 0.24mi |
| 9310 Bennett Frst Converse, TX | 4.0 | 2.5 | 2198 | $2,300 | $1.05 | 20d | 1 | 0.24mi |
| 9334 Aniston Blf Converse, TX | 4.0 | 2.5 | 2243 | $2,200 | $0.98 | 6d | 1 | 0.29mi |
| 6426 Thorpe Holw Converse, TX | 3.0 | 2.5 | 1414 | $1,600 | $1.13 | 26d | 1 | 0.31mi |
| 9142 Canvas Run Converse, TX | 5.0 | 3.0 | 2544 | $2,595 | $1.02 | 18d | 1 | 0.32mi |
| 9335 Nubuck Br Converse, TX | 4.0 | 2.5 | 2243 | $2,095 | $0.93 | 46d | 1 | 0.34mi |
| 9019 Gore Cres Converse, TX | 3.0–5.0 | 2.0–3.5 | 2058 | $2,590 | $1.26 | 0d | 1 | 0.35mi |
| 9310 Nubuck Br Converse, TX | 3.0 | 2.0 | 1525 | $1,895 | $1.24 | 6d | 1 | 0.36mi |
| 6414 Kensinger Pass Converse, TX | 3.0 | 2.5 | 1582 | $2,100 | $1.33 | 46d | 1 | 0.48mi |
| 326 Diana Dr Converse, TX | 4.0 | 2.5 | 2422 | $1,800 | $0.74 | 26d | 1 | 0.50mi |
| 6610 Eastern Clouds Converse, TX | 3.0 | 2.0 | 1496 | $1,610 | $1.08 | 1d | 1 | 0.52mi |
| 6326 Kensinger Pass Converse, TX | 4.0 | 2.5 | 2278 | $1,800 | $0.79 | 17d | 1 | 0.52mi |
| 10814 Lillia BR San Antonio, TX | 3.0 | 2.0 | 1266 | $1,600 | $1.26 | 46d | 1 | 0.56mi |
| 9714 Autumn Holw Converse, TX | 3.0 | 2.0 | 1529 | $1,650 | $1.08 | 26d | 1 | 0.57mi |
| 8818 Slumber Ln Converse, TX | 3.0 | 2.0 | 1259 | $1,700 | $1.35 | 4d | 1 | 0.57mi |
| 8827 Slumber Ln Converse, TX | 3.0 | 2.0 | 1292 | $2,000 | $1.55 | 46d | 1 | 0.59mi |
| 313 Renee Dr Converse, TX | 3.0 | 3.0 | 1884 | $1,650 | $0.88 | 26d | 1 | 0.59mi |
| 317 Vivian Dr Converse, TX | 3.0 | 2.0 | 1454 | $1,650 | $1.13 | 5d | 1 | 0.64mi |
| 8914 Kestrel Oak Converse, TX | 3.0 | 2.5 | 1582 | $1,600 | $1.01 | 26d | 1 | 0.65mi |
| 6606 Highland Grass Converse, TX | 4.0 | 2.5 | 2278 | $1,800 | $0.79 | 46d | 1 | 0.70mi |
| 9818 Copper Rose Converse, TX | 4.0 | 2.5 | 2030 | $2,075 | $1.02 | 0d | 1 | 0.70mi |
| 8818 Kestrel Oak Converse, TX | 3.0 | 2.5 | 1972 | $1,525 | $0.77 | 46d | 1 | 0.76mi |
| 7038 Cole Creek Dr Converse, TX | 3.0 | 2.5 | 1582 | $1,695 | $1.07 | 26d | 1 | 0.77mi |
| 6911 Waterfall Pass Converse, TX | 5.0 | 2.5 | 2109 | $1,840 | $0.87 | 46d | 1 | 0.78mi |
| 9711 Copper Rock Converse, TX | 3.0 | 2.0 | 1327 | $1,645 | $1.24 | 46d | 1 | 0.79mi |
| 8732 Seneca Crk Converse, TX | 3.0 | 2.5 | 1582 | $1,445 | $0.91 | 46d | 1 | 0.79mi |
| 8206 Longhorn Ridge Dr Converse, TX | 3.0 | 2.0 | 1386 | $1,525 | $1.10 | 5d | 1 | 0.79mi |
| 7306 Autumn Brk Converse, TX | 3.0 | 2.5 | 1996 | $1,519 | $0.76 | 6d | 1 | 0.79mi |
| 6123 Ironmill Crk Converse, TX | 3.0 | 2.0 | 1590 | $1,595 | $1.00 | 46d | 1 | 0.81mi |
| 6027 Kensinger Pass Converse, TX | 3.0 | 2.0 | 1332 | $1,480 | $1.11 | 6d | 1 | 0.81mi |
| 6863 Cypress Mist Dr Converse, TX | 3.0 | 2.0 | 1735 | $1,550 | $0.89 | 13d | 1 | 0.82mi |
| 9503 Copper Mist Converse, TX | 3.0 | 2.5 | 2440 | $1,850 | $0.76 | 46d | 1 | 0.83mi |
| 9619 Copper Rock Converse, TX | 3.0 | 2.0 | 1301 | $1,700 | $1.31 | 46d | 1 | 0.83mi |
| 6870 Flaming Ridge Dr Converse, TX | 3.0 | 2.0 | 1698 | $1,695 | $1.00 | 26d | 1 | 0.85mi |
| 6870 Flaming Ridge Dr Converse, TX | 3.0 | 2.5 | 1698 | $1,695 | $1.00 | 15d | 1 | 0.85mi |
| 9213 Groff Lndg Converse, TX | 3.0 | 2.0 | 1344 | $1,600 | $1.19 | 13d | 1 | 0.86mi |
HOA detail
- Monthly dues
- $32 · $384/yr
Listing history 8 events
-
2026-04-27status Pending
-
2026-04-25price $224,999
-
2026-04-22price $233,999
-
2026-04-21price $253,999
-
2026-04-20status Back on Market
-
2026-03-07status Pending
-
2026-02-28price $239,999
-
2026-02-26$243,999 New
ⓘ Source: listings_history table (triggers on properties + properties_extension) + one-shot
backfill from property_details.listing_events for pre-trigger history.
Climate risk First Street
- Flood 1/10 Low FEMA zone X (unshaded) · 0% chance over 30 yrs
- Wildfire 5/10 Major
- Heat 8/10 Severe 6 d/yr ≥108°F today · 19 d/yr by 30 yrs out
- Wind 8/10 Severe 80% chance of damaging wind over 30 yrs
- Air quality 1/10 Low 0 unhealthy d/yr today · 0 by 30 yrs out
Nearby sold comps map
Loading sold comps map…
Walkable amenities ~0.75 mi
Loading nearby amenities…
Taxation est. · year 1
- Rental income
- $24,527
- − Mortgage interest
- −$12,603
- − Property taxes
- −$3,375
- − Insurance
- −$1,125
- − Repairs & maintenance
- −$1,962
- − Management
- −$1,962
- − HOA
- −$384
- − Depreciation
- −$6,545
- Taxable loss
- −$3,430
- Est. tax savings @ 24.0%
- +$823
- After-tax cash flow
- $1,157/yr
For passive investors: Depreciation is non-cash, so a rental often shows a tax loss while cash-flowing — sheltering income. Rental losses are passive: they offset passive income freely, and up to $25,000/yr can offset ordinary (W-2) income if you actively participate and your MAGI is under $100k (phasing out to $0 by $150k); unused losses carry forward. On sale, claimed depreciation is recaptured at up to 25%, and gains may owe capital-gains tax (a 1031 exchange can defer both). Figures are a year-1 estimate at your 24.0% rate — not tax advice; consult a CPA.
Condition & rehab AI · 13 photos
This home is in excellent condition with no visible repairs needed. It offers a modern and well-maintained interior and exterior, making it a great investment for both resale and rental purposes.
Value-add opportunities
- Both Painting the exterior siding — Enhances curb appeal and can increase both resale and rental value.
- Both Landscaping improvements — Enhances curb appeal and can increase both resale and rental value.
- Both Adding smart home features — Improves convenience and can increase both resale and rental value.
- Both Upgrading the kitchen appliances — Modernizes the kitchen and can increase both resale and rental value.
Renovation cost estimate screening
Value-add ROI direction
- Both Painting the exterior siding — Enhances curb appeal and can increase both resale and rental value. ↑
- Both Landscaping improvements — Enhances curb appeal and can increase both resale and rental value. ↑
- Both Adding smart home features — Improves convenience and can increase both resale and rental value. ↑
- Both Upgrading the kitchen appliances — Modernizes the kitchen and can increase both resale and rental value. ↑
ⓘ Cost ranges are severity-bucket heuristics (US national rule-of-thumb). Get contractor quotes + a written scope before underwriting a rehab budget.
Schools (NCES district)
- District
- Judson ISD
- NCES district ID
- 4824990
- Math proficiency
- 21% ▼ -21.00%
- Reading proficiency
- 33% ▼ -7.00%
- Median HH income
- $57,542
- Composite
- 24.39/100
- National rank
- #7689
- State rank
- #660 of 826 in TX
Livability — Converse
- Score
- 66/100
- State rank
- #649
- US rank
- #12250
Category grades
Schools grade is shown separately in the Schools card above.
Census & demographics
- Census place
- Converse, TX
- County
- Bexar County · 1,990,555 people
- City population
- 63,067
- Metro
- San Antonio-New Braunfels, TX
- Population (ZIP)
- 63,067
- Household income
- $91,320
- Rent vs Own
- Severe rent burden
- 1732.0
Population outlook (Bexar County) Hauer SSP2
- Today (2025)
- 2,336,851 people
- By 2030
- 2,560,728 · +9.6%
- By 2040
- 3,020,569 · +29.3%
- By 2050
- 3,493,522 · +49.5%
- By 2075
- 4,668,459 · +99.8%
- By 2100
- 5,533,242 · +136.8%
Race, ethnicity, and origin ACS 2023
- Neighborhood character
- Diverse neighborhood (Simpson 0.69)
- Race & ethnicity
- Hispanic / Latino 44% White 27% Two or more races 21% Black 21% Asian 3%
- Hispanic origin (detail)
- Mexican 29% Puerto Rican 4%
- Common ancestry
- Lithuanian 1% Romanian 1% Italian 1%
- Foreign-born
- 11% · Canada, Vietnam, South Korea
- Languages at home
- 71% English-only · Spanish 23% Tagalog/Filipino 1% Other Asian/Pacific 1%
Political lean MEDSL · Bexar
- 2024 margin
- Lean D (+9.8) · D 54.3% · R 44.6% · Other 1.1%
- 2008→2024 swing
- +4.2pp toward D · 2008: 5.6pp · 2024: 9.8pp
- All cycles
- 2024: D+9.8 2020: D+18.2 2016: D+13.5 2012: D+4.6 2008: D+5.6
Not yet ingested
- Civics
- —
Market trends
- HPI YoY
- ▼ -51.02%
- Current HPI
- 236.4923
- Rent YoY
- ▼ -1.08%
- Metro
- San Antonio-New Braunfels, TX
- State GDP YoY
- ▲ 3.95%
- F500 in state
- 110
Industry mix (Fortune 500 HQ in TX)
| Industry | F500 HQs | Revenue |
|---|---|---|
| Energy | 16 | $1,198B |
|
||
| Technology | 5 | $198B |
|
||
| Engineering / Construction | 4 | $72B |
|
||
| Energy Services | 3 | $60B |
|
||
| Utilities | 3 | $41B |
|
||
| Healthcare | 2 | $330B |
|
||
Price history
-7.8% since first listed8 events — show timeline
- 2026-04-27 Pending — LERA
- 2026-04-25 Price Changed $224,999 LERA
- 2026-04-22 Price Changed $233,999 LERA
- 2026-04-21 Price Changed $253,999 LERA
- 2026-04-20 Relisted — LERA
- 2026-03-07 Pending — LERA
- 2026-02-28 Price Changed $239,999 LERA
- 2026-02-26 Listed $243,999 LERA
Cash-flow waterfall
monthlySold comps — $/sqft
last 12 mo · ≤1 miLoading sold comps…