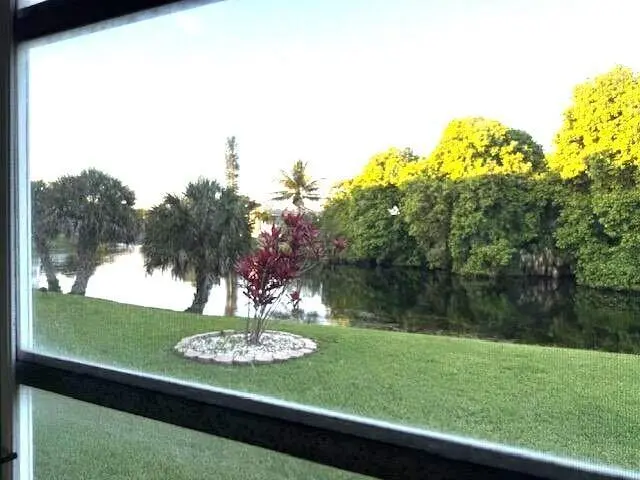
 🌊 Lakefront
1019 Newport G · Deerfield Beach, FL
Flood risk No data
- FEMA flood zone
- —
- Chance of flooding over 30 yrs
- —
- Est. flood insurance / yr
- —
Fire risk No data
- Est. fire insurance / yr
- —
Heat risk No data
- Hot days now (above threshold)
- —
- Hot days in 30 yrs
- —
Wind risk No data
- Chance of severe wind over 30 yrs
- —
Air-quality risk No data
- Unhealthy air days now
- —
- Unhealthy air days in 30 yrs
- —
Risk factors via First Street. Map © Google.
Why this score? — see what drove the B grade
The composite is a weighted blend of 9 inputs, each scored 0–100. Each bar is that input's sub-score; the figure is the points it added to the 100-point composite (weight × sub-score).
- Cash flow +30.0/30.0
- 1% rule +10.0/10.0
- DSCR +10.0/10.0
- ARV discount +7.5/15.0
- Schools +4.1/10.0
- Livability +3.8/5.0
- Rent growth +2.5/5.0
- Condition / age +2.5/5.0
- Appreciation +0.0/10.0
$79,000
🖨 Deal sheet (PDF) 📄 Offer letter ✓ Due diligence
Listing remarks
Beautiful tranquil setting on a winding lake overlooking the Century Village Nature Preserve. Very active 55+ community. Loads of athletic and social activities, including a fitness center and theater. First floor location with parking close to the front door. Freshly painted. All residents must be 55+. No rentals allowed.
Key facts
- Theater
- Fitness center
- Tranquil setting
Tags
Property features AI
Finance
- Other: Senior community; Pets not allowed
- HOA & community: Association amenities include clubhouse, elevators, fitness center, laundry, pool, spa/hot tub, tennis courts, community room, courtesy bus, pickleball courts, putting green, gated access, security, and recreation facilities; HOA fee payable monthly; Association fee covers grounds maintenance, security, elevator, and recreation facilities; Association management: CVE Master Management
Exterior
- Parking: Assigned parking; Common parking; Guest parking; Asphalt parking surface; Total of 1 parking space
- Security: Gated community with guard
- Utilities: Public water; Public sewer; Cable available; Electricity connected; Water connected
- Home design: Condominium; One level; Entry on level 1; Faces west
- Construction: Built with CBS construction; Other roof type; Building has 4 stories
- Exterior features: Covered patio; Patio; Glass-enclosed patio; Waterfront location; Asphalt road frontage; West of US-1
Interior
- Kitchen: Dishwasher; Electric range; Refrigerator
- Bedrooms: 2 bedrooms on the main level
- Flooring: Carpet; Tile
- Bathrooms: 1 full bathroom; 1 half bathroom
- Heating & cooling: Central heating; Central air; Ceiling fans
- Interior features: Walk-in closets; Stacked bedroom layout
- Laundry & utility: Laundry in common area
Neighborhood map
What this means for you Summary
Snapshot
- This is a 2-bed/2.0-bath condo listed at $79k.
Deal economics
- At list price, monthly cash flow is $311 ($4k/yr) — positive.
- The deal already cash-flows at list — no discount required.
- Meets the 1% rule at list price ($2k rent vs $79k).
- Recommended offer: $77k (3.0% below list) — sets the bar for market timing.
- Cap rate 11.0% vs local median 4.2% in Deerfield Beach — top-decile yield for the area; either an underpriced asset or a hidden risk that comps aren't pricing in. Stress-test before assuming the spread holds.
Location & tenants
- Location reads 75/100 on livability (#250 in FL, #3,970 nationally) — a middle-class / working-renter tenant base. Strengths: housing A+, health & safety A+, cost of living A; Watch: amenities D-, employment D-.
- Broward (suburban): math 42% / reading 53% proficiency, ranked #46 of 73 in FL (top 63%) — families likely to look elsewhere, expect single-tenant / working-renter base with shorter leases.
- Zoned schools: Quiet Waters Elementary School (math 40% / reading 48%, grade F, #1,330 of 2,144 statewide, top 63%, 1,128 students, 62% FRL); Lyons Creek Middle School (math 49% / reading 53%, grade C, #237 of 571 statewide, top 43%, 1,757 students, 60% FRL); Deerfield Beach High School (math 12% / reading 37%, grade F, #505 of 667 statewide, top 79%, 2,251 students, 69% FRL).
- Market conditions: Rents flat; 586 active listings in the ZIP; 40 comparable units currently listed for rent nearby; rentals at typical pace (median 25d on market — plan ~3-4 weeks tenant-placement turnaround); 2,111 units permitted in Broward County in 2024 (1,265 in 5+ unit buildings).
- This rent runs 42% of the median local income ($53k/yr) — at the standard rent-burdened threshold; future hikes will face affordability resistance.
Forward outlook
- Local home prices are declining (-3.0%/yr); year-one equity from $546 of loan paydown is wiped out by about $2k of value loss. Plan a longer hold.
- Broward County population projected at +34% by 2050 — long-run rental-demand tailwind backs the buy-and-hold thesis.
Negotiation context
- It's been on market 37 days — a 3% lower offer ($77k) is reasonable based on typical stale-listing flexibility.
- Current owner paid $45k; list at $79k implies a 76% gain — meaningful room to come down on a strong offer.
Risks & watch-outs
- Watch-outs: HOA is 36% of rent.
Questions for the listing agent
- It's been on market 37 days. Have you received any prior offers? Is the seller open to a 3% concession, seller financing, or rate buy-down credit?
- Built in 1978 — when were the roof, HVAC, electrical panel, plumbing, and water heater last replaced?
- What does the HOA fee cover, when was the last increase, and are there any pending special assessments or reserve-fund shortfalls?
- Any open or pending special assessments — roof, HVAC, plumbing, elevator, façade? What's the per-unit balance and payoff schedule, and is the seller paying it off at close or rolling it to the buyer?
- Is there a deadline driving the sale (1031 exchange, divorce, estate, relocation)? That informs how much negotiation room exists.
- Schools are D-rated, which usually means shorter tenancies and higher turnover. Who's the typical renter profile here, and what's been the actual vacancy rate?
- This sits on a lake — are riparian / water-frontage rights deeded with the parcel? Any dock permits, shoreline easements, or HOA water-use restrictions?
- What's the documented flood / surge / shoreline-erosion history here (FEMA AND non-FEMA — e.g., storm surge, creek backup, septic-field saturation)?
- Any water-quality or seasonal algae-bloom issues that affect tenant satisfaction or short-term-rental demand?
- What's the average days-on-market for RENTAL listings here right now (not sales)? A rising rental-DOM trend means longer vacancies and softer asking-rent achievability than the comps imply.
- What's the recent tenant-quality profile in this submarket — average credit score on applications, eviction rate, late-payment / NSF rate, and stable-employment percentage? A property-management company in the area should have these aggregated.
- How much new apartment / multifamily construction is in the pipeline within 1–3 miles? Heavy new supply (>2% of stock underway) typically softens rents 12–24 months out; light construction supports rent growth.
Investment metrics
- 1% rule
- 2.35% ✓
- Cap rate
- 11.02%
- Cash-on-cash
- 16.88%
- DSCR
- 1.75
- GRM
- 3.5
CMA / ARV
No comps found within radius.
Projected returns pro-forma
-3.0% appreciation · 0.1% rent growth · sell at horizon
- IRR
- 2.7%
- Equity multiple
- 1.10×
- Total profit
- $2,152
- Equity at exit
- $11,779
- IRR
- 6.7%
- Equity multiple
- 1.39×
- Total profit
- $8,636
- Equity at exit
- $6,830
Cash invested: $22,120 (down + closing). Projections, not guarantees.
Landlord ↔ Tenant lean methodology
- Overall (STATE)
- 87 Strongly Landlord-Friendly
- State Florida
- 87 Strongly Landlord-Friendly · R+3
- County
- — inherits STATE
- City
- — inherits STATE
ZIP-level market 33442
- Rents YoY
- 0.1%
- Active inventory
- 586
- Price-to-rent
- 3.5×
Monthly cashflow live
- Estimated rent
- $1,857 high interval (Pro) →
- Mortgage (P&I)
- −$414
- Tax from tax record
- −$36 /mo · $429/yr
- Insurance
- −$33
- HOA
- −$673
- Vacancy / Maint / Mgmt
- −$390
- Net cashflow
- $311
Break-even live
Sensitivity live
| Price | -10% $356 | -5% $334 | +0% $311 | +5% $289 | +10% $266 |
|---|---|---|---|---|---|
| Rent | -10% $164 | -5% $238 | +0% $311 | +5% $384 | +10% $458 |
| Rate | -1.0pp $351 | -0.5pp $331 | base $311 | +0.5pp $291 | +1.0pp $270 |
UW: 25.0% down · 7.5% · 30yr · 1.5% tax · 5.0% vac · 8.0% maint · 8.0% mgmt
Financing live
Cash to close
- Down payment
- $19,750
- Closing costs
- $2,370
- Reserves months
- —
- Total cash needed
- —
Loan-product check · same deal, 3 products live
Conventional
25% down · 7.5% · 30yr
- Down + closing
- —
- Monthly P&I
- —
- Monthly cashflow
- —
- DSCR
- —
- Eligible?
- —
Personal DTI + credit; lowest rate.
DSCR
20% down · 8.5% · 30yr
- Down + closing
- —
- Monthly P&I
- —
- Monthly cashflow
- —
- DSCR
- —
- Eligible?
- —
No personal income docs; deal must DSCR.
Hard money
10% down · 12.0% · 12mo
- Down + closing
- —
- Monthly P&I
- —
- Monthly cashflow
- —
- DSCR
- —
- Eligible?
- —
Short-term bridge; refi at stabilization.
Rent comps 40 comps
| Address | Beds | Baths | Sqft | Rent | $/sqft | DOM | Units | Dist |
|---|---|---|---|---|---|---|---|---|
| 25 Newport Ct Unit 25 Deerfield Beach, FL | 1.0 | 1.0 | 700 | $1,549 | $2.21 | 25d | 1 | 0.07mi |
| 27 Newport B Deerfield Beach, FL | 1.0 | 1.5 | 700 | $1,550 | $2.21 | 22d | 1 | 0.07mi |
| 188 Prescott E Unit 188 Deerfield Beach, FL | 1.0 | 1.5 | 700 | $1,800 | $2.57 | 25d | 1 | 0.10mi |
| 125 Newport I Unit I Deerfield Beach, FL | 1.0 | 1.5 | 700 | $1,600 | $2.29 | 25d | 1 | 0.11mi |
| 20 Prescott E Unit 20 Deerfield Beach, FL | 1.0 | 1.5 | 700 | $1,600 | $2.29 | 25d | 1 | 0.11mi |
| 193 Newport Ct #193 Deerfield Beach, FL | 2.0 | 1.5 | 820 | $2,200 | $2.68 | 25d | 1 | 0.15mi |
| 181 Newport Ct #181 Deerfield Beach, FL | 1.0 | 1.5 | 700 | $1,650 | $2.36 | 25d | 1 | 0.16mi |
| 170 Newport K Deerfield Beach, FL | 1.0 | 1.0 | 585 | $1,430 | $2.44 | 25d | 1 | 0.16mi |
| 184 Tilford I Unit I Deerfield Beach, FL | 2.0 | 1.5 | 820 | $2,000 | $2.44 | 25d | 1 | 0.17mi |
| 181 Tilford I Unit I Deerfield Beach, FL | 1.0 | 1.5 | 700 | $1,350 | $1.93 | 25d | 1 | 0.17mi |
| 226 Newport O Deerfield Beach, FL | 1.0 | 1.5 | 700 | $1,700 | $2.43 | 25d | 1 | 0.20mi |
| 226 Newport O Deerfield Beach, FL | 1.0 | 1.5 | 700 | $1,600 | $2.29 | 4d | 1 | 0.20mi |
| 358 Markham Cres Unit 358 Deerfield Beach, FL | 1.0 | 1.5 | 700 | $1,500 | $2.14 | 25d | 1 | 0.21mi |
| 111 Tilford F #111 Deerfield Beach, FL | 1.0 | 1.0 | 585 | $1,500 | $2.56 | 21d | 1 | 0.22mi |
| 111 Tilford F #111 Deerfield Beach, FL | 1.0 | 1.0 | 585 | $1,500 | $2.56 | 6d | 1 | 0.22mi |
| 111 Oakridge I #111 Deerfield Beach, FL | 1.0 | 1.5 | 706 | $1,595 | $2.26 | 25d | 1 | 0.22mi |
| 124 Oakridge I #124 Deerfield Beach, FL | 2.0 | 1.5 | 820 | $1,700 | $2.07 | 5d | 1 | 0.23mi |
| 316 Markham Cres Deerfield Beach, FL | 2.0 | 1.5 | 820 | $1,800 | $2.20 | 25d | 1 | 0.25mi |
| 295 Newport Dr Unit 295 Deerfield Beach, FL | 1.0 | 1.0 | 595 | $1,450 | $2.44 | 25d | 1 | 0.26mi |
| 272 Tilford M Unit M Deerfield Beach, FL | 2.0 | 1.5 | 820 | $1,900 | $2.32 | 25d | 1 | 0.26mi |
| 436 Markham S #436 Deerfield Beach, FL | 1.0 | 1.0 | 585 | $1,400 | $2.39 | 25d | 1 | 0.29mi |
| 308 Markham N Deerfield Beach, FL | 1.0 | 1.5 | 700 | $1,200 | $1.71 | 25d | 1 | 0.29mi |
| 306 Newport T #306 Deerfield Beach, FL | 1.0 | 1.0 | 585 | $1,350 | $2.31 | 25d | 1 | 0.32mi |
| 260 Prescott N Unit 260 Deerfield Beach, FL | 1.0 | 1.5 | 700 | $1,500 | $2.14 | 25d | 1 | 0.33mi |
| 361 Tilford Q Unit Q Deerfield Beach, FL | 2.0 | 1.5 | 820 | $1,800 | $2.20 | 25d | 1 | 0.37mi |
| 3042 Harwood E Unit 3042 Deerfield Beach, FL | 2.0 | 2.0 | 860 | $3,000 | $3.49 | 25d | 1 | 0.53mi |
| 6 Ventnor a Deerfield Beach, FL | 1.0 | 1.0 | 600 | $1,429 | $2.38 | 25d | 1 | 0.66mi |
| 51 Tilford S Unit 51 Deerfield Beach, FL | 2.0 | 1.5 | 820 | $1,800 | $2.20 | 25d | 1 | 0.71mi |
| 105 Deer Creek Rd Deerfield Beach, FL | 2.0 | 2.0 | 1120 | $2,700 | $2.41 | 25d | 1 | 0.76mi |
| 105 Deer Creek Rd #202 Deerfield Beach, FL | 2.0 | 2.0 | 1120 | $3,000 | $2.68 | 25d | 1 | 0.77mi |
| 384 Durham Cir Unit 384 Deerfield Beach, FL | 1.0 | 1.0 | 593 | $1,400 | $2.36 | 25d | 1 | 0.81mi |
| 178 Durham E Unit 178 Deerfield Beach, FL | 1.0 | 1.0 | 593 | $1,350 | $2.28 | 4d | 1 | 0.82mi |
| 178 Durham E Unit 178 Deerfield Beach, FL | 1.0 | 1.0 | 593 | $1,350 | $2.28 | 11d | 1 | 0.82mi |
| 283 Durham Cir Unit 283 Deerfield Beach, FL | 2.0 | 2.0 | 820 | $3,300 | $4.02 | 25d | 1 | 0.82mi |
| 137 Farnham F #137 Deerfield Beach, FL | 1.0 | 1.5 | 700 | $2,500 | $3.57 | 25d | 1 | 0.88mi |
| 144 Farnham F Unit F Deerfield Beach, FL | 2.0 | 1.5 | 828 | $2,500 | $3.02 | 25d | 1 | 0.88mi |
| 137 Farnham F Deerfield Beach, FL | 1.0 | 1.5 | 708 | $2,000 | $2.82 | 25d | 1 | 0.88mi |
| 1272 S Military Trl #313 Deerfield Beach, FL | 2.0 | 2.0 | 900 | $2,390 | $2.66 | 22d | 1 | 0.89mi |
| 2355 SW 15th St Deerfield Beach, FL | 2.0 | 2.0 | 1100 | $2,098 | $1.91 | 25d | 2 | 0.89mi |
| 3016 Cambridge A Unit A Deerfield Beach, FL | 1.0 | 1.5 | 700 | $1,350 | $1.93 | 25d | 1 | 0.92mi |
HOA detail condo
- Monthly dues
- $673 · $8,076/yr
- Likely covers
- gym
- Assessments
- None detected in remarks — confirm with the listing agent.
Listing history 15 events
-
2026-06-18days on market $79,000 Active 37 DOM
-
2026-06-17days on market $79,000 Active 36 DOM
-
2026-06-16days on market $79,000 Active 35 DOM
-
2026-06-15days on market $79,000 Active 34 DOM
-
2026-06-13days on market $79,000 Active 32 DOM
-
2026-06-09days on market $79,000 Active 28 DOM
-
2026-06-08days on market $79,000 Active 27 DOM
-
2026-06-07pricedays on market $79,000 Active 26 DOM
-
2026-06-04days on market $89,900 Active 23 DOM
-
2026-06-03days on market $89,900 Active 22 DOM
-
2026-06-02days on market $89,900 Active 21 DOM
-
2026-06-01days on market $89,900 Active 20 DOM
-
2026-05-31days on market $89,900 Active 19 DOM
-
2026-05-12$89,900 Active
-
1989-03-01soldstatus $45,000
ⓘ Source: listings_history table (triggers on properties + properties_extension) + one-shot
backfill from property_details.listing_events for pre-trigger history.
Tax reassessment forecast FL · Resets to sale price
- Current annual tax
- $429 · $36/mo
- Projected year-2 tax
- $656 · $55/mo
- Expected delta
- +$227/yr (+$19/mo · 52.8%)
ⓘ Screening estimate from a state-policy table — verify with the county assessor before closing.
Nearby sold comps map
Loading sold comps map…
Walkable amenities ~0.75 mi
Loading nearby amenities…
Taxation est. · year 1
- Rental income
- $22,285
- − Mortgage interest
- −$4,425
- − Property taxes
- −$429
- − Insurance
- −$395
- − Repairs & maintenance
- −$1,783
- − Management
- −$1,783
- − HOA
- −$8,076
- − Depreciation
- −$2,298
- Taxable income
- $3,096
- Est. tax owed @ 24.0%
- −$743
- After-tax cash flow
- $2,991/yr
For passive investors: Depreciation is non-cash, so a rental often shows a tax loss while cash-flowing — sheltering income. Rental losses are passive: they offset passive income freely, and up to $25,000/yr can offset ordinary (W-2) income if you actively participate and your MAGI is under $100k (phasing out to $0 by $150k); unused losses carry forward. On sale, claimed depreciation is recaptured at up to 25%, and gains may owe capital-gains tax (a 1031 exchange can defer both). Figures are a year-1 estimate at your 24.0% rate — not tax advice; consult a CPA.
Schools (NCES district)
- District
- Broward
- NCES district ID
- 1200180
- Math proficiency
- 42% ▼ -18.00%
- Reading proficiency
- 53% ▼ -5.00%
- Median HH income
- $52,139
- Composite
- 40.88/100
- National rank
- #3621
- State rank
- #46 of 73 in FL
Livability — Deerfield Beach
- Score
- 75/100
- State rank
- #250
- US rank
- #3970
Category grades
Schools grade is shown separately in the Schools card above.
Census & demographics
- Census place
- Deerfield Beach, FL
- County
- Broward County · 1,963,430 people
- City population
- 61,449
- Metro
- Miami-Fort Lauderdale-Pompano Beach, FL
- Population (ZIP)
- 31,296
- Household income
- $53,254
- Rent vs Own
- Severe rent burden
- 2169.0
Population outlook (Broward County) Hauer SSP2
- Today (2025)
- 2,207,033 people
- By 2030
- 2,360,704 · +7.0%
- By 2040
- 2,661,208 · +20.6%
- By 2050
- 2,946,698 · +33.5%
- By 2075
- 3,602,273 · +63.2%
- By 2100
- 3,970,984 · +79.9%
Race, ethnicity, and origin ACS 2023
- Neighborhood character
- Diverse neighborhood (Simpson 0.61)
- Race & ethnicity
- White 57% Hispanic / Latino 23% Two or more races 19% Black 10% Asian 2%
- Hispanic origin (detail)
- Mexican 1% Puerto Rican 4% Cuban 3%
- Common ancestry
- Estonian 7% Romanian 4% Hispanic 3%
- Foreign-born
- 34% · Canada, Jamaica, Dominican Republic
- Languages at home
- 59% English-only · Spanish 20% Other Indo-European 13% French/Haitian/Cajun 4%
Political lean MEDSL · Broward
- 2024 margin
- D (+17.0) · D 58.0% · R 41.0%
- 2008→2024 swing
- -17.8pp toward R · 2008: 34.7pp · 2024: 17.0pp
- All cycles
- 2024: D+17.0 2020: D+29.8 2016: D+35.0 2012: D+34.9 2008: D+34.7
Not yet ingested
- Civics
- —
Market trends
- HPI YoY
- ▼ -280.44%
- Current HPI
- 323.0166
- Rent YoY
- ▲ 0.10%
- Metro
- Miami-Fort Lauderdale-Pompano Beach, FL
- State GDP YoY
- ▲ 3.28%
- F500 in state
- 36
Industry mix (Fortune 500 HQ in FL)
| Industry | F500 HQs | Revenue |
|---|---|---|
| Industrial Technology | 2 | $29B |
|
||
| Insurance | 2 | $17B |
|
||
| Retail | 1 | $60B |
|
||
| Technology Distribution | 1 | $58B |
|
||
| Homebuilding | 1 | $35B |
|
||
| Technology Manufacturing | 1 | $35B |
|
||
Price history
+99.8% since first listed2 events — show timeline
- 2026-05-12 Listed $89,900 Beaches MLS
- 1989-03-01 Sold (Public Records) $45,000 Public Records
Property tax history
+8.6%/yrLatest (2025): $429 · +12.1% YoY. Source: county tax records.
Cash-flow waterfall
monthlySold comps — $/sqft
last 12 mo · ≤1 miLoading sold comps…