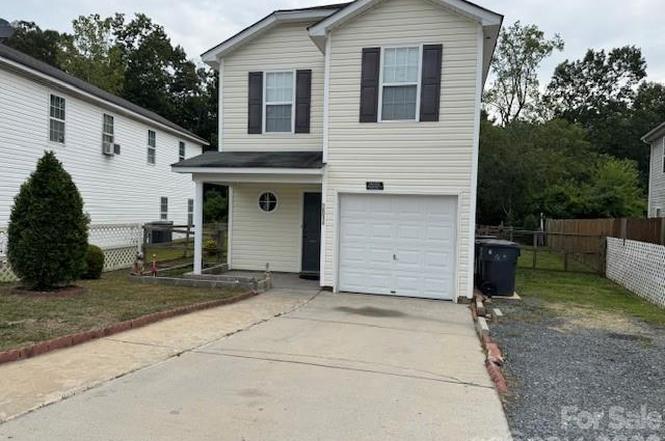
3514 Crestridge Dr · Charlotte, NC
Flood risk 1/10 · Minimal
- FEMA flood zone
- X (unshaded)
- Chance of flooding over 30 yrs
- 0.0%
- Est. flood insurance / yr
- $507 – $1,088
Fire risk 1/10 · Minimal
- Est. fire insurance / yr
- $906 – $1,684
Heat risk 6/10 · Moderate
- Hot days now (above 103°F)
- 7 days/yr
- Hot days in 30 yrs
- 17 days/yr
Wind risk 6/10 · Moderate
- Chance of severe wind over 30 yrs
- 27.0%
Air-quality risk 3/10 · Minor
- Unhealthy air days now
- 3 days/yr
- Unhealthy air days in 30 yrs
- 4 days/yr
Risk factors via First Street. Map © Google.
Why this score? — see what drove the D+ grade
The composite is a weighted blend of 9 inputs, each scored 0–100. Each bar is that input's sub-score; the figure is the points it added to the 100-point composite (weight × sub-score).
- ARV discount +15.0/15.0
- Cash flow +13.5/30.0
- DSCR +4.1/10.0
- Livability +3.9/5.0
- Schools +3.8/10.0
- 1% rule +3.1/10.0
- Rent growth +2.5/5.0
- Condition / age +2.5/5.0
- Appreciation +0.0/10.0
$300,000
🖨 Deal sheet (PDF) 📄 Offer letter ✓ Due diligence
Listing remarks
This beautifully maintained home offers 4 bedrooms and 2.5 bathrooms, providing ample space for comfortable family living. The open floor plan features a bright living area, a spacious Kitchen with modern appliances, and generous storage throughout. The primary suite includes a walk-in closet and private bath. Enjoy outdoor living in your large fenced backyard, perfect for gathering or relaxation. Additional features include central air and heat, modern flooring, an attached garage. Conveniently located near dining, shopping, parks, easy access to major highways.
Key facts
- Open floor plan
- Modern flooring
- Walk-in closet
Tags
Property features AI
Finance
- Other: Property zoned OFC
- HOA & community: No HOA
Exterior
- Parking: Detached garage facing front; 1-car garage; Driveway
- Utilities: City water; Public sewer
- Home design: Single-family residence; Site-built construction; Two levels; Slab foundation
- Construction: Vinyl exterior
- Exterior features: Storage; Concrete and gravel road access; Publicly maintained road
Interior
- Kitchen: Dishwasher; Electric cooktop
- Bedrooms: 4 bedrooms on the upper level
- Bathrooms: 2 full bathrooms; 1 half bathroom
- Heating & cooling: Heat pump heating; Central air conditioning
- Interior features: 11 total rooms; Walk-in closet(s)
- Laundry & utility: Laundry closet on the upper level
Neighborhood map
What this means for you Summary
Snapshot
- This is a 3-bed/2.0-bath single-family listed at $300k.
Deal economics
- At list price, monthly cash flow is $11 ($138/yr) — positive.
- The deal already cash-flows at list — no discount required.
- To meet the 1% rule (rent ≥ 1% of price), the offer needs to be $242k (19.3% below list).
- Recommended offer: $242k (19.3% below list) — sets the bar for 1% rule.
- Cap rate 6.3% vs local median 3.1% in Charlotte — top-decile yield for the area; either an underpriced asset or a hidden risk that comps aren't pricing in. Stress-test before assuming the spread holds.
Location & tenants
- Location reads 78/100 on livability (#26 in NC, #2,502 nationally) — a middle-class / working-renter tenant base. Strengths: amenities A+, commute A+, housing A+; Watch: crime F.
- Charlotte-Mecklenburg Schools (urban): math 42% / reading 46% proficiency, ranked #85 of 178 in NC (top 48%) — families likely to look elsewhere, expect single-tenant / working-renter base with shorter leases.
- Zoned schools: Reid Park Academy (math 17% / reading 27%, grade F, #1,190 of 1,410 statewide, top 86%, 305 students, 99% FRL); Wilson Stem Academy (math 11% / reading 22%, grade F, #449 of 475 statewide, top 96%, 367 students, 99% FRL); Harding University High School (math 27% / reading 33%, grade F, #457 of 535 statewide, top 85%, 1,305 students, 98% FRL) — zoned schools average 99% FRL vs 49% district-wide (50 pts higher); higher-poverty schools than district average — tighter screening recommended.
- Zoned-school proficiency averages 23% at this address vs 44% district-wide (-21 pts) — the specific schools serving this property underperform the Charlotte-Mecklenburg Schools average; the district grade overstates school quality for this exact location.
- Market conditions: Rents flat; 171 active listings in the ZIP; 40 comparable units currently listed for rent nearby; rentals leasing fast (median 6d on market — plan ~1-2 weeks tenant-placement turnaround); 11,969 units permitted in Mecklenburg County in 2024 (5,377 in 5+ unit buildings).
- At $2,421/mo this rent would consume 45% of the median local household income ($64k/yr) (locally 2144% of renters already pay >50% of income on rent) — very limited rent-growth headroom before tenants either downsize or default.
Forward outlook
- Local home prices are declining (-3.0%/yr); year-one equity from $2k of loan paydown is wiped out by about $9k of value loss. Plan a longer hold.
- Mecklenburg County population projected at +53% by 2050 — long-run rental-demand tailwind backs the buy-and-hold thesis.
Negotiation context
- It's been on market 76 days — a 6% lower offer ($282k) is reasonable based on typical stale-listing flexibility.
- 2 sale attempts; this cycle's ask has dropped $24k (7%) from the opening price — seller is motivated, your offer sets the floor, not the list.
- Current owner paid $234k; 28% above their basis — modest negotiation headroom, anchor on the comps not their cost.
Risks & watch-outs
- Climate carrying-cost: major wind risk, 27% chance of damaging wind over 30y; extreme-heat days projected 7→17/yr by 2055 (HVAC capex compounding) — expect insurance premiums to compound above CPI over the hold.
Questions for the listing agent
- It's been on market 76 days. Have you received any prior offers? Is the seller open to a 19% concession, seller financing, or rate buy-down credit?
- Why hasn't it sold? Are there any deal-killer items the seller is aware of (foundation, flood, title, zoning, code violations)?
- Is there a deadline driving the sale (1031 exchange, divorce, estate, relocation)? That informs how much negotiation room exists.
- Schools are D-rated, which usually means shorter tenancies and higher turnover. Who's the typical renter profile here, and what's been the actual vacancy rate?
- Crime grade is F in this area — have there been break-ins, vandalism, or insurance claims at this property in the last 3 years? What carrier currently insures it and at what premium?
- The area grade is low — what's the realistic commute time and amenity access for the typical tenant pool here? Any planned neighborhood developments (good or bad) we should know about?
- What's the average days-on-market for RENTAL listings here right now (not sales)? A rising rental-DOM trend means longer vacancies and softer asking-rent achievability than the comps imply.
- What's the recent tenant-quality profile in this submarket — average credit score on applications, eviction rate, late-payment / NSF rate, and stable-employment percentage? A property-management company in the area should have these aggregated.
- How much new for-sale + rental construction is in the pipeline within 1–3 miles? Heavy new supply typically softens prices + rents 12–24 months out; constrained supply supports both.
Investment metrics
- 1% rule
- 0.81% ✗
- Cap rate
- 6.34%
- Cash-on-cash
- 0.16%
- DSCR
- 1.01
- GRM
- 10.3
CMA / ARV
- ARV (on-the-fly)
- $388,512
- Comps found
- 11
Show comp detail 11 sales within ~0.75 mi
| Address | Dist | Beds/Ba | Sqft | Sold | Price | $/sf | Match |
|---|---|---|---|---|---|---|---|
| 3733 Sargeant Dr | 0.28mi | 3/2.0 | 1,464 (-14%) | 1mo | $449,000 | $307 | 63 |
| 1234 Clanton Rd #15 | 0.36mi | 3/2.0 | 1,507 (-12%) | 2mo | $348,000 | $231 | 63 |
| 4027 Broadview Dr | 0.23mi | 4/2.5 (+1) | 1,515 (-11%) | 2mo | $476,000 | $314 | 62 |
| 3205 Morning Dr | 0.57mi | 3/2.5 | 1,739 (+2%) | 10mo | $310,000 | $178 | 59 |
| 4235 Spring Oak Dr | 0.46mi | 3/2.0 | 1,599 (-6%) | 11mo | $345,000 | $216 | 59 |
| 3545 Sargeant Dr | 0.38mi | 4/2.0 (+1) | 1,498 (-12%) | 1mo | $400,000 | $267 | 56 |
| 3317 Sargeant Dr | 0.61mi | 4/2.0 (+1) | 1,570 (-8%) | 4mo | $465,000 | $296 | 50 |
| 3204 Amay James Ave | 0.61mi | 4/2.0 (+1) | 1,458 (-14%) | 1mo | $332,500 | $228 | 42 |
| 3049 Reid Ave | 0.71mi | 4/2.5 (+1) | 1,864 (+9%) | 7mo | $413,500 | $222 | 38 |
| 3107 Amay James Ave | 0.73mi | 4/3.0 (+1) | 1,939 (+14%) | 6mo | $390,000 | $201 | 29 |
| 3105 Amay James Ave | 0.74mi | 4/3.0 (+1) | 1,939 (+14%) | 9mo | $400,000 | $206 | 26 |
Match score weights: distance 35% · size 25% · config 20% · recency 20%. Top-matched comps best support the ARV.
Projected returns pro-forma
-3.0% appreciation · 0.04% rent growth · sell at horizon
- IRR
- -19.2%
- Equity multiple
- 0.35×
- Total profit
- $-54,955
- Equity at exit
- $44,731
- IRR
- -18.7%
- Equity multiple
- 0.12×
- Total profit
- $-74,282
- Equity at exit
- $25,939
Cash invested: $84,000 (down + closing). Projections, not guarantees.
Landlord ↔ Tenant lean methodology
- Overall (STATE)
- 85 Strongly Landlord-Friendly
- State North Carolina
- 85 Strongly Landlord-Friendly · R+3
- County
- — inherits STATE
- City
- — inherits STATE
ZIP-level market 28217
- Home prices YoY
- -14.8%
- Rents YoY
- 0.0%
- Active inventory
- 171
- Price-to-rent
- 10.3×
Monthly cashflow live
- Estimated rent
- $2,421 high interval (Pro) →
- Mortgage (P&I)
- −$1,573
- Tax from tax record
- −$203 /mo · $2,438/yr
- Insurance
- −$125
- HOA
- −$0
- Vacancy / Maint / Mgmt
- −$508
- Net cashflow
- $11
Break-even live
Sensitivity live
| Price | -10% $181 | -5% $96 | +0% $11 | +5% $-73 | +10% $-158 |
|---|---|---|---|---|---|
| Rent | -10% $-180 | -5% $-84 | +0% $11 | +5% $107 | +10% $203 |
| Rate | -1.0pp $163 | -0.5pp $88 | base $11 | +0.5pp $-66 | +1.0pp $-145 |
UW: 25.0% down · 7.5% · 30yr · 1.5% tax · 5.0% vac · 8.0% maint · 8.0% mgmt
Financing live
Cash to close
- Down payment
- $75,000
- Closing costs
- $9,000
- Reserves months
- —
- Total cash needed
- —
Loan-product check · same deal, 3 products live
Conventional
25% down · 7.5% · 30yr
- Down + closing
- —
- Monthly P&I
- —
- Monthly cashflow
- —
- DSCR
- —
- Eligible?
- —
Personal DTI + credit; lowest rate.
DSCR
20% down · 8.5% · 30yr
- Down + closing
- —
- Monthly P&I
- —
- Monthly cashflow
- —
- DSCR
- —
- Eligible?
- —
No personal income docs; deal must DSCR.
Hard money
10% down · 12.0% · 12mo
- Down + closing
- —
- Monthly P&I
- —
- Monthly cashflow
- —
- DSCR
- —
- Eligible?
- —
Short-term bridge; refi at stabilization.
Rent comps 40 comps
| Address | Beds | Baths | Sqft | Rent | $/sqft | DOM | Units | Dist |
|---|---|---|---|---|---|---|---|---|
| 3924 Broadview Dr Charlotte, NC | 3.0 | 1.0 | 1253 | $1,795 | $1.43 | 16d | 1 | 0.17mi |
| 1139 Clanton Rd Charlotte, NC | 4.0 | 4.0 | 1099 | $2,299 | $2.09 | 25d | 1 | 0.27mi |
| 3338 Barfield Dr Charlotte, NC | 4.0 | 2.0 | 1431 | $2,295 | $1.60 | 9d | 1 | 0.45mi |
| 3103 Ross Ave Charlotte, NC | 3.0 | 2.0 | 1400 | $1,800 | $1.29 | 18d | 1 | 0.67mi |
| 2005 Empire St Charlotte, NC | 2.0 | 1.0–2.0 | 875 | $2,617 | $2.99 | 0d | 102 | 0.68mi |
| 511 Bowman Rd Charlotte, NC | 3.0 | 2.5 | 1986 | $3,600 | $1.81 | 5d | 1 | 0.69mi |
| 511 Bowman Rd Charlotte, NC | 3.0 | 2.5 | 1988 | $3,600 | $1.81 | 14d | 1 | 0.69mi |
| 5027 Duchess Dr Charlotte, NC | 4.0 | 4.5 | 2032 | $3,900 | $1.92 | 9d | 1 | 0.78mi |
| 5027 Duchess Dr #44 Charlotte, NC | 4.0 | 4.5 | 2032 | $3,900 | $1.92 | 9d | 1 | 0.78mi |
| 3047 Ridge Ave Charlotte, NC | 3.0 | 2.5 | 1704 | $2,229 | $1.31 | 9d | 1 | 0.78mi |
| 3022 Reid Ave Charlotte, NC | 3.0 | 2.0 | 2000 | $1,994 | $1.00 | 6d | 1 | 0.80mi |
| 3709 S Tryon St Charlotte, NC | 3.0 | 3.5 | 1705 | $3,000 | $1.76 | 25d | 1 | 0.82mi |
| 1005 S Mission Ln Unit C2 Charlotte, NC | 2.0 | 3.5 | 1584 | $2,336 | $1.47 | 7d | 1 | 0.82mi |
| 1005 S Mission Ln Unit C2 Charlotte, NC | 2.0 | 3.5 | 1584 | $2,232 | $1.41 | 6d | 1 | 0.82mi |
| 2967 Ross Ave Charlotte, NC | 3.0 | 3.0 | 1987 | $2,400 | $1.21 | 25d | 1 | 0.84mi |
| 2957 Ross Ave Charlotte, NC | 3.0 | 2.5 | 1987 | $2,400 | $1.21 | 25d | 1 | 0.84mi |
| 346 Freeland Ln Charlotte, NC | 3.0 | 3.5 | 1572 | $2,346 | $1.49 | 0d | 11 | 0.86mi |
| 2111 Freeland Park Dr Unit C1 Charlotte, NC | 3.0 | 3.5 | 1560 | $2,455 | $1.57 | 7d | 1 | 0.87mi |
| 4520 Charlotte Park Dr Charlotte, NC | 3.0 | 1.0–2.0 | 996 | $2,450 | $2.46 | 0d | 54 | 0.89mi |
| 4520 Charlotte Park Dr Charlotte, NC | 2.0 | 2.0 | 1153 | $1,980 | $1.72 | 25d | 1 | 0.89mi |
| 3310 S Tryon St Charlotte, NC | 1.0–3.0 | 1.0–2.0 | 1051 | $2,765 | $2.63 | 0d | 15 | 0.90mi |
| 2942 Reid Ave Charlotte, NC | 3.0 | 2.0 | 1142 | $2,000 | $1.75 | 19d | 1 | 0.91mi |
| 3615 Tryclan Dr Charlotte, NC | 2.0 | 1.0–2.0 | 993 | $3,493 | $3.52 | 0d | 33 | 0.92mi |
| 3405 S Tryon St Charlotte, NC | 1.0–3.0 | 1.0–2.0 | 1077 | $2,800 | $2.60 | 0d | 57 | 0.92mi |
| 4312 Yancey Rd Charlotte, NC | 2.0 | 1.0–2.0 | 835 | $2,624 | $3.14 | 0d | 45 | 0.95mi |
| 200 E Cama St Charlotte, NC | 2.0 | 1.0–2.0 | 880 | $2,141 | $2.43 | 0d | 23 | 1.08mi |
| 4904 Parkway Plaza Blvd Charlotte, NC | 3.0–4.0 | 2.5–3.5 | 1702 | $2,520 | $1.48 | 25d | 10 | 1.10mi |
| 4612 Gilead St Charlotte, NC | 2.0 | 1.0–2.5 | 900 | $2,683 | $2.98 | 0d | 44 | 1.11mi |
| 2104 Cascade Pointe Blvd Charlotte, NC | 3.0 | 1.0–2.5 | 1123 | $2,295 | $2.04 | 0d | 43 | 1.12mi |
| 3441 South Blvd Charlotte, NC | 2.0 | 1.0–2.0 | 868 | $2,470 | $2.84 | 0d | 10 | 1.12mi |
| 7030 Parkway Commons DR Charlotte, NC | 1.0–3.0 | 1.0–2.0 | 1055 | $2,371 | $2.25 | 0d | 73 | 1.14mi |
| 235 Verbena St Charlotte, NC | 2.0 | 1.0–2.0 | 832 | $1,834 | $2.20 | 0d | 18 | 1.15mi |
| 205 Foster Ave Charlotte, NC | 4.0 | 1.0–2.0 | 641 | $3,891 | $6.07 | 0d | 33 | 1.15mi |
| 3305 South Blvd Charlotte, NC | 2.0 | 1.0–2.5 | 945 | $3,665 | $3.88 | 0d | 20 | 1.16mi |
| 2309 Ellen Ave Unit 1 Charlotte, NC | 4.0 | 2.5 | 1700 | $2,299 | $1.35 | 19d | 1 | 1.17mi |
| 4015 South Blvd Charlotte, NC | 2.0 | 1.0–2.0 | 957 | $2,624 | $2.74 | 3d | 74 | 1.18mi |
| 120 Hollis Rd Charlotte, NC | 3.0 | 1.0–3.0 | 1155 | $3,683 | $3.19 | 0d | 31 | 1.24mi |
| 1103 Shuman View Ct Charlotte, NC | 3.0 | 3.5 | 1722 | $2,800 | $1.63 | 0d | 1 | 1.25mi |
| 462 New Bern Station Ct Charlotte, NC | 2.0 | 2.0 | 1088 | $1,950 | $1.79 | 25d | 1 | 1.25mi |
| 506 New Bern Station Ct Charlotte, NC | 2.0 | 2.5 | 1526 | $2,600 | $1.70 | 4d | 1 | 1.26mi |
Listing history 8 events
-
2026-05-13price $300,000
-
2026-04-14price $320,000
-
2026-03-13$324,000 Active
-
2025-11-03price $324,900
-
2025-10-21price $329,900
-
2025-10-08price $337,000
-
2025-09-16$340,000 Active
-
2005-05-25soldstatus $234,500
ⓘ Source: listings_history table (triggers on properties + properties_extension) + one-shot
backfill from property_details.listing_events for pre-trigger history.
Tax reassessment forecast NC · Resets to sale price
- Current annual tax
- $2,438 · $203/mo
- Projected year-2 tax
- $2,460 · $205/mo
- Expected delta
- +$22/yr (+$2/mo · 0.9%)
ⓘ Screening estimate from a state-policy table — verify with the county assessor before closing.
Climate risk First Street
- Flood 1/10 Low FEMA zone X (unshaded) · 0% chance over 30 yrs
- Wildfire 1/10 Low
- Heat 6/10 Major 7 d/yr ≥103°F today · 17 d/yr by 30 yrs out
- Wind 6/10 Major 27% chance of damaging wind over 30 yrs
- Air quality 3/10 Moderate 3 unhealthy d/yr today · 4 by 30 yrs out
Nearby sold comps map
Loading sold comps map…
Walkable amenities ~0.75 mi
Loading nearby amenities…
Taxation est. · year 1
- Rental income
- $29,057
- − Mortgage interest
- −$16,805
- − Property taxes
- −$2,438
- − Insurance
- −$1,500
- − Repairs & maintenance
- −$2,325
- − Management
- −$2,325
- − Depreciation
- −$8,727
- Taxable loss
- −$5,062
- Est. tax savings @ 24.0%
- +$1,215
- After-tax cash flow
- $1,353/yr
For passive investors: Depreciation is non-cash, so a rental often shows a tax loss while cash-flowing — sheltering income. Rental losses are passive: they offset passive income freely, and up to $25,000/yr can offset ordinary (W-2) income if you actively participate and your MAGI is under $100k (phasing out to $0 by $150k); unused losses carry forward. On sale, claimed depreciation is recaptured at up to 25%, and gains may owe capital-gains tax (a 1031 exchange can defer both). Figures are a year-1 estimate at your 24.0% rate — not tax advice; consult a CPA.
Schools (NCES district)
- District
- Charlotte-Mecklenburg Schools
- NCES district ID
- 3702970
- Math proficiency
- 42% ▼ -6.00%
- Reading proficiency
- 46% ▲ 1.00%
- Median HH income
- $57,175
- Composite
- 38.49/100
- National rank
- #4183
- State rank
- #85 of 178 in NC
Livability — Charlotte
- Score
- 78/100
- State rank
- #26
- US rank
- #2502
Category grades
Schools grade is shown separately in the Schools card above.
Census & demographics
- Census place
- Charlotte, NC
- County
- Mecklenburg County · 1,167,319 people
- City population
- 920,422
- Metro
- Charlotte-Concord-Gastonia, NC-SC
- Population (ZIP)
- 32,064
- Household income
- $64,028
- Rent vs Own
- Severe rent burden
- 2144.0
Population outlook (Mecklenburg County) Hauer SSP2
- Today (2025)
- 1,305,740 people
- By 2030
- 1,442,752 · +10.5%
- By 2040
- 1,722,441 · +31.9%
- By 2050
- 1,999,450 · +53.1%
- By 2075
- 2,642,495 · +102.4%
- By 2100
- 3,106,755 · +137.9%
Race, ethnicity, and origin ACS 2023
- Neighborhood character
- Highly diverse neighborhood (Simpson 0.71)
- Race & ethnicity
- Hispanic / Latino 37% Black 35% Two or more races 19% White 17% Asian 8%
- Hispanic origin (detail)
- Mexican 7% Dominican 2%
- Common ancestry
- Swiss 2% Italian 1% Slovak 1%
- Foreign-born
- 34% · Canada, Jamaica, Vietnam
- Languages at home
- 58% English-only · Spanish 35% Other Indo-European 2% Other Asian/Pacific 2%
Political lean MEDSL · Mecklenburg
- 2024 margin
- Solid D (+32.9) · D 65.6% · R 32.7% · Other 1.6%
- 2008→2024 swing
- +8.5pp toward D · 2008: 24.4pp · 2024: 32.9pp
- All cycles
- 2024: D+32.9 2020: D+35.1 2016: D+29.9 2012: D+22.5 2008: D+24.4
Not yet ingested
- Civics
- —
Market trends
- HPI YoY
- ▼ -57.23%
- Current HPI
- 330.7033
- Rent YoY
- ▬ 0.04%
- Metro
- Charlotte-Concord-Gastonia, NC-SC
- State GDP YoY
- ▲ 3.28%
- F500 in state
- 26
Industry mix (Fortune 500 HQ in NC)
| Industry | F500 HQs | Revenue |
|---|---|---|
| Financial Services | 2 | $213B |
|
||
| Retail | 2 | $95B |
|
||
| Industrial Conglomerate | 1 | $38B |
|
||
| Metals / Steel | 1 | $35B |
|
||
| Utilities | 1 | $30B |
|
||
| Industrial Machinery | 1 | $19B |
|
||
Price history
+27.9% since first listed8 events — show timeline
- 2026-05-13 Price Changed $300,000 CANOPYMLS as Distributed by MLS Grid
- 2026-04-14 Price Changed $320,000 CANOPYMLS as Distributed by MLS Grid
- 2026-03-13 Listed $324,000 CANOPYMLS as Distributed by MLS Grid
- 2025-11-03 Price Changed $324,900 CANOPYMLS as Distributed by MLS Grid
- 2025-10-21 Price Changed $329,900 CANOPYMLS as Distributed by MLS Grid
- 2025-10-08 Price Changed $337,000 CANOPYMLS as Distributed by MLS Grid
- 2025-09-16 Listed $340,000 CANOPYMLS as Distributed by MLS Grid
- 2005-05-25 Sold (Public Records) $234,500 Public Records
Property tax history
+4.2%/yrLatest (2025): $2,438 · +2.1% YoY. Source: county tax records.
Cash-flow waterfall
monthlySold comps — $/sqft
last 12 mo · ≤1 miLoading sold comps…