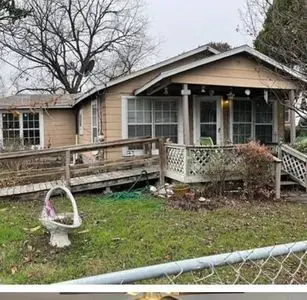
409 N San Gabriel Ave · San Antonio, TX
Flood risk 1/10 · Minimal
- FEMA flood zone
- X (unshaded)
- Chance of flooding over 30 yrs
- 0.0%
- Est. flood insurance / yr
- $507 – $1,088
Fire risk 1/10 · Minimal
- Est. fire insurance / yr
- $1,222 – $2,270
Heat risk 8/10 · Major
- Hot days now (above 108°F)
- 7 days/yr
- Hot days in 30 yrs
- 21 days/yr
Wind risk 6/10 · Moderate
- Chance of severe wind over 30 yrs
- 77.0%
Air-quality risk 2/10 · Minimal
- Unhealthy air days now
- 1 days/yr
- Unhealthy air days in 30 yrs
- 1 days/yr
Risk factors via First Street. Map © Google.
Why this score? — see what drove the B- grade
The composite is a weighted blend of 9 inputs, each scored 0–100. Each bar is that input's sub-score; the figure is the points it added to the 100-point composite (weight × sub-score).
- Cash flow +30.0/30.0
- 1% rule +10.0/10.0
- DSCR +10.0/10.0
- ARV discount +7.5/15.0
- Livability +4.0/5.0
- Rent growth +3.7/5.0
- Condition / age +2.5/5.0
- Schools +1.3/10.0
- Appreciation +0.0/10.0
$58,000
🖨 Deal sheet 📄 Offer letter ✓ Due diligence
Listing remarks
This cozy 2-bedroom, 1-bath home has been a quiet little place to call home and is ready for someone new to bring it back to life. Sitting on a large lot, there & acirc; & euro; & trade; s plenty of space to enjoy the outdoors, garden, or even expand down the road. The home was built in 1968 and still carries that original charm, but it does need some updates and repairs. The roof is over 10 years old, the home is cooled with window units, and there is some foundation work needed, making this a great opportunity for someone looking for a fixer-upper with potential. Inside, the layout is simple and functional, and with a little vision, it could really shine again. Whether you &am
Key facts
- Large lot
- Peaceful setting
- Built 1968
Tags
Property features AI
Finance
- Other: No additional financial or community details available
- Financial info: Financial details not specified
- HOA & community: HOA details not specified
Exterior
- Parking: Parking details not specified
- Security: Security details not specified
- Utilities: Utility details not specified
- Home design: Single-story property; Built in 1968
- Construction: 796 living area (interior size not specified in detail)
- Exterior features: Located in the Edgewood subdivision
Interior
- Kitchen: Kitchen details not specified
- Bedrooms: Bedroom count not specified
- Flooring: Flooring details not specified
- Bathrooms: Bathroom count not specified
- Heating & cooling: Heating and cooling details not specified
- Interior features: No interior feature details available
- Laundry & utility: Laundry and utility details not specified
Neighborhood map
What this means for you Summary
Snapshot
- This is a 2-bed/1.0-bath single-family listed at $58k.
Deal economics
- At list price, monthly cash flow is $396 ($5k/yr) — positive.
- The deal already cash-flows at list — no discount required.
- Meets the 1% rule at list price ($1k rent vs $58k).
- Recommended offer: $56k (3.0% below list) — sets the bar for market timing.
- Cap rate 14.5% vs local median 3.8% in San Antonio — top-decile yield for the area; either an underpriced asset or a hidden risk that comps aren't pricing in. Stress-test before assuming the spread holds.
Location & tenants
- Location reads 80/100 on livability (#31 in TX, #1,616 nationally) — a professional / high-income tenant draw. Strengths: amenities A+, commute A+, cost of living A+; Watch: schools C-, crime F.
- Edgewood ISD (urban): math 12% / reading 21% proficiency, ranked #812 of 826 in TX (top 98%) — low school quality limits family demand, transient renter base, plan for 1-2y turnover.
- Market conditions: Rents rising fast (+4.9%/yr); 91 active listings in the ZIP; 19 comparable units currently listed for rent nearby; rentals at typical pace (median 22d on market — plan ~3-4 weeks tenant-placement turnaround); 8,308 units permitted in Bexar County in 2024 (2,506 in 5+ unit buildings).
Forward outlook
- Local home prices are declining (-3.0%/yr); year-one equity from $401 of loan paydown is wiped out by about $2k of value loss. Plan a longer hold.
- Bexar County population projected at +50% by 2050 — long-run rental-demand tailwind backs the buy-and-hold thesis.
- At projected returns (-3.0% appreciation + 4.9% rent growth), your $16k cash investment doubles in ~4 years — after that, you're playing with house money.
Negotiation context
- It's been on market 37 days — a 3% lower offer ($56k) is reasonable based on typical stale-listing flexibility.
- 2 sale attempts; this cycle's ask has dropped $7k (11%) from the opening price — seller is motivated, your offer sets the floor, not the list.
Risks & watch-outs
- Watch-outs: property tax is 4.4% of price.
- Climate carrying-cost: major wind risk, 77% chance of damaging wind over 30y; extreme-heat days projected 7→21/yr by 2055 (HVAC capex compounding) — expect insurance premiums to compound above CPI over the hold.
Questions for the listing agent
- It's been on market 37 days. Have you received any prior offers? Is the seller open to a 3% concession, seller financing, or rate buy-down credit?
- Built in 1968 — when were the roof, HVAC, electrical panel, plumbing, and water heater last replaced?
- Property tax is high relative to price — has the assessment been appealed recently, and will the sale trigger a re-assessment?
- Is there a deadline driving the sale (1031 exchange, divorce, estate, relocation)? That informs how much negotiation room exists.
- Crime grade is F in this area — have there been break-ins, vandalism, or insurance claims at this property in the last 3 years? What carrier currently insures it and at what premium?
- What's the average days-on-market for RENTAL listings here right now (not sales)? A rising rental-DOM trend means longer vacancies and softer asking-rent achievability than the comps imply.
- What's the recent tenant-quality profile in this submarket — average credit score on applications, eviction rate, late-payment / NSF rate, and stable-employment percentage? A property-management company in the area should have these aggregated.
- How much new for-sale + rental construction is in the pipeline within 1–3 miles? Heavy new supply typically softens prices + rents 12–24 months out; constrained supply supports both.
Investment metrics
- 1% rule
- 2.05% ✓
- Cap rate
- 14.49%
- Cash-on-cash
- 29.27%
- DSCR
- 2.30
- GRM
- 4.1
CMA / ARV
- ARV (on-the-fly)
- $211,736
- Comps found
- 1
Show comp detail 1 sale within ~0.75 mi
| Address | Dist | Beds/Ba | Sqft | Sold | Price | $/sf | Match |
|---|---|---|---|---|---|---|---|
| 414 Bradford Ave | 0.66mi | 2/1.0 | 732 (-8%) | 22mo | $194,999 | $266 | 38 |
Match score weights: distance 35% · size 25% · config 20% · recency 20%. Top-matched comps best support the ARV.
Projected returns pro-forma
-3.0% appreciation · 4.92% rent growth · sell at horizon
- IRR
- 26.3%
- Equity multiple
- 2.13×
- Total profit
- $18,277
- Equity at exit
- $8,648
- IRR
- 35.4%
- Equity multiple
- 4.62×
- Total profit
- $58,815
- Equity at exit
- $5,015
Cash invested: $16,240 (down + closing). Projections, not guarantees.
Landlord ↔ Tenant lean methodology
- Overall (STATE)
- 87 Strongly Landlord-Friendly
- State Texas
- 87 Strongly Landlord-Friendly · R+5
- County
- — inherits STATE
- City
- — inherits STATE
ZIP-level market 78228
- Home prices YoY
- -22.1%
- Rents YoY
- 4.9%
- Active inventory
- 91
- Price-to-rent
- 4.1×
Monthly cashflow live
- Estimated rent
- $1,188 high interval (Pro) →
- Mortgage (P&I)
- −$304
- Tax from tax record
- −$214 /mo · $2,571/yr
- Insurance
- −$24
- HOA
- −$0
- Vacancy / Maint / Mgmt
- −$250
- Net cashflow
- $396
Break-even live
UW: 25.0% down · 7.5% · 30yr · 1.5% tax · 5.0% vac · 8.0% maint · 8.0% mgmt
Financing live
Cash to close
- Down payment
- $14,500
- Closing costs
- $1,740
- Reserves months
- —
- Total cash needed
- —
Loan-product check · same deal, 3 products live
Conventional
25% down · 7.5% · 30yr
- Down + closing
- —
- Monthly P&I
- —
- Monthly cashflow
- —
- DSCR
- —
- Eligible?
- —
Personal DTI + credit; lowest rate.
DSCR
20% down · 8.5% · 30yr
- Down + closing
- —
- Monthly P&I
- —
- Monthly cashflow
- —
- DSCR
- —
- Eligible?
- —
No personal income docs; deal must DSCR.
Hard money
10% down · 12.0% · 12mo
- Down + closing
- —
- Monthly P&I
- —
- Monthly cashflow
- —
- DSCR
- —
- Eligible?
- —
Short-term bridge; refi at stabilization.
Rent comps 19 comps
| Address | Beds | Baths | Sqft | Rent | $/sqft | DOM | Units | Dist |
|---|---|---|---|---|---|---|---|---|
| 2553 Cincinnati Ave San Antonio, TX | 1.0 | 1.0 | 800 | $780 | $0.97 | 23d | 1 | 0.90mi |
| 2426 Cincinnati Ave San Antonio, TX | 2.0 | 1.0 | 700 | $975 | $1.39 | 23d | 1 | 0.90mi |
| 2503 Arbor Pl San Antonio, TX | 2.0 | 1.0 | 750 | $800 | $1.07 | 43d | 1 | 0.97mi |
| 2331 Cincinnati Ave Unit 2345 04 San Antonio, TX | 1.0 | 1.0 | 750 | $900 | $1.20 | 3d | 1 | 0.99mi |
| 2331 Cincinnati Ave Unit 2345 03 San Antonio, TX | 3.0 | 1.0 | 950 | $1,300 | $1.37 | 3d | 1 | 1.00mi |
| 122 Collins Ct San Antonio, TX | 2.0 | 1.0 | 927 | $1,150 | $1.24 | 21d | 1 | 1.01mi |
| 2331 Cincinnati Ave San Antonio, TX | 1.0–3.0 | 1.0 | 850 | $1,100 | $1.29 | 12d | 3 | 1.01mi |
| 224 Marquette Dr San Antonio, TX | 2.0 | 1.0 | 984 | $1,350 | $1.37 | 23d | 1 | 1.07mi |
| 306 Overhill Dr San Antonio, TX | 2.0 | 1.0 | 1009 | $1,200 | $1.19 | 4d | 1 | 1.12mi |
| 3156 W French Pl San Antonio, TX | 2.0 | 2.0 | 1100 | $1,150 | $1.05 | 43d | 1 | 1.15mi |
| 1218 NW 23rd St Unit 2 San Antonio, TX | 1.0 | 10.5 | 548 | $950 | $1.73 | 23d | 1 | 1.18mi |
| 3301 W Woodlawn Ave San Antonio, TX | 1.0–2.0 | 1.0 | 825 | $881 | $1.07 | 23d | 3 | 1.22mi |
| 127 Riverdale Dr San Antonio, TX | 3.0 | 1.0 | 1032 | $1,100 | $1.07 | 12d | 1 | 1.25mi |
| 2825 W Woodlawn Ave Unit 2825-WW San Antonio, TX | 2.0 | 1.0 | 700 | $1,195 | $1.71 | 3d | 1 | 1.28mi |
| 2718 W Craig Pl San Antonio, TX | 2.0 | 1.0 | 1004 | $1,350 | $1.34 | 12d | 1 | 1.40mi |
| 2718 W Craig Pl San Antonio, TX | 2.0 | 1.0 | 1004 | $1,350 | $1.34 | 10d | 1 | 1.40mi |
| 102 E Cheryl Dr #2 San Antonio, TX | 1.0 | 1.0 | 600 | $800 | $1.33 | 43d | 1 | 1.42mi |
| 314 Globe Ave San Antonio, TX | 3.0 | 2.0 | 936 | $1,600 | $1.71 | 2d | 1 | 1.44mi |
| 1171 Bandera Rd San Antonio, TX | 1.0–2.0 | 1.0 | 750 | $1,375 | $1.83 | 23d | 5 | 1.49mi |
Listing history 16 events
-
2026-06-18days on market $58,000 Active 37 DOM
-
2026-06-17days on market $58,000 Active 36 DOM
-
2026-06-17price $58,000 Active 35 DOM
-
2026-06-16days on market $65,000 Active 35 DOM
-
2026-06-15days on market $65,000 Active 34 DOM
-
2026-06-13days on market $65,000 Active 32 DOM
-
2026-06-12days on market $65,000 Active 31 DOM
-
2026-06-09days on market $65,000 Active 28 DOM
-
2026-06-08days on market $65,000 Active 27 DOM
-
2026-06-08days on market $65,000 Active 26 DOM
-
2026-06-07days on market $65,000 Active 25 DOM
-
2026-06-03days on market $65,000 Active 22 DOM
-
2026-06-02days on market $65,000 Active 21 DOM
-
2026-06-01days on market $65,000 Active 20 DOM
-
2026-05-31remarks 687-char remark
-
2026-05-31$65,000 Active 19 DOM
ⓘ Source: listings_history table (triggers on properties + properties_extension) + one-shot
backfill from property_details.listing_events for pre-trigger history.
Tax reassessment forecast TX · Resets to sale price
- Current annual tax
- $2,571 · $214/mo
- Projected year-2 tax
- $2,571 · $214/mo
- Expected delta
- $0/yr ($0/mo · 0.0%)
ⓘ Screening estimate from a state-policy table — verify with the county assessor before closing.
Climate risk First Street
- Flood 1/10 Low FEMA zone X (unshaded) · 0% chance over 30 yrs
- Wildfire 1/10 Low
- Heat 8/10 Severe 7 d/yr ≥108°F today · 21 d/yr by 30 yrs out
- Wind 6/10 Major 77% chance of damaging wind over 30 yrs
- Air quality 2/10 Low 1 unhealthy d/yr today · 1 by 30 yrs out
Nearby sold comps map
Loading sold comps map…
Walkable amenities ~0.75 mi
Loading nearby amenities…
Taxation est. · year 1
- Rental income
- $14,259
- − Mortgage interest
- −$3,249
- − Property taxes
- −$2,571
- − Insurance
- −$290
- − Repairs & maintenance
- −$1,141
- − Management
- −$1,141
- − Depreciation
- −$1,687
- Taxable income
- $4,180
- Est. tax owed @ 24.0%
- −$1,003
- After-tax cash flow
- $3,750/yr
For passive investors: Depreciation is non-cash, so a rental often shows a tax loss while cash-flowing — sheltering income. Rental losses are passive: they offset passive income freely, and up to $25,000/yr can offset ordinary (W-2) income if you actively participate and your MAGI is under $100k (phasing out to $0 by $150k); unused losses carry forward. On sale, claimed depreciation is recaptured at up to 25%, and gains may owe capital-gains tax (a 1031 exchange can defer both). Figures are a year-1 estimate at your 24.0% rate — not tax advice; consult a CPA.
Schools (NCES district)
- District
- Edgewood ISD
- NCES district ID
- 4818150
- Math proficiency
- 12% ▼ -18.00%
- Reading proficiency
- 21% ▼ -5.00%
- Median HH income
- $27,419
- Composite
- 12.82/100
- National rank
- #9597
- State rank
- #812 of 826 in TX
Livability — San Antonio
- Score
- 80/100
- State rank
- #31
- US rank
- #1616
Category grades
Schools grade is shown separately in the Schools card above.
Census & demographics
- Census place
- San Antonio, TX
- County
- Bexar County · 1,990,555 people
- City population
- 1,806,925
- Metro
- San Antonio-New Braunfels, TX
- Population (ZIP)
- 56,165
- Household income
- $52,976
- Rent vs Own
- Severe rent burden
- 2709.0
Population outlook (Bexar County) Hauer SSP2
- Today (2025)
- 2,336,851 people
- By 2030
- 2,560,728 · +9.6%
- By 2040
- 3,020,569 · +29.3%
- By 2050
- 3,493,522 · +49.5%
- By 2075
- 4,668,459 · +99.8%
- By 2100
- 5,533,242 · +136.8%
Race, ethnicity, and origin ACS 2023
- Neighborhood character
- Predominantly Hispanic (88%)
- Race & ethnicity
- Hispanic / Latino 88% Two or more races 43% White 8% Black 2%
- Hispanic origin (detail)
- Mexican 80%
- Common ancestry
- Italian 1% Lithuanian 1%
- Foreign-born
- 15% · Canada
- Languages at home
- 46% English-only · Spanish 53% Other Indo-European 1%
Political lean MEDSL · Bexar
- 2024 margin
- Lean D (+9.8) · D 54.3% · R 44.6% · Other 1.1%
- 2008→2024 swing
- +4.2pp toward D · 2008: 5.6pp · 2024: 9.8pp
- All cycles
- 2024: D+9.8 2020: D+18.2 2016: D+13.5 2012: D+4.6 2008: D+5.6
Not yet ingested
- Civics
- —
Market trends
- HPI YoY
- ▼ -74.04%
- Current HPI
- 261.1558
- Rent YoY
- ▲ 4.92%
- Metro
- San Antonio-New Braunfels, TX
- State GDP YoY
- ▲ 3.95%
- F500 in state
- 110
Industry mix (Fortune 500 HQ in TX)
| Industry | F500 HQs | Revenue |
|---|---|---|
| Energy | 16 | $1,198B |
|
||
| Technology | 5 | $198B |
|
||
| Engineering / Construction | 4 | $72B |
|
||
| Energy Services | 3 | $60B |
|
||
| Utilities | 3 | $41B |
|
||
| Healthcare | 2 | $330B |
|
||
Price history
-31.6% since first listed8 events — show timeline
- 2026-05-12 Listed $65,000 FSBO.com
- 2025-05-06 Listing Removed — HARMLS
- 2025-05-01 Price Changed $68,000 HARMLS
- 2025-04-10 Price Changed $75,000 HARMLS
- 2025-04-01 Price Changed $80,000 HARMLS
- 2025-03-12 Price Changed $85,000 HARMLS
- 2025-03-05 Price Changed $90,000 HARMLS
- 2025-02-20 Listed $95,000 HARMLS
Property tax history
+6.6%/yrLatest (2025): $2,571 · +0.8% YoY. Source: county tax records.
Cash-flow waterfall
monthlySold comps — $/sqft
last 12 mo · ≤1 miLoading sold comps…