 🌊 Lakefront
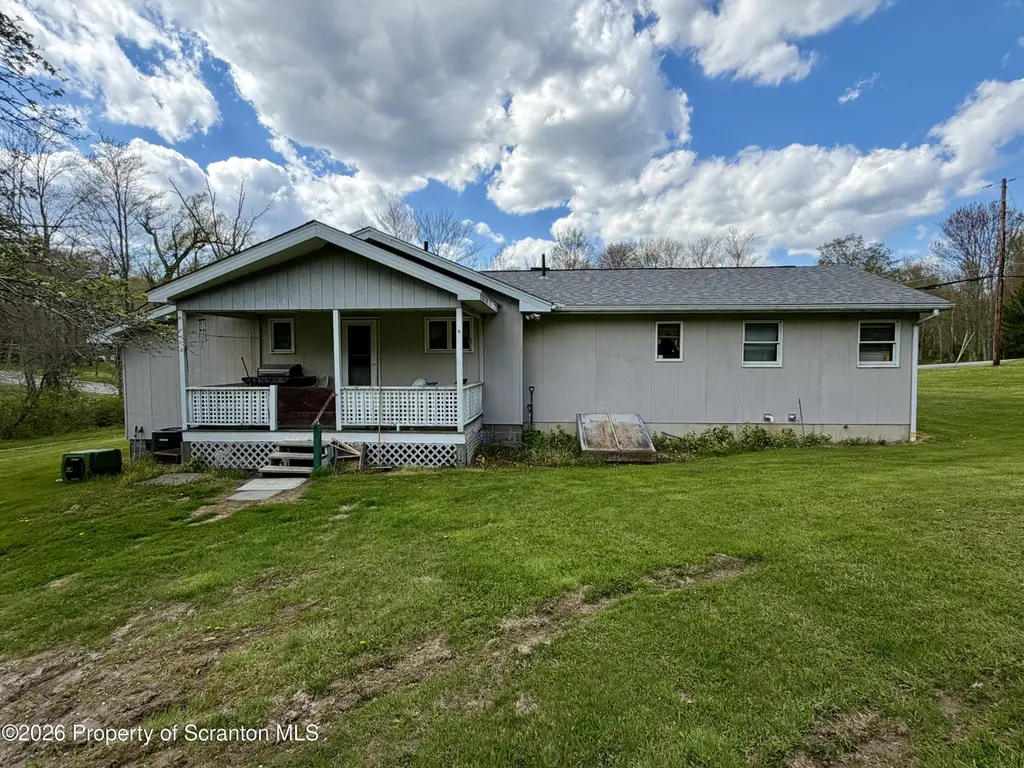
7644 State Route 374 · Clifford, PA
Flood risk 1/10 · Minimal
- FEMA flood zone
- X (unshaded)
- Chance of flooding over 30 yrs
- 0.0%
- Est. flood insurance / yr
- $473 – $860
Fire risk 1/10 · Minimal
- Est. fire insurance / yr
- $511 – $949
Heat risk 2/10 · Minimal
- Hot days now (above 91°F)
- 7 days/yr
- Hot days in 30 yrs
- 16 days/yr
Wind risk 2/10 · Minimal
- Chance of severe wind over 30 yrs
- 3.0%
Air-quality risk 2/10 · Minimal
- Unhealthy air days now
- 1 days/yr
- Unhealthy air days in 30 yrs
- 1 days/yr
Risk factors via First Street. Map © Google.
Why this score? — see what drove the D+ grade
The composite is a weighted blend of 9 inputs, each scored 0–100. Each bar is that input's sub-score; the figure is the points it added to the 100-point composite (weight × sub-score).
- Cash flow +14.7/30.0
- ARV discount +7.5/15.0
- Appreciation +7.0/10.0
- DSCR +4.5/10.0
- 1% rule +3.8/10.0
- Schools +3.4/10.0
- Rent growth +2.5/5.0
- Livability +2.5/5.0
- Condition / age +2.5/5.0
$239,000
🖨 Deal sheet 📄 Offer letter ✓ Due diligence
Listing remarks
Cozy 2-bedroom, 1.75-bath home tucked away in a quiet, peaceful setting. With a few updates, this property has incredible potential to truly shine. Location is everything--just across from Idlewild Lake, offering a perfect blend of relaxation and convenience. An additional parcel is included, providing ample outdoor space for recreation, expansion, or simply enjoying the surroundings. Bonus area above the garage offers endless possibilities for additional living space, a guest area, home office, studio, or recreation room.
Key facts
- Ample outdoor space
- Quiet setting
- Additional parcel
Tags
Property features AI
Exterior
- Parking: Detached garage and driveway (1 garage space)
- Utilities: Electricity connected (100 amp service); Propane service; Public sewer connected; Water connected (well needed)
- Home design: Residential single-family home; Built in 1960 (estimated)
- Construction: Concrete construction; Shingle roof; Foundation details available in remarks
- Exterior features: Private yard; Front porch; Back yard; Level lot; Other exterior features
Interior
- Kitchen: Gas range; Refrigerator
- Bedrooms: 2 bedrooms (one ~19 x 12, one ~12 x 10)
- Flooring: Vinyl flooring
- Bathrooms: 2 full bathrooms
- Heating & cooling: Propane heating; No cooling
- Interior features: Fireplace(s); Pull-down attic stairs; Basement with crawl space and full areas; Other interior features
- Laundry & utility: Dedicated laundry room (~7.5 x 7)
Neighborhood map
What this means for you Summary
Snapshot
- This is a 2-bed/2.0-bath single-family listed at $239k.
Deal economics
- At list price, monthly cash flow is $63 ($756/yr) — positive.
- The deal already cash-flows at list — no discount required.
- To meet the 1% rule (rent ≥ 1% of price), the offer needs to be $210k (12.2% below list).
- Recommended offer: $210k (12.2% below list) — sets the bar for 1% rule.
Location & tenants
- Location reads: area grade D — affects rentability + tenant quality, not the cash-flow math above.
- Mountain View SD (rural): math 30% / reading 50% proficiency, ranked #351 of 539 in PA (top 65%) — families likely to look elsewhere, expect single-tenant / working-renter base with shorter leases.
- Market conditions: 32 active listings in the ZIP; 80 units permitted in Susquehanna County in 2024 (5 in 5+ unit buildings).
Forward outlook
- In year one you build about $11k of equity ($2k loan paydown + $10k appreciation (4.1% local appreciation)).
- Susquehanna County population projected at -30% by 2050 — secular population decline; favor cash flow + early exit over multi-decade hold.
- At projected returns (4.1% appreciation + 3.0% rent growth), your $67k cash investment doubles in ~5 years — after that, you're playing with house money.
- By year 4, paydown + projected appreciation supports a ~$39k cash-out refi (75% LTV) — recoverable capital for the next deal without selling this one.
Negotiation context
- It's been on market 42 days — a 3% lower offer ($232k) is reasonable based on typical stale-listing flexibility.
Questions for the listing agent
- It's been on market 42 days. Have you received any prior offers? Is the seller open to a 12% concession, seller financing, or rate buy-down credit?
- Built in 1960 — when were the roof, HVAC, electrical panel, plumbing, and water heater last replaced?
- Is there a deadline driving the sale (1031 exchange, divorce, estate, relocation)? That informs how much negotiation room exists.
- The area grade is low — what's the realistic commute time and amenity access for the typical tenant pool here? Any planned neighborhood developments (good or bad) we should know about?
- This sits on a lake — are riparian / water-frontage rights deeded with the parcel? Any dock permits, shoreline easements, or HOA water-use restrictions?
- What's the documented flood / surge / shoreline-erosion history here (FEMA AND non-FEMA — e.g., storm surge, creek backup, septic-field saturation)?
- Any water-quality or seasonal algae-bloom issues that affect tenant satisfaction or short-term-rental demand?
- What's the average days-on-market for RENTAL listings here right now (not sales)? A rising rental-DOM trend means longer vacancies and softer asking-rent achievability than the comps imply.
- What's the recent tenant-quality profile in this submarket — average credit score on applications, eviction rate, late-payment / NSF rate, and stable-employment percentage? A property-management company in the area should have these aggregated.
- How much new for-sale + rental construction is in the pipeline within 1–3 miles? Heavy new supply typically softens prices + rents 12–24 months out; constrained supply supports both.
Investment metrics
- 1% rule
- 0.88% ✗
- Cap rate
- 6.61%
- Cash-on-cash
- 1.13%
- DSCR
- 1.05
- GRM
- 9.5
CMA / ARV
No comps found within radius.
Projected returns pro-forma
4.1% appreciation · 3.0% rent growth · sell at horizon
- IRR
- 11.5%
- Equity multiple
- 1.70×
- Total profit
- $46,969
- Equity at exit
- $122,541
- IRR
- 13.1%
- Equity multiple
- 3.17×
- Total profit
- $144,921
- Equity at exit
- $201,522
Cash invested: $66,920 (down + closing). Projections, not guarantees.
Landlord ↔ Tenant lean methodology
- Overall (STATE)
- 62 Landlord-Friendly
- State Pennsylvania
- 62 Landlord-Friendly · EVEN
- County
- — inherits STATE
- City
- — inherits STATE
ZIP-level market 18470
- Home prices YoY
- 2.4%
- Active inventory
- 32
- Price-to-rent
- 9.5×
Monthly cashflow live
- Estimated rent
- $2,098 medium interval (Pro) →
- Mortgage (P&I)
- −$1,253
- Tax from tax record
- −$241 /mo · $2,896/yr
- Insurance
- −$100
- HOA
- −$0
- Vacancy / Maint / Mgmt
- −$441
- Net cashflow
- $63
Break-even live
UW: 25.0% down · 7.5% · 30yr · 1.5% tax · 5.0% vac · 8.0% maint · 8.0% mgmt
Financing live
Cash to close
- Down payment
- $59,750
- Closing costs
- $7,170
- Reserves months
- —
- Total cash needed
- —
Loan-product check · same deal, 3 products live
Conventional
25% down · 7.5% · 30yr
- Down + closing
- —
- Monthly P&I
- —
- Monthly cashflow
- —
- DSCR
- —
- Eligible?
- —
Personal DTI + credit; lowest rate.
DSCR
20% down · 8.5% · 30yr
- Down + closing
- —
- Monthly P&I
- —
- Monthly cashflow
- —
- DSCR
- —
- Eligible?
- —
No personal income docs; deal must DSCR.
Hard money
10% down · 12.0% · 12mo
- Down + closing
- —
- Monthly P&I
- —
- Monthly cashflow
- —
- DSCR
- —
- Eligible?
- —
Short-term bridge; refi at stabilization.
Listing history 16 events
-
2026-06-18days on market $239,000 Active 42 DOM
-
2026-06-17days on market $239,000 Active 41 DOM
-
2026-06-16days on market $239,000 Active 40 DOM
-
2026-06-15days on market $239,000 Active 39 DOM
-
2026-06-14days on market $239,000 Active 37 DOM
-
2026-06-13pricedays on market $239,000 Active 36 DOM
-
2026-06-10days on market $259,000 Active 34 DOM
-
2026-06-09days on market $259,000 Active 33 DOM
-
2026-06-08days on market $259,000 Active 32 DOM
-
2026-06-07days on market $259,000 Active 31 DOM
-
2026-06-03days on market $259,000 Active 27 DOM
-
2026-06-02days on market $259,000 Active 26 DOM
-
2026-06-01days on market $259,000 Active 25 DOM
-
2026-05-31days on market $259,000 Active 24 DOM
-
2026-05-30days on market $259,000 Active 23 DOM
-
2026-05-06$279,000 Active 528-char remark
ⓘ Source: listings_history table (triggers on properties + properties_extension) + one-shot
backfill from property_details.listing_events for pre-trigger history.
Tax reassessment forecast PA · Partial reset (capped growth)
- Current annual tax
- $2,896 · $241/mo
- Projected year-2 tax
- $3,336 · $278/mo
- Expected delta
- +$440/yr (+$37/mo · 15.2%)
ⓘ Screening estimate from a state-policy table — verify with the county assessor before closing.
Climate risk First Street
- Flood 1/10 Low FEMA zone X (unshaded) · 0% chance over 30 yrs
- Wildfire 1/10 Low
- Heat 2/10 Low 7 d/yr ≥91°F today · 16 d/yr by 30 yrs out
- Wind 2/10 Low 3% chance of damaging wind over 30 yrs
- Air quality 2/10 Low 1 unhealthy d/yr today · 1 by 30 yrs out
Nearby sold comps map
Loading sold comps map…
Walkable amenities ~0.75 mi
Loading nearby amenities…
Taxation est. · year 1
- Rental income
- $25,173
- − Mortgage interest
- −$13,388
- − Property taxes
- −$2,896
- − Insurance
- −$1,195
- − Repairs & maintenance
- −$2,014
- − Management
- −$2,014
- − Depreciation
- −$6,953
- Taxable loss
- −$3,286
- Est. tax savings @ 24.0%
- +$789
- After-tax cash flow
- $1,544/yr
For passive investors: Depreciation is non-cash, so a rental often shows a tax loss while cash-flowing — sheltering income. Rental losses are passive: they offset passive income freely, and up to $25,000/yr can offset ordinary (W-2) income if you actively participate and your MAGI is under $100k (phasing out to $0 by $150k); unused losses carry forward. On sale, claimed depreciation is recaptured at up to 25%, and gains may owe capital-gains tax (a 1031 exchange can defer both). Figures are a year-1 estimate at your 24.0% rate — not tax advice; consult a CPA.
Schools (NCES district)
- District
- Mountain View SD
- NCES district ID
- 4216050
- Math proficiency
- 30% ▼ -17.00%
- Reading proficiency
- 50% ▼ -13.00%
- Median HH income
- $50,744
- Composite
- 34.49/100
- National rank
- #5183
- State rank
- #351 of 539 in PA
Livability — Clifford
No livability data for this city. (Only ~50 U.S. cities are tracked.)
Census & demographics
- Population (ZIP)
- 2,296
Population outlook (Susquehanna County) Hauer SSP2
- Today (2025)
- 37,552 people
- By 2030
- 35,270 · -6.1%
- By 2040
- 30,663 · -18.3%
- By 2050
- 26,492 · -29.5%
- By 2075
- 19,658 · -47.7%
- By 2100
- 15,179 · -59.6%
Race, ethnicity, and origin ACS 2023
- Neighborhood character
- Predominantly White (91%)
- Race & ethnicity
- White 91% Two or more races 6% Hispanic / Latino 6%
- Hispanic origin (detail)
- Puerto Rican 2% Cuban 2%
- Common ancestry
- Romanian 9% Scotch-Irish 5% Slovak 2%
- Foreign-born
- 2%
- Languages at home
- 97% English-only · Spanish 2% Tagalog/Filipino 1%
Political lean MEDSL · Susquehanna
- 2024 margin
- Solid R (+44.7) · D 27.2% · R 71.9%
- 2008→2024 swing
- -33.0pp toward R · 2008: -11.7pp · 2024: -44.7pp
- All cycles
- 2024: R+44.7 2020: R+41.2 2016: R+42.9 2012: R+21.4 2008: R+11.7
Not yet ingested
- Civics
- —
Market trends
- HPI YoY
- ▲ 4.10%
- Current HPI
- 176.7866
- Rent YoY
- —
- Metro
- —
- State GDP YoY
- ▲ 1.68%
- F500 in state
- 34
Industry mix (Fortune 500 HQ in PA)
| Industry | F500 HQs | Revenue |
|---|---|---|
| Healthcare | 2 | $309B |
|
||
| Insurance | 2 | $27B |
|
||
| Telecommunications / Media | 1 | $124B |
|
||
| Industrial Distribution | 1 | $22B |
|
||
| Financial Services | 1 | $20B |
|
||
| Chemicals / Materials | 1 | $18B |
|
||
Price history
-14.3% since first listed3 events — show timeline
- 2026-06-10 Price Changed $239,000 GSBR as distributed by MLS GRID
- 2026-05-22 Price Changed $259,000 GSBR as distributed by MLS GRID
- 2026-05-06 Listed $279,000 GSBR as distributed by MLS GRID
Property tax history
+2.9%/yrLatest (2026): $2,896 · +3.3% YoY. Source: county tax records.
Cash-flow waterfall
monthlySold comps — $/sqft
last 12 mo · ≤1 miLoading sold comps…