718 N Broadway · Kampsville, IL
Flood risk No data
- FEMA flood zone
- —
- Chance of flooding over 30 yrs
- —
- Est. flood insurance / yr
- —
Fire risk No data
- Est. fire insurance / yr
- —
Heat risk No data
- Hot days now (above threshold)
- —
- Hot days in 30 yrs
- —
Wind risk No data
- Chance of severe wind over 30 yrs
- —
Air-quality risk No data
- Unhealthy air days now
- —
- Unhealthy air days in 30 yrs
- —
Risk factors via First Street. Map © Google.
Why this score? — see what drove the B grade
The composite is a weighted blend of 9 inputs, each scored 0–100. Each bar is that input's sub-score; the figure is the points it added to the 100-point composite (weight × sub-score).
- Cash flow +30.0/30.0
- 1% rule +10.0/10.0
- DSCR +10.0/10.0
- ARV discount +7.5/15.0
- Appreciation +5.8/10.0
- Livability +2.7/5.0
- Rent growth +2.5/5.0
- Schools +2.2/10.0
- Condition / age +1.0/5.0
$49,000
🖨 Deal sheet 📄 Offer letter ✓ Due diligence
Listing remarks
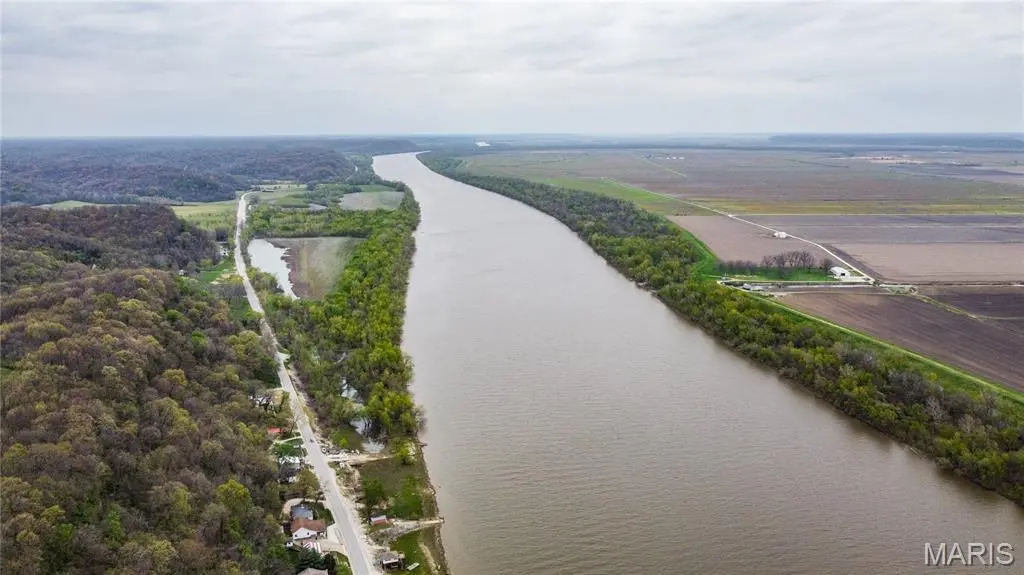
Experience breathtaking panoramic views of the Illinois River from this riverfront property full of potential. Whether you're searching for a full time residence, weekend retreat, or investment property, this property offers a rare chance to create your own waterfront getaway. The home features a tuck-under garage and unbeatable river scenery, while the riverfront portion of the property offers the opportunity to be cleared for a dock, entertainment area, or additional recreational use. With direct river frontage and endless possibilities, this fixer upper is ready for someone with vision to make it their own. Enjoy peaceful mornings, stunning sunsets, and ll that river living has to offer.
Key facts
- Riverfront property
- Panoramic views
- Waterfront getaway
Tags
Property features AI
Finance
- Financial info: Lease not considered
Exterior
- Parking: Attached garage
- Utilities: Public water; Public sewer; Single-phase electric service; Electricity, sewer and water available
- Home design: Residential cabin; One-and-a-half story layout; Approximately 750 above-grade finished living area
- Construction: Construction materials: Other
- Exterior features: Riverfront property with river access and waterfront views; Bluff and sloped lot with gentle slopes, heavy woods and rectangular parcel
Interior
- Bedrooms: 2 bedrooms on the main level
- Bathrooms: 1 full bathroom (main level)
- Heating & cooling: Electric heating; Wall/window air conditioning units
- Interior features: Two total bedrooms (both on the main level); Basement with exterior entry, walk-out access, unfinished storage areas (block/crawl space/concrete/cellar); Six total rooms
Neighborhood map
What this means for you Summary
Snapshot
- This is a 2-bed/1.0-bath single-family listed at $49k. Condition is rated poor.
Deal economics
- At list price, monthly cash flow is $311 ($4k/yr) — positive.
- The deal already cash-flows at list — no discount required.
- Meets the 1% rule at list price ($822 rent vs $49k).
Location & tenants
- Location reads 54/100 on livability (#1,273 in IL) — a working-class tenant base; expect higher turnover. Strengths: cost of living A+, housing A+; Watch: crime D-, amenities F, commute F.
- Calhoun CUSD 40 (rural): math 24% / reading 26% proficiency, ranked #320 of 620 in IL (top 52%) — low school quality limits family demand, transient renter base, plan for 1-2y turnover.
- Zoned schools: Calhoun High School (math 30% / reading 30%, grade F, #179 of 693 statewide, top 27%, 160 students, 0% FRL) — zoned schools average 0% FRL vs 41% district-wide (41 pts lower); this property's tenant base skews higher-income than the district average.
- Market conditions: 6 active listings in the ZIP; 11 units permitted in Calhoun County in 2024 (0 in 5+ unit buildings).
Forward outlook
- In year one you build about $1k of equity ($339 loan paydown + $818 appreciation (1.7% local appreciation)).
- Calhoun County population projected at -34% by 2050 — secular population decline; favor cash flow + early exit over multi-decade hold.
- At projected returns (1.7% appreciation + 3.0% rent growth), your $14k cash investment doubles in ~3 years — after that, you're playing with house money.
Negotiation context
- Only 14 days on market — expect competitive offers; lowballing is unlikely to land.
Risks & watch-outs
- Watch-outs: built in 1900 — expect roof / HVAC / electrical / plumbing capex.
Questions for the listing agent
- Have any recent inspections been done? Can we get a copy of the seller's disclosures and any deferred-maintenance estimates?
- Built in 1900 — when were the roof, HVAC, electrical panel, plumbing, and water heater last replaced?
- Is there a deadline driving the sale (1031 exchange, divorce, estate, relocation)? That informs how much negotiation room exists.
- Schools are F-rated, which usually means shorter tenancies and higher turnover. Who's the typical renter profile here, and what's been the actual vacancy rate?
- Crime grade is D in this area — have there been break-ins, vandalism, or insurance claims at this property in the last 3 years? What carrier currently insures it and at what premium?
- What's the average days-on-market for RENTAL listings here right now (not sales)? A rising rental-DOM trend means longer vacancies and softer asking-rent achievability than the comps imply.
- What's the recent tenant-quality profile in this submarket — average credit score on applications, eviction rate, late-payment / NSF rate, and stable-employment percentage? A property-management company in the area should have these aggregated.
- How much new for-sale + rental construction is in the pipeline within 1–3 miles? Heavy new supply typically softens prices + rents 12–24 months out; constrained supply supports both.
Investment metrics
- 1% rule
- 1.68% ✓
- Cap rate
- 13.90%
- Cash-on-cash
- 27.16%
- DSCR
- 2.21
- GRM
- 5.0
CMA / ARV
- ARV (median comp)
- $49,000
- List price
- $49,000
- Delta
- —
- Verdict
- FAIR
- Comps
- 3 within 1.0 mi
Show comp detail 1 sale within ~0.75 mi
| Address | Dist | Beds/Ba | Sqft | Sold | Price | $/sf | Match |
|---|---|---|---|---|---|---|---|
| 718 N Broadway | 0.00mi | 2/1.0 | 750 (0%) | 0mo | $49,000 | $65 | 100 |
Match score weights: distance 35% · size 25% · config 20% · recency 20%. Top-matched comps best support the ARV.
Projected returns pro-forma
1.67% appreciation · 3.0% rent growth · sell at horizon
- IRR
- 30.7%
- Equity multiple
- 2.63×
- Total profit
- $22,332
- Equity at exit
- $18,457
- IRR
- 32.4%
- Equity multiple
- 5.10×
- Total profit
- $56,224
- Equity at exit
- $25,925
Cash invested: $13,720 (down + closing). Projections, not guarantees.
Landlord ↔ Tenant lean methodology
- Overall (STATE)
- 43 Moderately Tenant-Leaning
- State Illinois
- 43 Moderately Tenant-Leaning · D+7
- County
- — inherits STATE
- City
- — inherits STATE
ZIP-level market 62053
- Home prices YoY
- 1.8%
- Active inventory
- 6
- Price-to-rent
- 5.0×
Monthly cashflow live
- Estimated rent
- $822 medium interval (Pro) →
- Mortgage (P&I)
- −$257
- Tax est. 1.5%
- −$61 /mo · $735/yr
- Insurance
- −$20
- HOA
- −$0
- Vacancy / Maint / Mgmt
- −$173
- Net cashflow
- $311
Break-even live
UW: 25.0% down · 7.5% · 30yr · 1.5% tax · 5.0% vac · 8.0% maint · 8.0% mgmt
Financing live
Cash to close
- Down payment
- $12,250
- Closing costs
- $1,470
- Reserves months
- —
- Total cash needed
- —
Loan-product check · same deal, 3 products live
Conventional
25% down · 7.5% · 30yr
- Down + closing
- —
- Monthly P&I
- —
- Monthly cashflow
- —
- DSCR
- —
- Eligible?
- —
Personal DTI + credit; lowest rate.
DSCR
20% down · 8.5% · 30yr
- Down + closing
- —
- Monthly P&I
- —
- Monthly cashflow
- —
- DSCR
- —
- Eligible?
- —
No personal income docs; deal must DSCR.
Hard money
10% down · 12.0% · 12mo
- Down + closing
- —
- Monthly P&I
- —
- Monthly cashflow
- —
- DSCR
- —
- Eligible?
- —
Short-term bridge; refi at stabilization.
Listing history 1 events
-
2026-05-07$49,000 Active 699-char remark
ⓘ Source: listings_history table (triggers on properties + properties_extension) + one-shot
backfill from property_details.listing_events for pre-trigger history.
Nearby sold comps map
Loading sold comps map…
Walkable amenities ~0.75 mi
Loading nearby amenities…
Taxation est. · year 1
- Rental income
- $9,861
- − Mortgage interest
- −$2,745
- − Property taxes
- −$735
- − Insurance
- −$245
- − Repairs & maintenance
- −$789
- − Management
- −$789
- − Depreciation
- −$1,425
- Taxable income
- $3,133
- Est. tax owed @ 24.0%
- −$752
- After-tax cash flow
- $2,975/yr
For passive investors: Depreciation is non-cash, so a rental often shows a tax loss while cash-flowing — sheltering income. Rental losses are passive: they offset passive income freely, and up to $25,000/yr can offset ordinary (W-2) income if you actively participate and your MAGI is under $100k (phasing out to $0 by $150k); unused losses carry forward. On sale, claimed depreciation is recaptured at up to 25%, and gains may owe capital-gains tax (a 1031 exchange can defer both). Figures are a year-1 estimate at your 24.0% rate — not tax advice; consult a CPA.
Condition & rehab AI · 10 photos
This fixer-upper property requires extensive repairs and maintenance to bring it up to a livable condition. The overgrown vegetation and general disrepair suggest a significant investment is needed to improve its resale and rental value.
Repairs flagged
- Major exterior siding — Peeling paint and overgrown vegetation
- Major interior walls — Visible wear and tear
- Major flooring — Worn carpet
Value-add opportunities
- Both Landscaping and exterior maintenance — Improves curb appeal and overall condition
- Both Interior painting and flooring replacement — Enhances the home's appearance and value
- Both Roof inspection and repair — Ensures structural integrity and protects against water damage
Renovation cost estimate screening
| Repair item | Severity | Est. cost |
|---|---|---|
| exterior siding · Peeling paint and overgrown vegetation | Major | $15,000–50,000 |
| interior walls · Visible wear and tear | Major | $15,000–50,000 |
| flooring · Worn carpet | Major | $15,000–50,000 |
| Total estimated repair cost · 3 items | $45,000–150,000 |
Value-add ROI direction
- Both Landscaping and exterior maintenance — Improves curb appeal and overall condition ↑
- Both Interior painting and flooring replacement — Enhances the home's appearance and value ↑
- Both Roof inspection and repair — Ensures structural integrity and protects against water damage ↑
ⓘ Cost ranges are severity-bucket heuristics (US national rule-of-thumb). Get contractor quotes + a written scope before underwriting a rehab budget.
Schools (NCES district)
- District
- Calhoun CUSD 40
- NCES district ID
- 1718180
- Math proficiency
- 24% ▼ -15.00%
- Reading proficiency
- 26% ▼ -15.00%
- Median HH income
- $49,447
- Composite
- 22.01/100
- National rank
- #8205
- State rank
- #320 of 620 in IL
Livability — Kampsville
- Score
- 54/100
- State rank
- #1273
- US rank
- #23924
Category grades
Schools grade is shown separately in the Schools card above.
Census & demographics
- Census place
- Kampsville, IL
- Population (ZIP)
- 356
Population outlook (Calhoun County) Hauer SSP2
- Today (2025)
- 4,426 people
- By 2030
- 4,129 · -6.7%
- By 2040
- 3,519 · -20.5%
- By 2050
- 2,925 · -33.9%
- By 2075
- 1,864 · -57.9%
- By 2100
- 1,144 · -74.2%
Race, ethnicity, and origin ACS 2023
- Neighborhood character
- Predominantly White (89%)
- Race & ethnicity
- White 89% Two or more races 11% Hispanic / Latino 9%
- Hispanic origin (detail)
- Puerto Rican 9%
- Common ancestry
- Russian 4% Portuguese 4% Slovak 3%
- Foreign-born
- 0%
Political lean MEDSL · Calhoun
- 2024 margin
- Solid R (+55.9) · D 20.9% · R 76.8% · Other 2.3%
- 2008→2024 swing
- -63.4pp toward R · 2008: 7.5pp · 2024: -55.9pp
- All cycles
- 2024: R+55.9 2020: R+49.4 2016: R+38.3 2012: R+14.0 2008: D+7.5
Not yet ingested
- Civics
- —
Market trends
- HPI YoY
- ▲ 1.67%
- Current HPI
- 94.5908
- Rent YoY
- —
- Metro
- —
- State GDP YoY
- ▲ 1.59%
- F500 in state
- 60
Industry mix (Fortune 500 HQ in IL)
| Industry | F500 HQs | Revenue |
|---|---|---|
| Insurance | 4 | $201B |
|
||
| Consumer Goods | 4 | $87B |
|
||
| Industrial Machinery | 3 | $64B |
|
||
| Healthcare | 2 | $55B |
|
||
| Retail / Pharmacy | 1 | $148B |
|
||
| Agriculture / Food | 1 | $86B |
|
||
Price history
3 events — show timeline
- 2026-06-16 Sold (MLS) — MARIS as Distributed by MLS Grid
- 2026-05-21 Pending — MARIS as Distributed by MLS Grid
- 2026-05-07 Listed $49,000 MARIS as Distributed by MLS Grid
Cash-flow waterfall
monthlySold comps — $/sqft
last 12 mo · ≤1 miLoading sold comps…