 Duplex
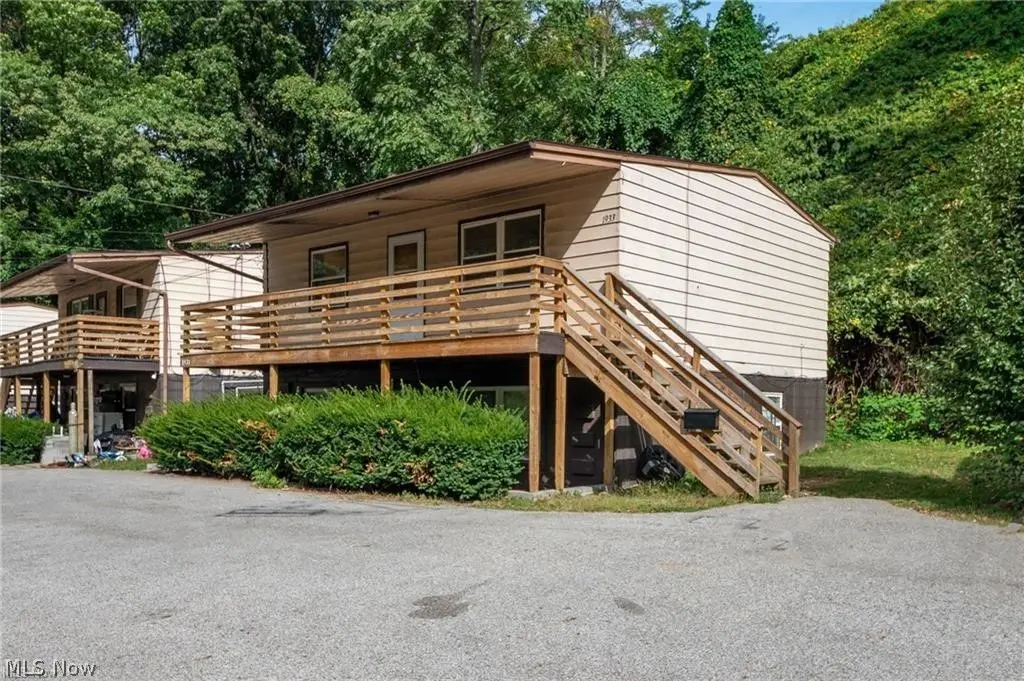
1927 Preston Ave · Akron, OH
Flood risk No data
- FEMA flood zone
- —
- Chance of flooding over 30 yrs
- —
- Est. flood insurance / yr
- —
Fire risk No data
- Est. fire insurance / yr
- —
Heat risk No data
- Hot days now (above threshold)
- —
- Hot days in 30 yrs
- —
Wind risk No data
- Chance of severe wind over 30 yrs
- —
Air-quality risk No data
- Unhealthy air days now
- —
- Unhealthy air days in 30 yrs
- —
Risk factors via First Street. Map © Google.
Why this score? — see what drove the F grade
The composite is a weighted blend of 9 inputs, each scored 0–100. Each bar is that input's sub-score; the figure is the points it added to the 100-point composite (weight × sub-score).
- Cash flow +13.9/30.0
- DSCR +4.2/10.0
- Livability +4.0/5.0
- 1% rule +3.9/10.0
- Rent growth +3.6/5.0
- Condition / age +2.2/5.0
- Schools +2.1/10.0
- ARV discount +0.0/15.0
- Appreciation +0.0/10.0
$224,800
🖨 Deal sheet 📄 Offer letter ✓ Due diligence
Multi-family units
County records classify this as Multi-Family (2-4 Unit). Listing-text estimate: 2 units. confirmed
Listing remarks MLS
Great opportunity to own 8 units in the heart of Goodyear Heights! Can be sold separately, if desired, subject to driveway easements being prepared by seller, four duplexes in total. Each duplex has an apartment upstairs and down, with separate entrances, 2 bedrooms and 1 bath per unit. Nice sized living room w/ laminate flooring in most, kitchen is white and bright with plenty of room for a small table to seat four comfortably. This unit had the block wall outside rebuilt, stairs to second floor unit, a newer roof and 1927 had water heater (2022) and furnace replaced (2021). PLUS the owners added a new driveway too! HURRY, these will go quick!
Key facts
- Cash flowing duplex
- Separate utilities
- Private parking lot
Tags
Property features AI
Finance
- Financial info: Annual tax reported (2025)
Exterior
- Parking: On-site parking
- Utilities: Public water service; Public sewer service
- Home design: 2 stories; Brick construction
- Construction: Built per public records; Asphalt and fiberglass roof
- Exterior features: Public water; Public sewer; Lot recorded at approximately 0.1136 acres
Interior
- Bathrooms: 2 full bathrooms
- Heating & cooling: Central air conditioning; Forced air gas heating
- Interior features: Total of 8 rooms; Includes 2 full bathrooms; One building on the property
Neighborhood map
What this means for you Summary
Snapshot
- This is a 2 × 2-bed/1.0-bath units multifamily listed at $225k. Condition is rated fair.
Deal economics
- At list price, monthly cash flow is $26 ($308/yr) — positive. Per door: $13/mo.
- The deal already cash-flows at list — no discount required.
- To meet the 1% rule (rent ≥ 1% of price), the offer needs to be $200k (11.1% below list).
- Recommended offer: $200k (11.1% below list) — sets the bar for 1% rule.
Location & tenants
- Location reads 81/100 on livability (#104 in OH, #1,591 nationally) — a professional / high-income tenant draw. Strengths: amenities A+, commute A+, cost of living A+; Watch: crime F, employment F.
- Akron City (urban): math 22% / reading 30% proficiency, ranked #602 of 656 in OH (top 92%) — low school quality limits family demand, transient renter base, plan for 1-2y turnover; 66% free/reduced lunch — lower-income household profile, screen leases tightly.
- Market conditions: Rents rising fast (+4.5%/yr); 101 active listings in the ZIP; 9 comparable units currently listed for rent nearby; rentals lingering (median 44d on market — plan ~5-8 weeks vacancy on turnover, expect pricing pressure); 78% of comp listings sitting > 30 days — soft ceiling on asking rent; 1,114 units permitted in Summit County in 2024 (397 in 5+ unit buildings).
- At $1,999/mo this rent would consume 45% of the median local household income ($53k/yr) (locally 1021% of renters already pay >50% of income on rent) — very limited rent-growth headroom before tenants either downsize or default.
Forward outlook
- Local home prices are declining (-3.0%/yr); year-one equity from $2k of loan paydown is wiped out by about $7k of value loss. Plan a longer hold.
- Summit County population projected to shrink 6% by 2050 — rents likely to lag national; underwrite the cash flow, not the appreciation.
Negotiation context
- Only 11 days on market — expect competitive offers; lowballing is unlikely to land.
- 2 sale attempts since 3y ago with the ask held roughly flat each time — persistent listings suggest the price (not the market) is what's stuck; bring a comps-based counter.
- Current owner paid $94k; list at $225k implies a 140% gain — meaningful room to come down on a strong offer.
Questions for the listing agent
- Can we see the unit-by-unit rent roll, current vacancy, and any below-market leases? What's the average tenancy length?
- What capital expenditures (roof, boiler, parking lot, exteriors) have been made in the last 5 years, and what's planned in the next 2?
- Have any recent inspections been done? Can we get a copy of the seller's disclosures and any deferred-maintenance estimates?
- Built in 1963 — when were the roof, HVAC, electrical panel, plumbing, and water heater last replaced?
- Is there a deadline driving the sale (1031 exchange, divorce, estate, relocation)? That informs how much negotiation room exists.
- Crime grade is F in this area — have there been break-ins, vandalism, or insurance claims at this property in the last 3 years? What carrier currently insures it and at what premium?
- The area grade is low — what's the realistic commute time and amenity access for the typical tenant pool here? Any planned neighborhood developments (good or bad) we should know about?
- What's the average days-on-market for RENTAL listings here right now (not sales)? A rising rental-DOM trend means longer vacancies and softer asking-rent achievability than the comps imply.
- What's the recent tenant-quality profile in this submarket — average credit score on applications, eviction rate, late-payment / NSF rate, and stable-employment percentage? A property-management company in the area should have these aggregated.
- How much new apartment / multifamily construction is in the pipeline within 1–3 miles? Heavy new supply (>2% of stock underway) typically softens rents 12–24 months out; light construction supports rent growth.
Investment metrics
- 1% rule
- 0.89% ✗
- Cap rate
- 6.43%
- Cash-on-cash
- 0.49%
- DSCR
- 1.02
- GRM
- 9.4
CMA / ARV
- ARV (on-the-fly)
- $175,680
- Comps found
- 9
Show comp detail 9 sales within ~0.75 mi
| Address | Dist | Beds/Ba | Sqft | Sold | Price | $/sf | Match |
|---|---|---|---|---|---|---|---|
| 1925 Preston Ave | 0.02mi | 4/2.0 | 1,440 (0%) | 11mo | $176,250 | $122 | 90 |
| 1931 Preston Ave | 0.02mi | 4/2.0 | 1,440 (0%) | 11mo | $176,250 | $122 | 90 |
| 1919 Preston Ave | 0.02mi | 4/2.0 | 1,440 (0%) | 11mo | $176,250 | $122 | 90 |
| 1939 Preston Ave | 0.02mi | 4/2.0 | 1,440 (0%) | 11mo | $176,250 | $122 | 89 |
| 280 Cluster Ave | 0.32mi | 4/2.0 | 1,440 (0%) | 1mo | $184,000 | $128 | 84 |
| 1946 Preston Ave | 0.03mi | 4/2.0 | 1,440 (0%) | 20mo | $130,000 | $90 | 82 |
| 1991-1993 Congo St | 0.43mi | 4/2.0 | 1,464 (+2%) | 3mo | $207,000 | $141 | 75 |
| 1738 Flint Ave | 0.47mi | 3/2.0 (-1) | 1,536 (+7%) | 22mo | $125,000 | $81 | 43 |
| 1823-1825 Esther Ave | 0.55mi | 3/2.0 (-1) | 1,288 (-11%) | 20mo | $133,000 | $103 | 35 |
Match score weights: distance 35% · size 25% · config 20% · recency 20%. Top-matched comps best support the ARV.
Projected returns pro-forma
-3.0% appreciation · 4.51% rent growth · sell at horizon
- IRR
- -13.8%
- Equity multiple
- 0.50×
- Total profit
- $-31,680
- Equity at exit
- $33,518
- IRR
- -2.7%
- Equity multiple
- 0.80×
- Total profit
- $-12,313
- Equity at exit
- $19,437
Cash invested: $62,944 (down + closing). Projections, not guarantees.
Landlord ↔ Tenant lean methodology
- Overall (STATE)
- 73 Landlord-Friendly
- State Ohio
- 73 Landlord-Friendly · R+6
- County
- — inherits STATE
- City
- — inherits STATE
ZIP-level market 44305
- Rents YoY
- 4.5%
- Active inventory
- 101
- Price-to-rent
- 18.7×
Monthly cashflow live
- Estimated rent
- $1,999 high interval (Pro) →
- Mortgage (P&I)
- −$1,179
- Tax est. 1.5%
- −$281 /mo · $3,372/yr
- Insurance
- −$94
- HOA
- −$0
- Vacancy / Maint / Mgmt
- −$420
- Net cashflow
- $26
Break-even live
2-unit breakdown (identical units grouped — click to expand)
| Units | Beds | Baths | Est. rent |
|---|---|---|---|
| 2× units | 2 | 1 | $1,998 |
| #1 | 2 | 1 | $999 |
| #2 | 2 | 1 | $999 |
| Total (2 units) | $1,999 | ||
UW: 25.0% down · 7.5% · 30yr · 1.5% tax · 5.0% vac · 8.0% maint · 8.0% mgmt
Financing live
Cash to close
- Down payment
- $56,200
- Closing costs
- $6,744
- Reserves months
- —
- Total cash needed
- —
Loan-product check · same deal, 3 products live
Conventional
25% down · 7.5% · 30yr
- Down + closing
- —
- Monthly P&I
- —
- Monthly cashflow
- —
- DSCR
- —
- Eligible?
- —
Personal DTI + credit; lowest rate.
DSCR
20% down · 8.5% · 30yr
- Down + closing
- —
- Monthly P&I
- —
- Monthly cashflow
- —
- DSCR
- —
- Eligible?
- —
No personal income docs; deal must DSCR.
Hard money
10% down · 12.0% · 12mo
- Down + closing
- —
- Monthly P&I
- —
- Monthly cashflow
- —
- DSCR
- —
- Eligible?
- —
Short-term bridge; refi at stabilization.
Rent comps 9 comps
| Address | Beds | Baths | Sqft | Rent | $/sqft | DOM | Units | Dist |
|---|---|---|---|---|---|---|---|---|
| 248 Malacca St Akron, OH | 3.0 | 2.0 | 1854 | $1,350 | $0.73 | 43d | 1 | 0.34mi |
| 1598 Pilgrim St Akron, OH | 3.0 | 1.0 | 1352 | $1,550 | $1.15 | 43d | 1 | 0.70mi |
| 1395 Goodyear Blvd Akron, OH | 3.0 | 1.5 | 1542 | $1,450 | $0.94 | 43d | 1 | 0.94mi |
| 1438 Newton St Akron, OH | 4.0 | 1.0 | 1429 | $1,375 | $0.96 | 23d | 1 | 0.97mi |
| 1297 Pondview Ave Akron, OH | 4.0 | 1.0 | 1373 | $1,450 | $1.06 | 23d | 1 | 1.04mi |
| 288 Kryder Ave Akron, OH | 4.0 | 1.0 | 1400 | $1,450 | $1.04 | 43d | 1 | 1.13mi |
| 208 Barder Ave Akron, OH | 3.0 | 1.0 | 924 | $1,050 | $1.14 | 43d | 1 | 1.19mi |
| 1318 Arnold Ave Akron, OH | 3.0 | 1.0 | 1056 | $1,450 | $1.37 | 43d | 1 | 1.35mi |
| 589 Eastland Ave Akron, OH | 3.0 | 1.5 | 1345 | $1,300 | $0.97 | 43d | 1 | 1.40mi |
Listing history 11 events
-
2026-06-10status $224,800 Pending 11 DOM
-
2026-06-09days on market $224,800 Active 11 DOM
-
2026-06-08days on market $224,800 Active 10 DOM
-
2026-06-07days on market $224,800 Active 9 DOM
-
2026-06-05days on market $224,800 Active 6 DOM
-
2026-06-03days on market $224,800 Active 5 DOM
-
2026-06-02days on market $224,800 Active 4 DOM
-
2026-06-01days on market $224,800 Active 3 DOM
-
2026-05-31days on market $224,800 Active 2 DOM
-
2026-05-31remarks 687-char remark
-
2026-05-31$224,800 Active 1 DOM
ⓘ Source: listings_history table (triggers on properties + properties_extension) + one-shot
backfill from property_details.listing_events for pre-trigger history.
Nearby sold comps map
Loading sold comps map…
Walkable amenities ~0.75 mi
Loading nearby amenities…
Taxation est. · year 1
- Rental income
- $23,988
- − Mortgage interest
- −$12,592
- − Property taxes
- −$3,372
- − Insurance
- −$1,124
- − Repairs & maintenance
- −$1,919
- − Management
- −$1,919
- − Depreciation
- −$6,540
- Taxable loss
- −$3,478
- Est. tax savings @ 24.0%
- +$835
- After-tax cash flow
- $1,143/yr
For passive investors: Depreciation is non-cash, so a rental often shows a tax loss while cash-flowing — sheltering income. Rental losses are passive: they offset passive income freely, and up to $25,000/yr can offset ordinary (W-2) income if you actively participate and your MAGI is under $100k (phasing out to $0 by $150k); unused losses carry forward. On sale, claimed depreciation is recaptured at up to 25%, and gains may owe capital-gains tax (a 1031 exchange can defer both). Figures are a year-1 estimate at your 24.0% rate — not tax advice; consult a CPA.
Condition & rehab AI · 1 photo
This multi-family property requires moderate repairs and maintenance to improve its condition and appeal. Landscaping and exterior maintenance would significantly enhance its curb appeal and rental value.
Repairs flagged
- Major exterior siding — Significant wear and overgrown vegetation
- Major landscaping — Overgrown vegetation needs trimming
Value-add opportunities
- Both landscaping and exterior maintenance — Improves curb appeal and rental value
- Both paint interior walls/paint — Enhances interior appearance and rental appeal
Renovation cost estimate screening
| Repair item | Severity | Est. cost |
|---|---|---|
| exterior siding · Significant wear and overgrown vegetation | Major | $15,000–50,000 |
| landscaping · Overgrown vegetation needs trimming | Major | $15,000–50,000 |
| Total estimated repair cost · 2 items | $30,000–100,000 |
Value-add ROI direction
- Both landscaping and exterior maintenance — Improves curb appeal and rental value ↑
- Both paint interior walls/paint — Enhances interior appearance and rental appeal ↑
ⓘ Cost ranges are severity-bucket heuristics (US national rule-of-thumb). Get contractor quotes + a written scope before underwriting a rehab budget.
Schools (NCES district)
- District
- Akron City
- NCES district ID
- 3904348
- Math proficiency
- 22% ▼ -17.00%
- Reading proficiency
- 30% ▼ -12.00%
- Median HH income
- $33,811
- Composite
- 21.31/100
- National rank
- #8383
- State rank
- #602 of 656 in OH
Livability — Akron
- Score
- 81/100
- State rank
- #104
- US rank
- #1591
Category grades
Schools grade is shown separately in the Schools card above.
Census & demographics
- Census place
- Akron, OH
- County
- Summit County · 440,783 people
- City population
- 174,375
- Metro
- Akron, OH
- Population (ZIP)
- 21,103
- Household income
- $52,768
- Rent vs Own
- Severe rent burden
- 1021.0
Population outlook (Summit County) Hauer SSP2
- Today (2025)
- 546,583 people
- By 2030
- 544,028 · -0.5%
- By 2040
- 531,363 · -2.8%
- By 2050
- 514,923 · -5.8%
- By 2075
- 481,765 · -11.9%
- By 2100
- 432,265 · -20.9%
Race, ethnicity, and origin ACS 2023
- Neighborhood character
- Diverse neighborhood (Simpson 0.57)
- Race & ethnicity
- White 62% Black 20% Two or more races 12% Asian 5% Hispanic / Latino 2%
- Common ancestry
- Lithuanian 3% Slovak 2% Romanian 2%
- Foreign-born
- 4% · India, Philippines, Canada
- Languages at home
- 94% English-only · Other Asian/Pacific 3% Other Indo-European 1% Spanish 1%
Political lean MEDSL · Summit
- 2024 margin
- Lean D (+7.0) · D 53.0% · R 46.0%
- 2008→2024 swing
- -9.6pp toward R · 2008: 16.6pp · 2024: 7.0pp
- All cycles
- 2024: D+7.0 2020: D+9.6 2016: D+8.2 2012: D+14.8 2008: D+16.6
Not yet ingested
- Civics
- —
Market trends
- HPI YoY
- ▼ -140.39%
- Current HPI
- 190.6223
- Rent YoY
- ▲ 4.51%
- Metro
- Akron, OH
- State GDP YoY
- ▲ 1.98%
- F500 in state
- 48
Industry mix (Fortune 500 HQ in OH)
| Industry | F500 HQs | Revenue |
|---|---|---|
| Insurance | 3 | $145B |
|
||
| Industrial Machinery | 3 | $49B |
|
||
| Financial Services | 3 | $24B |
|
||
| Consumer Goods | 2 | $93B |
|
||
| Aerospace / Defense | 2 | $47B |
|
||
| Utilities | 2 | $33B |
|
||
Price history
+124.9% since first listed5 events — show timeline
- 2026-05-29 Listed $224,800 MLSNOW
- 2023-03-22 Pending — MLSNOW
- 2023-03-21 Sold (MLS) $93,750 MLSNOW
- 2023-01-21 Contingent — MLSNOW
- 2023-01-13 Listed $99,963 MLSNOW
Cash-flow waterfall
monthlySold comps — $/sqft
last 12 mo · ≤1 miLoading sold comps…