 🏷️ Likely Rental
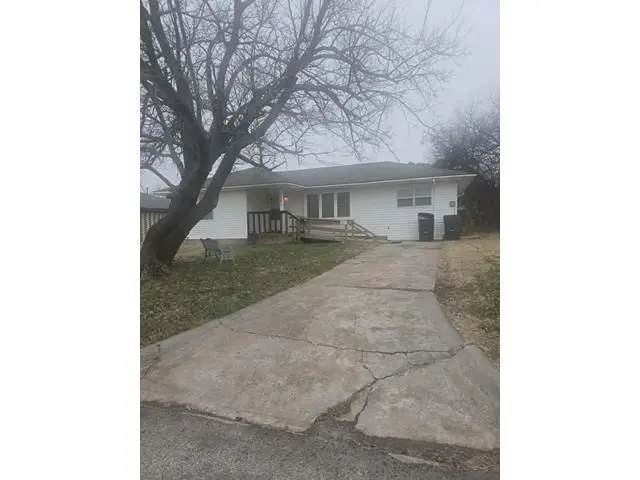
734 NW 32nd St · Lawton, OK
Flood risk 1/10 · Minimal
- FEMA flood zone
- X (unshaded)
- Chance of flooding over 30 yrs
- 0.0%
- Est. flood insurance / yr
- $507 – $1,088
Fire risk 2/10 · Minimal
- Est. fire insurance / yr
- $2,463 – $4,575
Heat risk 7/10 · Major
- Hot days now (above 108°F)
- 7 days/yr
- Hot days in 30 yrs
- 19 days/yr
Wind risk 3/10 · Minor
- Chance of severe wind over 30 yrs
- 5.0%
Air-quality risk 1/10 · Minimal
- Unhealthy air days now
- 0 days/yr
- Unhealthy air days in 30 yrs
- 0 days/yr
Risk factors via First Street. Map © Google.
Why this score? — see what drove the B+ grade
The composite is a weighted blend of 9 inputs, each scored 0–100. Each bar is that input's sub-score; the figure is the points it added to the 100-point composite (weight × sub-score).
- Cash flow +30.0/30.0
- ARV discount +15.0/15.0
- 1% rule +10.0/10.0
- DSCR +10.0/10.0
- Rent growth +3.8/5.0
- Livability +3.2/5.0
- Condition / age +2.5/5.0
- Schools +2.0/10.0
- Appreciation +0.0/10.0
$79,900
🖨 Deal sheet 📄 Offer letter ✓ Due diligence
Listing remarks
This 1300 square foot single family home has 4 bedrooms and 2.0 bathrooms. This home is located at 734 NW 32nd St, Lawton, OK 73505. There is a long term Section 8 tenant in the house. Their lease is done around the end of August. New siding and new gutters has been installed. Please do not bother the occupants
Key facts
- New siding
- New gutters
- 8,259 sq ft lot
Tags
Property features AI
Finance
- Other: Occupied (rented/leased); Previous price decrease; Living area recorded as 1,300 (assessor); Handicap accessible
- Financial info: Not assumable
- HOA & community: No mandatory association dues
Exterior
- Parking: No parking information provided
- Security: No security information provided
- Utilities: No water, sewer, or power details provided
- Home design: Single family residence; One level; Residential property; Accessible approach with ramp
- Construction: Frame construction; Shingle roof; Built status: existing
- Exterior features: Interior lot; Open deck
Interior
- Kitchen: Dishwasher; Refrigerator; Free-stand range
- Bedrooms: 4 bedrooms
- Flooring: No flooring information provided
- Bathrooms: 2 full bathrooms
- Heating & cooling: No heating or cooling information provided
- Interior features: Accessible approach with ramp; Open deck; Combination foundation
- Laundry & utility: No separate laundry data provided
Neighborhood map
What this means for you Summary
Snapshot
- This is a 3-bed/1.0-bath single-family listed at $80k.
Deal economics
- At list price, monthly cash flow is $466 ($6k/yr) — positive.
- The deal already cash-flows at list — no discount required.
- Meets the 1% rule at list price ($1k rent vs $80k).
- Recommended offer: $75k (6.0% below list) — sets the bar for market timing.
- Cap rate 13.3% vs local median 6.1% in Lawton — top-decile yield for the area; either an underpriced asset or a hidden risk that comps aren't pricing in. Stress-test before assuming the spread holds.
Location & tenants
- Location reads 63/100 on livability (#206 in OK) — a middle-class / working-renter tenant base. Strengths: cost of living A+, housing A+; Watch: employment D, crime F, commute F.
- Lawton (urban): math 20% / reading 26% proficiency, ranked #137 of 270 in OK (top 51%) — low school quality limits family demand, transient renter base, plan for 1-2y turnover.
- Zoned schools: Edison Es (math 12% / reading 12%, grade F, #667 of 845 statewide, top 82%, 476 students, 0% FRL); Lawton Hs (math 16% / reading 21%, grade F, #302 of 447 statewide, top 68%, 1,417 students, 0% FRL) — zoned schools average 0% FRL vs 54% district-wide (54 pts lower); this property's tenant base skews higher-income than the district average.
- Market conditions: Rents rising fast (+5.1%/yr); 398 active listings in the ZIP; 133 units permitted in Comanche County in 2024 (0 in 5+ unit buildings).
Forward outlook
- Local home prices are declining (-3.0%/yr); year-one equity from $552 of loan paydown is wiped out by about $2k of value loss. Plan a longer hold.
- Comanche County population projected to shrink 3% by 2050 — rents likely to lag national; underwrite the cash flow, not the appreciation.
- At projected returns (-3.0% appreciation + 5.1% rent growth), your $22k cash investment doubles in ~5 years — after that, you're playing with house money.
Negotiation context
- It's been on market 81 days — a 6% lower offer ($75k) is reasonable based on typical stale-listing flexibility.
- 5 sale attempts since 10y ago; this cycle's ask has dropped $5k (6%) from the opening price — seller is motivated, your offer sets the floor, not the list.
Risks & watch-outs
- Watch-outs: built in 1952 — expect roof / HVAC / electrical / plumbing capex.
- Climate carrying-cost: extreme-heat days projected 7→19/yr by 2055 (HVAC capex compounding) — expect insurance premiums to compound above CPI over the hold.
Questions for the listing agent
- It's been on market 81 days. Have you received any prior offers? Is the seller open to a 6% concession, seller financing, or rate buy-down credit?
- Built in 1952 — when were the roof, HVAC, electrical panel, plumbing, and water heater last replaced?
- Why hasn't it sold? Are there any deal-killer items the seller is aware of (foundation, flood, title, zoning, code violations)?
- Is there a deadline driving the sale (1031 exchange, divorce, estate, relocation)? That informs how much negotiation room exists.
- Schools are D-rated, which usually means shorter tenancies and higher turnover. Who's the typical renter profile here, and what's been the actual vacancy rate?
- Crime grade is F in this area — have there been break-ins, vandalism, or insurance claims at this property in the last 3 years? What carrier currently insures it and at what premium?
- What's the average days-on-market for RENTAL listings here right now (not sales)? A rising rental-DOM trend means longer vacancies and softer asking-rent achievability than the comps imply.
- What's the recent tenant-quality profile in this submarket — average credit score on applications, eviction rate, late-payment / NSF rate, and stable-employment percentage? A property-management company in the area should have these aggregated.
- How much new for-sale + rental construction is in the pipeline within 1–3 miles? Heavy new supply typically softens prices + rents 12–24 months out; constrained supply supports both.
Investment metrics
- 1% rule
- 1.58% ✓
- Cap rate
- 13.29%
- Cash-on-cash
- 25.00%
- DSCR
- 2.11
- GRM
- 5.3
CMA / ARV
- ARV (on-the-fly)
- $135,200
- Comps found
- 12
Show comp detail 12 sales within ~0.75 mi
| Address | Dist | Beds/Ba | Sqft | Sold | Price | $/sf | Match |
|---|---|---|---|---|---|---|---|
| 3201 NW Ferris Ave | 0.21mi | 3/2.0 | 1,300 (0%) | 2mo | $150,000 | $115 | 84 |
| 809 NW 33rd St | 0.12mi | 3/2.0 | 1,200 (-8%) | 2mo | $140,000 | $117 | 76 |
| 1615 NW 25th St | 0.50mi | 3/1.0 | 1,300 (0%) | 4mo | $90,000 | $69 | 74 |
| 3140 NW Kinyon Ave | 0.15mi | 3/2.0 | 1,200 (-8%) | 3mo | $129,900 | $108 | 74 |
| 3128 NW Kinyon | 0.10mi | 2/1.0 (-1) | 1,200 (-8%) | 8mo | $112,500 | $94 | 71 |
| 1635 NW 26th St | 0.58mi | 3/1.0 | 1,300 (0%) | 4mo | $68,272 | $53 | 69 |
| 1415 NW 23rd St | 0.53mi | 4/1.5 (+1) | 1,300 (0%) | 2mo | $41,500 | $32 | 67 |
| 1625 NW 27th St | 0.50mi | 3/1.5 | 1,200 (-8%) | 9mo | $125,000 | $104 | 55 |
| 3801 NW Meadowbrook Dr | 0.51mi | 3/2.0 | 1,200 (-8%) | 8mo | $140,000 | $117 | 52 |
| 2312 NW Cheyenne Ave | 0.64mi | 3/2.0 | 1,400 (+8%) | 4mo | $95,000 | $68 | 50 |
| 3822 NW Meadowbrook Dr | 0.64mi | 4/1.5 (+1) | 1,400 (+8%) | 3mo | $170,000 | $121 | 48 |
| 3802 NW Columbia Ave | 0.68mi | 4/2.0 (+1) | 1,400 (+8%) | 5mo | $140,000 | $100 | 42 |
Match score weights: distance 35% · size 25% · config 20% · recency 20%. Top-matched comps best support the ARV.
Projected returns pro-forma
-3.0% appreciation · 5.14% rent growth · sell at horizon
- IRR
- 20.8%
- Equity multiple
- 1.87×
- Total profit
- $19,531
- Equity at exit
- $11,913
- IRR
- 30.4%
- Equity multiple
- 4.00×
- Total profit
- $67,187
- Equity at exit
- $6,908
Cash invested: $22,372 (down + closing). Projections, not guarantees.
Landlord ↔ Tenant lean methodology
- Overall (STATE)
- 83 Strongly Landlord-Friendly
- State Oklahoma
- 83 Strongly Landlord-Friendly · R+20
- County
- — inherits STATE
- City
- — inherits STATE
ZIP-level market 73505
- Rents YoY
- 5.1%
- Active inventory
- 398
- Price-to-rent
- 5.3×
Monthly cashflow live
- Estimated rent
- $1,264 medium interval (Pro) →
- Mortgage (P&I)
- −$419
- Tax from tax record
- −$80 /mo · $964/yr
- Insurance
- −$33
- HOA
- −$0
- Vacancy / Maint / Mgmt
- −$266
- Net cashflow
- $466
Break-even live
UW: 25.0% down · 7.5% · 30yr · 1.5% tax · 5.0% vac · 8.0% maint · 8.0% mgmt
Financing live
Cash to close
- Down payment
- $19,975
- Closing costs
- $2,397
- Reserves months
- —
- Total cash needed
- —
Loan-product check · same deal, 3 products live
Conventional
25% down · 7.5% · 30yr
- Down + closing
- —
- Monthly P&I
- —
- Monthly cashflow
- —
- DSCR
- —
- Eligible?
- —
Personal DTI + credit; lowest rate.
DSCR
20% down · 8.5% · 30yr
- Down + closing
- —
- Monthly P&I
- —
- Monthly cashflow
- —
- DSCR
- —
- Eligible?
- —
No personal income docs; deal must DSCR.
Hard money
10% down · 12.0% · 12mo
- Down + closing
- —
- Monthly P&I
- —
- Monthly cashflow
- —
- DSCR
- —
- Eligible?
- —
Short-term bridge; refi at stabilization.
Listing history 34 events
-
2026-06-19days on market $79,900 Active 81 DOM
-
2026-06-18days on market $79,900 Active 80 DOM
-
2026-06-17days on market $79,900 Active 79 DOM
-
2026-06-16days on market $79,900 Active 78 DOM
-
2026-06-15days on market $79,900 Active 77 DOM
-
2026-06-14days on market $79,900 Active 75 DOM
-
2026-06-13days on market $79,900 Active 74 DOM
-
2026-06-10days on market $79,900 Active 72 DOM
-
2026-06-09days on market $79,900 Active 71 DOM
-
2026-06-08days on market $79,900 Active 70 DOM
-
2026-06-07days on market $79,900 Active 69 DOM
-
2026-06-05days on market $79,900 Active 66 DOM
-
2026-06-03days on market $79,900 Active 65 DOM
-
2026-06-02days on market $79,900 Active 64 DOM
-
2026-06-01days on market $79,900 Active 63 DOM
-
2026-05-31days on market $79,900 Active 62 DOM
-
2026-05-30days on market $79,900 Active 61 DOM
-
2026-04-28price $79,900
-
2026-03-30$84,900 Active
-
2026-03-29historical
-
2026-03-05price $84,500
-
2026-01-14price $89,900
-
2025-12-10$99,900 Active
-
2025-03-11price $135,000
-
2024-10-01$256,250 Active
-
2024-09-25historical
-
2024-08-19price $114,500
-
2024-06-24$124,500 Active
-
2023-07-28historical
-
2022-08-08soldstatus $224,000
-
2016-05-27soldstatus $17,400
-
2016-04-20$20,900
-
2007-02-08soldstatus $96,000
-
2003-04-24soldstatus $56,000
ⓘ Source: listings_history table (triggers on properties + properties_extension) + one-shot
backfill from property_details.listing_events for pre-trigger history.
Tax reassessment forecast OK · Resets to sale price
- Current annual tax
- $964 · $80/mo
- Projected year-2 tax
- $964 · $80/mo
- Expected delta
- $0/yr ($0/mo · 0.0%)
ⓘ Screening estimate from a state-policy table — verify with the county assessor before closing.
Climate risk First Street
- Flood 1/10 Low FEMA zone X (unshaded) · 0% chance over 30 yrs
- Wildfire 2/10 Low
- Heat 7/10 Severe 7 d/yr ≥108°F today · 19 d/yr by 30 yrs out
- Wind 3/10 Moderate 5% chance of damaging wind over 30 yrs
- Air quality 1/10 Low 0 unhealthy d/yr today · 0 by 30 yrs out
Nearby sold comps map
Loading sold comps map…
Walkable amenities ~0.75 mi
Loading nearby amenities…
Taxation est. · year 1
- Rental income
- $15,172
- − Mortgage interest
- −$4,476
- − Property taxes
- −$964
- − Insurance
- −$400
- − Repairs & maintenance
- −$1,214
- − Management
- −$1,214
- − Depreciation
- −$2,324
- Taxable income
- $4,581
- Est. tax owed @ 24.0%
- −$1,099
- After-tax cash flow
- $4,495/yr
For passive investors: Depreciation is non-cash, so a rental often shows a tax loss while cash-flowing — sheltering income. Rental losses are passive: they offset passive income freely, and up to $25,000/yr can offset ordinary (W-2) income if you actively participate and your MAGI is under $100k (phasing out to $0 by $150k); unused losses carry forward. On sale, claimed depreciation is recaptured at up to 25%, and gains may owe capital-gains tax (a 1031 exchange can defer both). Figures are a year-1 estimate at your 24.0% rate — not tax advice; consult a CPA.
Schools (NCES district)
- District
- Lawton
- NCES district ID
- 4017250
- Math proficiency
- 20% ▼ -12.00%
- Reading proficiency
- 26% ▼ -9.00%
- Median HH income
- $42,618
- Composite
- 19.68/100
- National rank
- #8732
- State rank
- #137 of 270 in OK
Livability — Lawton
- Score
- 63/100
- State rank
- #206
- US rank
- #15131
Category grades
Schools grade is shown separately in the Schools card above.
Census & demographics
- Census place
- Lawton, OK
- County
- Comanche County · 96,361 people
- City population
- 89,233
- Metro
- Lawton, OK
- Population (ZIP)
- 47,790
- Household income
- $58,272
- Rent vs Own
- Severe rent burden
- 1986.0
Population outlook (Comanche County) Hauer SSP2
- Today (2025)
- 124,518 people
- By 2030
- 124,231 · -0.2%
- By 2040
- 122,193 · -1.9%
- By 2050
- 120,368 · -3.3%
- By 2075
- 120,492 · -3.2%
- By 2100
- 123,113 · -1.1%
Race, ethnicity, and origin ACS 2023
- Neighborhood character
- Diverse neighborhood (Simpson 0.70)
- Race & ethnicity
- White 50% Black 17% Two or more races 16% Hispanic / Latino 16% Native American 4% Asian 3%
- Hispanic origin (detail)
- Mexican 11% Puerto Rican 2%
- Common ancestry
- Lithuanian 2% Slovak 2% Romanian 1%
- Foreign-born
- 6% · Canada, South Korea
- Languages at home
- 88% English-only · Spanish 6% German/W. Germanic 2% Korean 1%
Political lean MEDSL · Comanche
- 2024 margin
- Strong R (+23.3) · D 37.4% · R 60.7% · Other 1.9%
- 2008→2024 swing
- -5.8pp toward R · 2008: -17.5pp · 2024: -23.3pp
- All cycles
- 2024: R+23.3 2020: R+20.1 2016: R+23.7 2012: R+17.0 2008: R+17.5
Not yet ingested
- Civics
- —
Market trends
- HPI YoY
- ▼ -134.88%
- Current HPI
- 169.4524
- Rent YoY
- ▲ 5.14%
- Metro
- Lawton, OK
- State GDP YoY
- ▲ 1.55%
- F500 in state
- 6
Industry mix (Fortune 500 HQ in OK)
| Industry | F500 HQs | Revenue |
|---|---|---|
| Energy | 3 | $48B |
|
||
Price history
+42.7% since first listed17 events — show timeline
- 2026-04-28 Price Changed $79,900 MLSOK
- 2026-03-30 Listed $84,900 MLSOK
- 2026-03-29 Listing Removed — MLSOK
- 2026-03-05 Price Changed $84,500 MLSOK
- 2026-01-14 Price Changed $89,900 MLSOK
- 2025-12-10 Listed $99,900 MLSOK
- 2025-03-11 Price Changed $135,000 LBRMLS
- 2024-10-01 Listed $256,250 LBRMLS
- 2024-09-25 Listing Removed — MLSOK
- 2024-08-19 Price Changed $114,500 MLSOK
- 2024-06-24 Listed $124,500 MLSOK
- 2023-07-28 Rental Removed — RENTEC
- 2022-08-08 Sold (Public Records) $224,000 Public Records
- 2016-05-27 Sold (MLS) $17,400 LBRMLS
- 2016-04-20 Listed $20,900 LBRMLS
- 2007-02-08 Sold (Public Records) $96,000 Public Records
- 2003-04-24 Sold (Public Records) $56,000 Public Records
Property tax history
+1.3%/yrLatest (2025): $964 · +4.4% YoY. Source: county tax records.
Cash-flow waterfall
monthlySold comps — $/sqft
last 12 mo · ≤1 miLoading sold comps…