13 Juniper Ests · Sequim, WA
Flood risk No data
- FEMA flood zone
- —
- Chance of flooding over 30 yrs
- —
- Est. flood insurance / yr
- —
Fire risk No data
- Est. fire insurance / yr
- —
Heat risk No data
- Hot days now (above threshold)
- —
- Hot days in 30 yrs
- —
Wind risk No data
- Chance of severe wind over 30 yrs
- —
Air-quality risk No data
- Unhealthy air days now
- —
- Unhealthy air days in 30 yrs
- —
Risk factors via First Street. Map © Google.
Why this score? — see what drove the B grade
The composite is a weighted blend of 9 inputs, each scored 0–100. Each bar is that input's sub-score; the figure is the points it added to the 100-point composite (weight × sub-score).
- Cash flow +30.0/30.0
- 1% rule +10.0/10.0
- DSCR +10.0/10.0
- ARV discount +7.5/15.0
- Schools +5.3/10.0
- Livability +3.5/5.0
- Rent growth +2.5/5.0
- Condition / age +2.5/5.0
- Appreciation +0.0/10.0
$84,950
🖨 Deal sheet 📄 Offer letter ✓ Due diligence
Listing remarks
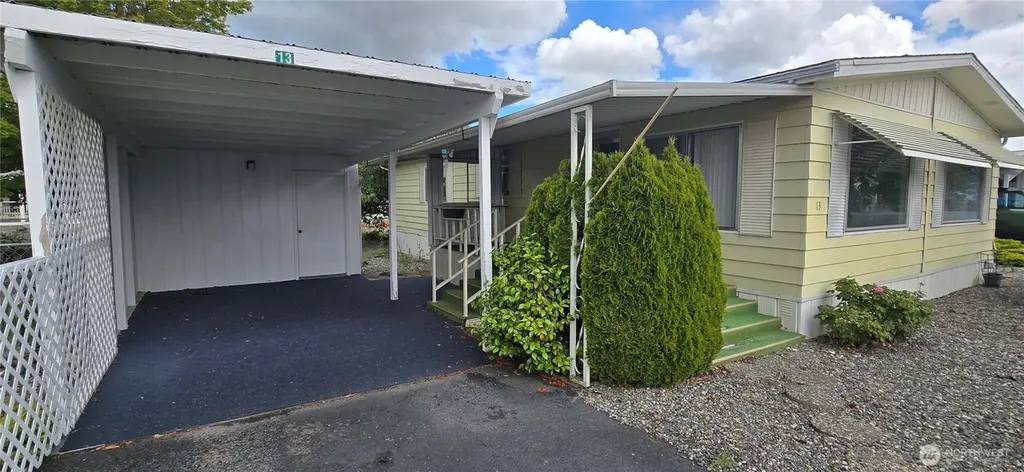
Welcome to this charming home in Juniper Mobile Estates, a 62+ community offering comfortable living, peek-a-boo mountain views, and a convenient location close to everyday amenities. Located toward the back of the park, this property offers added privacy, low-maintenance landscaping, and a fenced backyard. The covered deck provides a wonderful space for outdoor relaxation and entertaining. Conveniently located near shopping, dining, healthcare services, and other local amenities, this home offers comfort, convenience, and affordability in a desirable setting.
Key facts
- Covered deck
- Added privacy
- Convenient location
Tags
Property features AI
Finance
- Other: Bus line nearby
- Financial info: Listing terms: Cash; Land lease payment applies
- HOA & community: Located in Juniper Mobile Estates (park approved for sale); Approximately 58 homes in the park; Park allows cats and dogs; Senior community designation
Exterior
- Parking: Carport (storage located in carport)
- Utilities: Public water (City of Sequim); Public sewer (City of Sequim); Electric service (PUD)
- Home design: Manufactured double-wide home; One story; Faces south; Mobile home remains on site
- Construction: Metal/vinyl siding; Metal skirting; Composition roof; Tie-down foundation; Manufactured after 6/15/1976 (PARAMT MA0239AB model)
- Exterior features: Awnings; Landscaped yard; Patio/porch/deck; Paved lot
Interior
- Kitchen: Dishwasher; Garbage disposal; Refrigerator; Stove/Range
- Bedrooms: 2 bedrooms
- Flooring: Vinyl flooring; Carpet
- Bathrooms: 2 full bathrooms; 1 bathtub, 2 showers
- Heating & cooling: Ductless heat pump; Has heating and cooling
- Interior features: Electric water heater (located at back of home); Water heater included
- Laundry & utility: Washer; Dryer
Neighborhood map
What this means for you Summary
Snapshot
- This is a 3-bed/2.0-bath manufactured listed at $85k.
Deal economics
- At list price, monthly cash flow is $1k ($17k/yr) — positive.
- The deal already cash-flows at list — no discount required.
- Meets the 1% rule at list price ($2k rent vs $85k).
- Cap rate 26.3% vs local median 3.1% in Sequim — top-decile yield for the area; either an underpriced asset or a hidden risk that comps aren't pricing in. Stress-test before assuming the spread holds.
Location & tenants
- Location reads 70/100 on livability (#245 in WA) — a middle-class / working-renter tenant base. Strengths: health & safety A+, crime B, cost of living B; Watch: employment D, amenities D-, commute F.
- Sequim School District (town): math 55% / reading 66% proficiency, ranked #64 of 291 in WA (top 22%) — acceptable for families but not a draw, mixed tenant base, ~2y average lease.
- Market conditions: 605 active listings in the ZIP; 4 comparable units currently listed for rent nearby; rentals lingering (median 44d on market — plan ~5-8 weeks vacancy on turnover, expect pricing pressure); 100% of comp listings sitting > 30 days — soft ceiling on asking rent; 166 units permitted in Clallam County in 2024 (0 in 5+ unit buildings).
- This rent runs 40% of the median local income ($74k/yr) — at the standard rent-burdened threshold; future hikes will face affordability resistance.
Forward outlook
- Local home prices are declining (-3.0%/yr); year-one equity from $588 of loan paydown is wiped out by about $3k of value loss. Plan a longer hold.
- Clallam County population projected at +5% by 2050 — modest demand growth; plan on rents tracking national, not racing it.
- At projected returns (-3.0% appreciation + 3.0% rent growth), your $24k cash investment doubles in ~2 years — after that, you're playing with house money.
Negotiation context
- Only 10 days on market — expect competitive offers; lowballing is unlikely to land.
Questions for the listing agent
- Built in 1976 — when were the roof, HVAC, electrical panel, plumbing, and water heater last replaced?
- Is there a deadline driving the sale (1031 exchange, divorce, estate, relocation)? That informs how much negotiation room exists.
- Schools are B-rated — typically a magnet for longer-tenancy family renters. What's the average tenant stay here, and is there a school-zone premium baked into asking?
- What's the average days-on-market for RENTAL listings here right now (not sales)? A rising rental-DOM trend means longer vacancies and softer asking-rent achievability than the comps imply.
- What's the recent tenant-quality profile in this submarket — average credit score on applications, eviction rate, late-payment / NSF rate, and stable-employment percentage? A property-management company in the area should have these aggregated.
- How much new for-sale + rental construction is in the pipeline within 1–3 miles? Heavy new supply typically softens prices + rents 12–24 months out; constrained supply supports both.
Investment metrics
- 1% rule
- 2.93% ✓
- Cap rate
- 26.33%
- Cash-on-cash
- 71.58%
- DSCR
- 4.18
- GRM
- 2.8
CMA / ARV
- ARV (on-the-fly)
- $191,232
- Comps found
- 12
Show comp detail 12 sales within ~0.75 mi
| Address | Dist | Beds/Ba | Sqft | Sold | Price | $/sf | Match |
|---|---|---|---|---|---|---|---|
| 50 Juniper Mobile Ests #50 | 0.03mi | 2/2.0 (-1) | 1,152 (0%) | 4mo | $80,000 | $69 | 90 |
| 50 Juniper Mobile Ests | 0.11mi | 2/2.0 (-1) | 1,152 (0%) | 4mo | $80,000 | $69 | 87 |
| 610 W Spruce #124 | 0.26mi | 2/2.0 (-1) | 1,152 (0%) | 9mo | $66,000 | $57 | 76 |
| 325 N 5th Ave #45 | 0.32mi | 3/2.0 | 1,171 (+2%) | 10mo | $147,450 | $126 | 74 |
| 325 N 5th Ave #40 Ave | 0.32mi | 2/2.0 (-1) | 1,056 (-8%) | 2mo | $90,773 | $86 | 64 |
| 642 N 7th Ave | 0.48mi | 2/2.0 (-1) | 1,090 (-5%) | 3mo | $140,000 | $128 | 61 |
| 621 N 7th Ave | 0.40mi | 2/2.0 (-1) | 1,056 (-8%) | 6mo | $215,000 | $204 | 57 |
| 618 N 7th Ave | 0.42mi | 2/1.5 (-1) | 1,188 (+3%) | 15mo | $199,000 | $168 | 56 |
| 325 N Fifth Ave #46 | 0.32mi | 2/2.0 (-1) | 1,250 (+8%) | 12mo | $208,000 | $166 | 55 |
| 713 W Heritage Loop | 0.43mi | 2/2.0 (-1) | 1,269 (+10%) | 8mo | $259,000 | $204 | 51 |
| 545 N 7th Ave | 0.37mi | 2/2.0 (-1) | 1,268 (+10%) | 14mo | $242,500 | $191 | 50 |
| 634 N 7th Ave | 0.45mi | 2/2.0 (-1) | 1,028 (-11%) | 11mo | $194,000 | $189 | 47 |
Match score weights: distance 35% · size 25% · config 20% · recency 20%. Top-matched comps best support the ARV.
Projected returns pro-forma
-3.0% appreciation · 3.0% rent growth · sell at horizon
- IRR
- 71.2%
- Equity multiple
- 4.22×
- Total profit
- $76,610
- Equity at exit
- $12,666
- IRR
- 75.2%
- Equity multiple
- 8.70×
- Total profit
- $183,117
- Equity at exit
- $7,345
Cash invested: $23,786 (down + closing). Projections, not guarantees.
Landlord ↔ Tenant lean methodology
- Overall (STATE)
- 28 Tenant-Leaning
- State Washington
- 28 Tenant-Leaning · D+8
- County
- — inherits STATE
- City
- — inherits STATE
ZIP-level market 98382
- Active inventory
- 605
- Price-to-rent
- 2.8×
Monthly cashflow live
- Estimated rent
- $2,486 medium interval (Pro) →
- Mortgage (P&I)
- −$445
- Tax from tax record
- −$64 /mo · $772/yr
- Insurance
- −$35
- HOA
- −$0
- Vacancy / Maint / Mgmt
- −$522
- Net cashflow
- $1,419
Break-even live
UW: 25.0% down · 7.5% · 30yr · 1.5% tax · 5.0% vac · 8.0% maint · 8.0% mgmt
Financing live
Cash to close
- Down payment
- $21,238
- Closing costs
- $2,548
- Reserves months
- —
- Total cash needed
- —
Loan-product check · same deal, 3 products live
Conventional
25% down · 7.5% · 30yr
- Down + closing
- —
- Monthly P&I
- —
- Monthly cashflow
- —
- DSCR
- —
- Eligible?
- —
Personal DTI + credit; lowest rate.
DSCR
20% down · 8.5% · 30yr
- Down + closing
- —
- Monthly P&I
- —
- Monthly cashflow
- —
- DSCR
- —
- Eligible?
- —
No personal income docs; deal must DSCR.
Hard money
10% down · 12.0% · 12mo
- Down + closing
- —
- Monthly P&I
- —
- Monthly cashflow
- —
- DSCR
- —
- Eligible?
- —
Short-term bridge; refi at stabilization.
Rent comps 4 comps
| Address | Beds | Baths | Sqft | Rent | $/sqft | DOM | Units | Dist |
|---|---|---|---|---|---|---|---|---|
| 850 Tommy Ct Sequim, WA | 3.0 | 2.0 | 1350 | $2,300 | $1.70 | 43d | 1 | 0.19mi |
| 246 W Maple St Sequim, WA | 3.0 | 2.0 | 1200 | $2,300 | $1.92 | 43d | 1 | 0.69mi |
| 1045 S 3rd Ave Unit 33 Sequim, WA | 2.0 | 1.5 | 956 | $2,100 | $2.20 | 43d | 1 | 0.89mi |
| 522 W Evergreen Farm Way Sequim, WA | 2.0 | 2.0 | 1336 | $2,450 | $1.83 | 43d | 1 | 0.99mi |
Listing history 8 events
-
2026-06-19days on market $84,950 Active 10 DOM
-
2026-06-18days on market $84,950 Active 9 DOM
-
2026-06-17days on market $84,950 Active 8 DOM
-
2026-06-16days on market $84,950 Active 7 DOM
-
2026-06-15days on market $84,950 Active 6 DOM
-
2026-06-14days on market $84,950 Active 4 DOM
-
2026-06-12remarks 566-char remark
-
2026-06-12$84,950 Active 3 DOM
ⓘ Source: listings_history table (triggers on properties + properties_extension) + one-shot
backfill from property_details.listing_events for pre-trigger history.
Tax reassessment forecast WA · Resets to sale price
- Current annual tax
- $772 · $64/mo
- Projected year-2 tax
- $833 · $69/mo
- Expected delta
- +$60/yr (+$5/mo · 7.8%)
ⓘ Screening estimate from a state-policy table — verify with the county assessor before closing.
Nearby sold comps map
Loading sold comps map…
Walkable amenities ~0.75 mi
Loading nearby amenities…
Taxation est. · year 1
- Rental income
- $29,834
- − Mortgage interest
- −$4,759
- − Property taxes
- −$772
- − Insurance
- −$425
- − Repairs & maintenance
- −$2,387
- − Management
- −$2,387
- − Depreciation
- −$2,471
- Taxable income
- $16,633
- Est. tax owed @ 24.0%
- −$3,992
- After-tax cash flow
- $13,034/yr
For passive investors: Depreciation is non-cash, so a rental often shows a tax loss while cash-flowing — sheltering income. Rental losses are passive: they offset passive income freely, and up to $25,000/yr can offset ordinary (W-2) income if you actively participate and your MAGI is under $100k (phasing out to $0 by $150k); unused losses carry forward. On sale, claimed depreciation is recaptured at up to 25%, and gains may owe capital-gains tax (a 1031 exchange can defer both). Figures are a year-1 estimate at your 24.0% rate — not tax advice; consult a CPA.
Schools (NCES district)
- District
- Sequim School District
- NCES district ID
- 5307830
- Math proficiency
- 55% ▼ -1.00%
- Reading proficiency
- 66% ▲ 1.00%
- Median HH income
- $46,969
- Composite
- 52.77/100
- National rank
- #3312
- State rank
- #64 of 291 in WA
Livability — Sequim
- Score
- 70/100
- State rank
- #245
- US rank
- #7845
Category grades
Schools grade is shown separately in the Schools card above.
Census & demographics
- Census place
- Sequim, WA
- County
- Clallam County · 31,052 people
- City population
- 31,052
- Metro
- Port Angeles, WA
- Population (ZIP)
- 31,052
- Household income
- $74,189
- Rent vs Own
- Severe rent burden
- 666.0
Population outlook (Clallam County) Hauer SSP2
- Today (2025)
- 76,817 people
- By 2030
- 78,177 · +1.8%
- By 2040
- 79,795 · +3.9%
- By 2050
- 80,890 · +5.3%
- By 2075
- 83,933 · +9.3%
- By 2100
- 82,141 · +6.9%
Race, ethnicity, and origin ACS 2023
- Neighborhood character
- Predominantly White (85%)
- Race & ethnicity
- White 85% Two or more races 7% Hispanic / Latino 4% Asian 2%
- Common ancestry
- Portuguese 5% Slovak 5% Italian 4%
- Foreign-born
- 6% · Canada
- Languages at home
- 95% English-only · Spanish 2% German/W. Germanic 1% Other Indo-European 1%
Political lean MEDSL · Clallam
- 2024 margin
- Lean D (+7.9) · D 52.6% · R 44.7% · Other 2.7%
- 2008→2024 swing
- +4.6pp toward D · 2008: 3.3pp · 2024: 7.9pp
- All cycles
- 2024: D+7.9 2020: D+3.4 2016: R+1.6 2012: D+0.4 2008: D+3.3
Not yet ingested
- Civics
- —
Market trends
- HPI YoY
- ▼ -225.89%
- Current HPI
- 181.4372
- Rent YoY
- —
- Metro
- Port Angeles, WA
- State GDP YoY
- ▲ 4.65%
- F500 in state
- 22
Industry mix (Fortune 500 HQ in WA)
| Industry | F500 HQs | Revenue |
|---|---|---|
| Retail | 2 | $269B |
|
||
| Technology / Retail | 1 | $638B |
|
||
| Technology | 1 | $245B |
|
||
| Telecommunications | 1 | $38B |
|
||
| Food / Beverage | 1 | $36B |
|
||
| Automotive / Trucks | 1 | $34B |
|
||
Price history
1 event — show timeline
- 2026-06-09 Listed $84,950 NWMLS as Distributed by MLS Grid
Property tax history
+8.6%/yrLatest (2026): $772 · +20.3% YoY. Source: county tax records.
Cash-flow waterfall
monthlySold comps — $/sqft
last 12 mo · ≤1 miLoading sold comps…