 Duplex
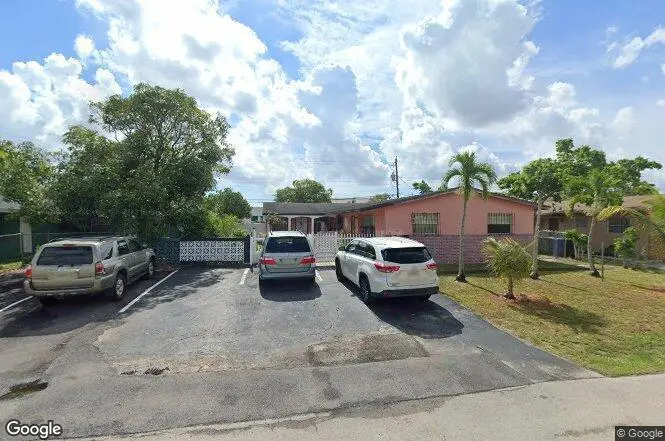
310 SW 27th Ter Unit 1-2 · Fort Lauderdale, FL
Flood risk 1/10 · Minimal
- FEMA flood zone
- X (shaded)
- Chance of flooding over 30 yrs
- 0.0%
- Est. flood insurance / yr
- $507 – $1,088
Fire risk 1/10 · Minimal
- Est. fire insurance / yr
- $947 – $1,759
Heat risk 10/10 · Severe
- Hot days now (above 105°F)
- 7 days/yr
- Hot days in 30 yrs
- 28 days/yr
Wind risk 10/10 · Severe
- Chance of severe wind over 30 yrs
- 99.0%
Air-quality risk 2/10 · Minimal
- Unhealthy air days now
- 2 days/yr
- Unhealthy air days in 30 yrs
- 2 days/yr
Risk factors via First Street. Map © Google.
Why this score? — see what drove the C+ grade
The composite is a weighted blend of 9 inputs, each scored 0–100. Each bar is that input's sub-score; the figure is the points it added to the 100-point composite (weight × sub-score).
- Cash flow +25.8/30.0
- DSCR +8.6/10.0
- ARV discount +7.5/15.0
- 1% rule +7.1/10.0
- Schools +4.1/10.0
- Livability +4.1/5.0
- Rent growth +2.8/5.0
- Condition / age +2.5/5.0
- Appreciation +0.0/10.0
$450,000
🖨 Deal sheet 📄 Offer letter ✓ Due diligence
Multi-family units
County records classify this as Multi-Family (2-4 Unit). Listing-text estimate: 2 units. confirmed
Listing remarks
* * Investor Opportunity - Duplex Gem! * * Don't miss this income-producing duplex with built-in potential! One unit is currently tenant-occupied, providing immediate rental income, while the owner occupies the second unit—perfect for investors or owner-users looking to offset expenses. This property offers flexibility and upside, making it an ideal addition to any portfolio. Well-maintained and full of potential, it's ready for its next owner to maximize returns. Schedule your showing today—this one won't last!
Key facts
- 6,500 sq ft lot
- Built 1964
- Listed 41 days
Property features AI
Finance
- Financial info: 2 total units; Tenant pays electricity; Pets allowed with no restrictions; 2 units in the community
Exterior
- Utilities: Public water; Septic tank sewer; Cable available; Electricity connected; Phone available; Water connected
- Home design: Duplex; Single-story; 1 entry level
- Construction: Concrete block with stucco exterior; Shingle roof; Built using appraiser building area source
- Exterior features: Not waterfront
Interior
- Flooring: Tile
- Heating & cooling: Window/wall heating; Ceiling fan(s); Wall/window cooling units
- Interior features: Tile flooring
Neighborhood map
What this means for you Summary
Snapshot
- This is a 2 × 2-bed/1-bath units multifamily listed at $450k.
Deal economics
- At list price, monthly cash flow is $1k ($13k/yr) — positive. Per door: $545/mo.
- The deal already cash-flows at list — no discount required.
- Meets the 1% rule at list price ($5k rent vs $450k).
- Recommended offer: $436k (3.0% below list) — sets the bar for market timing.
- Cap rate 9.2% vs local median 2.2% in Fort Lauderdale — top-decile yield for the area; either an underpriced asset or a hidden risk that comps aren't pricing in. Stress-test before assuming the spread holds.
Location & tenants
- Location reads 82/100 on livability (#78 in FL, #1,293 nationally) — a professional / high-income tenant draw. Strengths: crime A+, amenities A+, health & safety A+; Watch: cost of living D-.
- Broward (suburban): math 42% / reading 53% proficiency, ranked #46 of 73 in FL (top 63%) — families likely to look elsewhere, expect single-tenant / working-renter base with shorter leases.
- Zoned schools: Westwood Heights Elementary School (math 18% / reading 26%, grade F, #2,080 of 2,144 statewide, top 97%, 522 students, 87% FRL); Parkway Middle School (math 25% / reading 40%, grade F, #443 of 571 statewide, top 78%, 1,198 students, 83% FRL); Stranahan High School (math 18% / reading 36%, grade F, #478 of 667 statewide, top 73%, 1,438 students, 77% FRL) — zoned schools average 82% FRL vs 51% district-wide (31 pts higher); higher-poverty schools than district average — tighter screening recommended.
- Zoned-school proficiency averages 27% at this address vs 48% district-wide (-20 pts) — the specific schools serving this property underperform the Broward average; the district grade overstates school quality for this exact location.
- Market conditions: Rents rising (+1.3%/yr); 412 active listings in the ZIP; 40 comparable units currently listed for rent nearby; rentals at typical pace (median 25d on market — plan ~3-4 weeks tenant-placement turnaround); solid renter incomes; 2,111 units permitted in Broward County in 2024 (1,265 in 5+ unit buildings).
- At $5,423/mo this rent would consume 86% of the median local household income ($76k/yr) (locally 1903% of renters already pay >50% of income on rent) — very limited rent-growth headroom before tenants either downsize or default.
Forward outlook
- Local home prices are declining (-3.0%/yr); year-one equity from $3k of loan paydown is wiped out by about $14k of value loss. Plan a longer hold.
- Broward County population projected at +34% by 2050 — long-run rental-demand tailwind backs the buy-and-hold thesis.
Negotiation context
- It's been on market 41 days — a 3% lower offer ($436k) is reasonable based on typical stale-listing flexibility.
- Current owner paid $74k; list at $450k implies a 508% gain — meaningful room to come down on a strong offer.
Risks & watch-outs
- Climate carrying-cost: severe wind risk, 99% chance of damaging wind over 30y; extreme-heat days projected 7→28/yr by 2055 (HVAC capex compounding) — expect insurance premiums to compound above CPI over the hold.
Questions for the listing agent
- It's been on market 41 days. Have you received any prior offers? Is the seller open to a 3% concession, seller financing, or rate buy-down credit?
- Can we see the unit-by-unit rent roll, current vacancy, and any below-market leases? What's the average tenancy length?
- What capital expenditures (roof, boiler, parking lot, exteriors) have been made in the last 5 years, and what's planned in the next 2?
- Built in 1964 — when were the roof, HVAC, electrical panel, plumbing, and water heater last replaced?
- Is there a deadline driving the sale (1031 exchange, divorce, estate, relocation)? That informs how much negotiation room exists.
- Schools are B-rated — typically a magnet for longer-tenancy family renters. What's the average tenant stay here, and is there a school-zone premium baked into asking?
- What's the average days-on-market for RENTAL listings here right now (not sales)? A rising rental-DOM trend means longer vacancies and softer asking-rent achievability than the comps imply.
- What's the recent tenant-quality profile in this submarket — average credit score on applications, eviction rate, late-payment / NSF rate, and stable-employment percentage? A property-management company in the area should have these aggregated.
- How much new apartment / multifamily construction is in the pipeline within 1–3 miles? Heavy new supply (>2% of stock underway) typically softens rents 12–24 months out; light construction supports rent growth.
Investment metrics
- 1% rule
- 1.21% ✓
- Cap rate
- 9.20%
- Cash-on-cash
- 10.37%
- DSCR
- 1.46
- GRM
- 6.9
CMA / ARV
No comps found within radius.
Projected returns pro-forma
-3.0% appreciation · 1.3% rent growth · sell at horizon
- IRR
- -2.7%
- Equity multiple
- 0.90×
- Total profit
- $-12,547
- Equity at exit
- $67,096
- IRR
- 5.0%
- Equity multiple
- 1.34×
- Total profit
- $42,758
- Equity at exit
- $38,908
Cash invested: $126,000 (down + closing). Projections, not guarantees.
Landlord ↔ Tenant lean methodology
- Overall (STATE)
- 87 Strongly Landlord-Friendly
- State Florida
- 87 Strongly Landlord-Friendly · R+3
- County
- — inherits STATE
- City
- — inherits STATE
ZIP-level market 33312
- Rents YoY
- 1.3%
- Active inventory
- 412
- Price-to-rent
- 13.8×
Monthly cashflow live
- Estimated rent
- $5,423 high interval (Pro) →
- Mortgage (P&I)
- −$2,360
- Tax from tax record
- −$648 /mo · $7,774/yr
- Insurance
- −$188
- HOA
- −$0
- Vacancy / Maint / Mgmt
- −$1,139
- Net cashflow
- $1,089
Break-even live
2-unit breakdown (identical units grouped — click to expand)
| Units | Beds | Baths | Est. rent |
|---|---|---|---|
| 2× units | 2 | 1 | $5,424 |
| #1 | 2 | 1 | $2,712 |
| #2 | 2 | 1 | $2,712 |
| Total (2 units) | $5,423 | ||
UW: 25.0% down · 7.5% · 30yr · 1.5% tax · 5.0% vac · 8.0% maint · 8.0% mgmt
Financing live
Cash to close
- Down payment
- $112,500
- Closing costs
- $13,500
- Reserves months
- —
- Total cash needed
- —
Loan-product check · same deal, 3 products live
Conventional
25% down · 7.5% · 30yr
- Down + closing
- —
- Monthly P&I
- —
- Monthly cashflow
- —
- DSCR
- —
- Eligible?
- —
Personal DTI + credit; lowest rate.
DSCR
20% down · 8.5% · 30yr
- Down + closing
- —
- Monthly P&I
- —
- Monthly cashflow
- —
- DSCR
- —
- Eligible?
- —
No personal income docs; deal must DSCR.
Hard money
10% down · 12.0% · 12mo
- Down + closing
- —
- Monthly P&I
- —
- Monthly cashflow
- —
- DSCR
- —
- Eligible?
- —
Short-term bridge; refi at stabilization.
Rent comps 40 comps
| Address | Beds | Baths | Sqft | Rent | $/sqft | DOM | Units | Dist |
|---|---|---|---|---|---|---|---|---|
| 2771 SW 3rd St Fort Lauderdale, FL | 5.0 | 2.0 | 1474 | $3,875 | $2.63 | 24d | 1 | 0.07mi |
| 2771 SW 3rd St Fort Lauderdale, FL | 5.0 | 2.0 | 1474 | $3,875 | $2.63 | 20d | 1 | 0.07mi |
| 2781 SW 4th St Unit 2781 Fort Lauderdale, FL | 3.0 | 2.0 | 1413 | $3,200 | $2.26 | 22d | 1 | 0.07mi |
| 420 SW 27th Ave Fort Lauderdale, FL | 3.0 | 1.0–2.0 | 1024 | $3,759 | $3.67 | 24d | 1 | 0.15mi |
| 2841 SW 4th Ct Unit 1258737P Fort Lauderdale, FL | 3.0 | 2.0 | 1689 | $4,617 | $2.73 | 5d | 1 | 0.18mi |
| 2836 SW 4th Ct Fort Lauderdale, FL | 3.0 | 2.0 | 1617 | $3,300 | $2.04 | 24d | 1 | 0.21mi |
| 630 SW 28th Dr Fort Lauderdale, FL | 3.0 | 2.0 | 1467 | $3,300 | $2.25 | 24d | 1 | 0.39mi |
| 610 Carolina Ave Unit 2 Fort Lauderdale, FL | 4.0 | 3.0 | 1865 | $2,000 | $1.07 | 15d | 1 | 0.68mi |
| 518 SW 19th Way Fort Lauderdale, FL | 3.0 | 2.5 | 1456 | $3,200 | $2.20 | 24d | 1 | 0.76mi |
| 522 SW 19th Way Unit 522 Fort Lauderdale, FL | 3.0 | 2.5 | 1516 | $3,200 | $2.11 | 24d | 1 | 0.76mi |
| 525 NW 22nd Ave Fort Lauderdale, FL | 5.0 | 2.0 | 1936 | $3,500 | $1.81 | 3d | 1 | 0.82mi |
| 2810 NW 7th St Fort Lauderdale, FL | 4.0 | 2.0 | 1501 | $2,999 | $2.00 | 24d | 1 | 0.84mi |
| 519 NW 21st Ter Fort Lauderdale, FL | 4.0 | 2.0 | 2591 | $3,600 | $1.39 | 8d | 1 | 0.85mi |
| 1733 SW 5th Ct Fort Lauderdale, FL | 3.0 | 2.0 | 1500 | $4,000 | $2.67 | 24d | 1 | 0.87mi |
| 2988 NW 7th Ct Fort Lauderdale, FL | 4.0 | 2.0 | 2547 | $3,200 | $1.26 | 5d | 1 | 0.94mi |
| 427 NW 19th Ave Fort Lauderdale, FL | 4.0 | 2.5 | 1524 | $3,500 | $2.30 | 8d | 1 | 0.95mi |
| 3120 SW 12th Pl Fort Lauderdale, FL | 3.0 | 2.0 | 1532 | $2,950 | $1.93 | 24d | 1 | 0.96mi |
| 3440 NW 4th St Lauderhill, FL | 3.0 | 2.0 | 1525 | $2,900 | $1.90 | 24d | 1 | 0.97mi |
| 483 W Melrose Cir Fort Lauderdale, FL | 3.0 | 2.0 | 1560 | $3,500 | $2.24 | 24d | 1 | 0.98mi |
| 2810 NW 8th Ct Fort Lauderdale, FL | 3.0 | 2.0 | 1435 | $2,850 | $1.99 | 24d | 1 | 0.99mi |
| 3551 SW 1st St Fort Lauderdale, FL | 4.0 | 2.0 | 1720 | $3,150 | $1.83 | 24d | 1 | 0.99mi |
| 1613 SW 5th Ct Fort Lauderdale, FL | 3.0 | 2.0 | 1525 | $8,000 | $5.25 | 24d | 1 | 1.01mi |
| 950 E Dayton Cir Fort Lauderdale, FL | 3.0 | 2.0 | 1521 | $2,699 | $1.77 | 15d | 1 | 1.02mi |
| 180 Penn Way Fort Lauderdale, FL | 5.0 | 3.0 | 1638 | $3,750 | $2.29 | 22d | 1 | 1.09mi |
| 1515 SW 9th St Fort Lauderdale, FL | 4.0 | 2.0 | 1475 | $2,995 | $2.03 | 21d | 1 | 1.12mi |
| 1406 SW 1st St Unit A Fort Lauderdale, FL | 3.0 | 2.0 | 2080 | $2,595 | $1.25 | 3d | 1 | 1.14mi |
| 1600 SW 10th St Fort Lauderdale, FL | 4.0 | 2.0 | 2020 | $5,800 | $2.87 | 24d | 1 | 1.14mi |
| 649 W Evanston Cir Fort Lauderdale, FL | 4.0 | 2.0 | 1576 | $3,315 | $2.10 | 24d | 1 | 1.14mi |
| 3451 NW 6th St Lauderhill, FL | 4.0 | 2.0 | 1700 | $3,000 | $1.76 | 24d | 1 | 1.15mi |
| 2806 NW 9th Ct Fort Lauderdale, FL | 5.0 | 2.0 | 1528 | $3,782 | $2.48 | 24d | 1 | 1.15mi |
| 2810 NW 9th Ct Unit 1 Fort Lauderdale, FL | 5.0 | 2.0 | 1528 | $3,782 | $2.48 | 24d | 1 | 1.16mi |
| 3421 SW 12th Ct Unit A Fort Lauderdale, FL | 3.0 | 1.0 | 1691 | $2,849 | $1.68 | 5d | 1 | 1.17mi |
| 3421 SW 12th Ct Unit A Fort Lauderdale, FL | 3.0 | 1.0 | 1691 | $2,849 | $1.68 | 24d | 1 | 1.17mi |
| 3421 SW 12th Ct Fort Lauderdale, FL | 3.0 | 1.0 | 1500 | $2,850 | $1.90 | 19d | 1 | 1.17mi |
| 836 Pennsylvania Ave Fort Lauderdale, FL | 5.0 | 3.0 | 1837 | $3,300 | $1.80 | 24d | 1 | 1.18mi |
| 410 Pennsylvania Ave Fort Lauderdale, FL | 3.0 | 2.0 | 1928 | $3,600 | $1.87 | 24d | 1 | 1.21mi |
| 1300 SW 34th Ave Unit n/a Fort Lauderdale, FL | 3.0 | 2.0 | 1634 | $3,500 | $2.14 | 24d | 1 | 1.21mi |
| 3138 SW 15th St Fort Lauderdale, FL | 3.0 | 2.0 | 1456 | $9,000 | $6.18 | 8d | 1 | 1.23mi |
| 3138 SW 15th St Fort Lauderdale, FL | 3.0 | 2.0 | 1456 | $9,000 | $6.18 | 24d | 1 | 1.23mi |
| 1213 Tequesta St Fort Lauderdale, FL | 3.0 | 3.0 | 1694 | $3,550 | $2.10 | 21d | 1 | 1.30mi |
Listing history 3 events
-
2026-05-08historical Active Under Contract
-
2026-04-15$450,000 Active
-
1989-01-05soldstatus $74,000
ⓘ Source: listings_history table (triggers on properties + properties_extension) + one-shot
backfill from property_details.listing_events for pre-trigger history.
Tax reassessment forecast FL · Resets to sale price
- Current annual tax
- $7,774 · $648/mo
- Projected year-2 tax
- $7,774 · $648/mo
- Expected delta
- $0/yr ($0/mo · 0.0%)
ⓘ Screening estimate from a state-policy table — verify with the county assessor before closing.
Climate risk First Street
- Flood 1/10 Low FEMA zone X (shaded) · 0% chance over 30 yrs
- Wildfire 1/10 Low
- Heat 10/10 Extreme 7 d/yr ≥105°F today · 28 d/yr by 30 yrs out
- Wind 10/10 Extreme 99% chance of damaging wind over 30 yrs
- Air quality 2/10 Low 2 unhealthy d/yr today · 2 by 30 yrs out
Nearby sold comps map
Loading sold comps map…
Walkable amenities ~0.75 mi
Loading nearby amenities…
Taxation est. · year 1
- Rental income
- $65,076
- − Mortgage interest
- −$25,207
- − Property taxes
- −$7,774
- − Insurance
- −$2,250
- − Repairs & maintenance
- −$5,206
- − Management
- −$5,206
- − Depreciation
- −$13,091
- Taxable income
- $6,342
- Est. tax owed @ 24.0%
- −$1,522
- After-tax cash flow
- $11,546/yr
For passive investors: Depreciation is non-cash, so a rental often shows a tax loss while cash-flowing — sheltering income. Rental losses are passive: they offset passive income freely, and up to $25,000/yr can offset ordinary (W-2) income if you actively participate and your MAGI is under $100k (phasing out to $0 by $150k); unused losses carry forward. On sale, claimed depreciation is recaptured at up to 25%, and gains may owe capital-gains tax (a 1031 exchange can defer both). Figures are a year-1 estimate at your 24.0% rate — not tax advice; consult a CPA.
Schools (NCES district)
- District
- Broward
- NCES district ID
- 1200180
- Math proficiency
- 42% ▼ -18.00%
- Reading proficiency
- 53% ▼ -5.00%
- Median HH income
- $52,139
- Composite
- 40.88/100
- National rank
- #3621
- State rank
- #46 of 73 in FL
Livability — Fort Lauderdale
- Score
- 82/100
- State rank
- #78
- US rank
- #1293
Category grades
Schools grade is shown separately in the Schools card above.
Census & demographics
- Census place
- Fort Lauderdale, FL
- County
- Broward County · 1,963,430 people
- City population
- 235,769
- Metro
- Miami-Fort Lauderdale-Pompano Beach, FL
- Population (ZIP)
- 52,798
- Household income
- $75,952
- Rent vs Own
- Severe rent burden
- 1903.0
Population outlook (Broward County) Hauer SSP2
- Today (2025)
- 2,207,033 people
- By 2030
- 2,360,704 · +7.0%
- By 2040
- 2,661,208 · +20.6%
- By 2050
- 2,946,698 · +33.5%
- By 2075
- 3,602,273 · +63.2%
- By 2100
- 3,970,984 · +79.9%
Race, ethnicity, and origin ACS 2023
- Neighborhood character
- Highly diverse neighborhood (Simpson 0.70)
- Race & ethnicity
- White 34% Hispanic / Latino 32% Black 29% Two or more races 20% Asian 2%
- Hispanic origin (detail)
- Mexican 2% Puerto Rican 5% Cuban 6% Salvadoran 1%
- Common ancestry
- Hispanic 6% Romanian 3% Italian 1%
- Foreign-born
- 33% · Canada, Jamaica, Dominican Republic
- Languages at home
- 59% English-only · Spanish 29% French/Haitian/Cajun 7% Other Indo-European 2%
Political lean MEDSL · Broward
- 2024 margin
- D (+17.0) · D 58.0% · R 41.0%
- 2008→2024 swing
- -17.8pp toward R · 2008: 34.7pp · 2024: 17.0pp
- All cycles
- 2024: D+17.0 2020: D+29.8 2016: D+35.0 2012: D+34.9 2008: D+34.7
Not yet ingested
- Civics
- —
Market trends
- HPI YoY
- ▼ -323.99%
- Current HPI
- 382.6298
- Rent YoY
- ▲ 1.30%
- Metro
- Miami-Fort Lauderdale-Pompano Beach, FL
- State GDP YoY
- ▲ 3.28%
- F500 in state
- 36
Industry mix (Fortune 500 HQ in FL)
| Industry | F500 HQs | Revenue |
|---|---|---|
| Industrial Technology | 2 | $29B |
|
||
| Insurance | 2 | $17B |
|
||
| Retail | 1 | $60B |
|
||
| Technology Distribution | 1 | $58B |
|
||
| Homebuilding | 1 | $35B |
|
||
| Technology Manufacturing | 1 | $35B |
|
||
Price history
+508.1% since first listed3 events — show timeline
- 2026-05-08 Contingent — Beaches MLS
- 2026-04-15 Listed $450,000 Beaches MLS
- 1989-01-05 Sold (Public Records) $74,000 Public Records
Property tax history
+12.2%/yrLatest (2025): $7,774 · +2.8% YoY. Source: county tax records.
Cash-flow waterfall
monthlySold comps — $/sqft
last 12 mo · ≤1 miLoading sold comps…