 Duplex
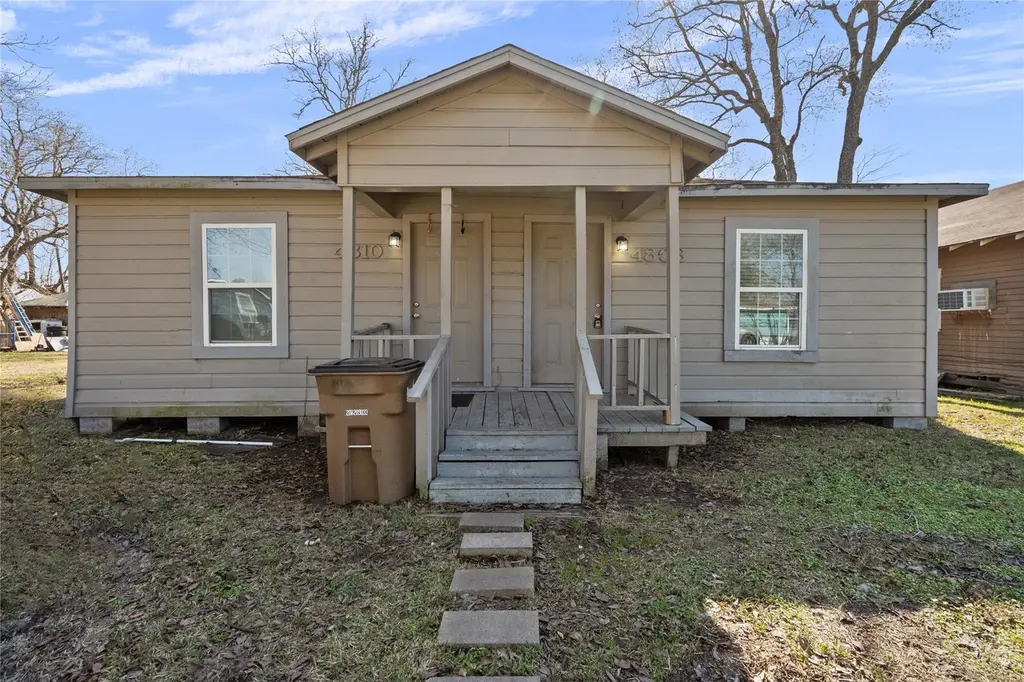
4808 35th St E · Dickinson, TX
Flood risk 7/10 · Major
- FEMA flood zone
- X (shaded)
- Chance of flooding over 30 yrs
- 0.76%
- Est. flood insurance / yr
- $507 – $1,088
Fire risk 1/10 · Minimal
- Est. fire insurance / yr
- $1,222 – $2,270
Heat risk 10/10 · Severe
- Hot days now (above 110°F)
- 7 days/yr
- Hot days in 30 yrs
- 26 days/yr
Wind risk 9/10 · Severe
- Chance of severe wind over 30 yrs
- 99.0%
Air-quality risk 2/10 · Minimal
- Unhealthy air days now
- 1 days/yr
- Unhealthy air days in 30 yrs
- 1 days/yr
Risk factors via First Street. Map © Google.
Why this score? — see what drove the B- grade
The composite is a weighted blend of 9 inputs, each scored 0–100. Each bar is that input's sub-score; the figure is the points it added to the 100-point composite (weight × sub-score).
- Cash flow +29.8/30.0
- DSCR +10.0/10.0
- 1% rule +9.9/10.0
- ARV discount +7.5/15.0
- Schools +3.5/10.0
- Livability +3.4/5.0
- Rent growth +2.5/5.0
- Condition / age +2.5/5.0
- Appreciation +0.0/10.0
$169,900
🖨 Deal sheet (PDF) 📄 Offer letter ✓ Due diligence
Multi-family units
County records classify this as Multi-Family (2-4 Unit). Listing-text estimate: 2 units. confirmed
Listing remarks
Investment Opportunity! 100% occupied. Charming duplex featuring 2 cozy one-bedroom, one-bath units, boasting stylish tile and laminate flooring, complemented by refreshing ceiling fans and a fresh coat of paint throughout. Perfect for comfortable living or as an investment opportunity in a desirable location. Mini splits offer cool air-conditioning throughout. Room measurements are approximate. MAKE AN APPOINTMENT TO VIEW TODAY! 48 Hour advance notice to show.
Key facts
- Laminate flooring
- Fresh coat of paint
- Ceiling fans
Tags
Property features AI
Finance
- Other: Building total area: 1,548; Annual tax information available
Exterior
- Utilities: Lot area: 6,250 square feet
- Home design: Residential income property
- Construction: Built in 1972; Composition roof
Interior
- Kitchen: Refrigerator
- Bedrooms: Total of 1 bedroom in Unit 1; 2 total residential units
- Flooring: Laminate flooring; Tile flooring
- Bathrooms: 2 full bathrooms (total)
- Interior features: Ceiling fan(s)
Neighborhood map
What this means for you Summary
Snapshot
- This is a 2 × 1-bed/1-bath units multifamily listed at $170k.
Deal economics
- At list price, monthly cash flow is $556 ($7k/yr) — positive. Per door: $278/mo.
- The deal already cash-flows at list — no discount required.
- Meets the 1% rule at list price ($3k rent vs $170k).
- Recommended offer: $167k (1.5% below list) — sets the bar for market timing.
- Cap rate 10.7% vs local median 2.4% in Dickinson — top-decile yield for the area; either an underpriced asset or a hidden risk that comps aren't pricing in. Stress-test before assuming the spread holds.
Location & tenants
- Location reads 67/100 on livability (#533 in TX) — a middle-class / working-renter tenant base. Strengths: cost of living A+, housing A+, employment A-; Watch: amenities F, commute F, health & safety F.
- Dickinson ISD (suburban): math 39% / reading 40% proficiency, ranked #366 of 826 in TX (top 44%) — families likely to look elsewhere, expect single-tenant / working-renter base with shorter leases; 60% free/reduced lunch — lower-income household profile, screen leases tightly.
- Zoned schools: Hughes Road El (math 36% / reading 31%, grade F, #2,174 of 4,322 statewide, top 51%, 707 students, 67% FRL); John And Shamarion Barber Middle (math 59% / reading 48%, grade C+, #275 of 1,662 statewide, top 17%, 568 students, 74% FRL); Dickinson H S (math 30% / reading 46%, grade F, #880 of 1,632 statewide, top 54%, 3,619 students, 64% FRL).
- Market conditions: Rents soft (-0.1%/yr); 676 active listings in the ZIP; 8 comparable units currently listed for rent nearby; rentals at typical pace (median 18d on market — plan ~3-4 weeks tenant-placement turnaround); solid renter incomes; 3,258 units permitted in Galveston County in 2024 (0 in 5+ unit buildings).
- This rent runs 34% of the median local income ($89k/yr) — at the standard rent-burdened threshold; future hikes will face affordability resistance.
Forward outlook
- Local home prices are declining (-3.0%/yr); year-one equity from $1k of loan paydown is wiped out by about $5k of value loss. Plan a longer hold.
- Galveston County population projected at +43% by 2050 — long-run rental-demand tailwind backs the buy-and-hold thesis.
Negotiation context
- It's been on market 27 days — a 2% lower offer ($167k) is reasonable based on typical stale-listing flexibility.
- 10 sale attempts since 10y ago with the ask held roughly flat each time — persistent listings suggest the price (not the market) is what's stuck; bring a comps-based counter.
Risks & watch-outs
- Watch-outs: property tax is 3.0% of price; flood insurance adds $66/mo.
- Climate carrying-cost: major flood risk; severe wind risk, 99% chance of damaging wind over 30y; extreme-heat days projected 7→26/yr by 2055 (HVAC capex compounding) — expect insurance premiums to compound above CPI over the hold.
Questions for the listing agent
- Can we see the unit-by-unit rent roll, current vacancy, and any below-market leases? What's the average tenancy length?
- What capital expenditures (roof, boiler, parking lot, exteriors) have been made in the last 5 years, and what's planned in the next 2?
- Built in 1972 — when were the roof, HVAC, electrical panel, plumbing, and water heater last replaced?
- Property tax is high relative to price — has the assessment been appealed recently, and will the sale trigger a re-assessment?
- What's the actual annual flood-insurance premium (NFIP or private), and is the property in a SFHA with mandatory coverage?
- Is there a deadline driving the sale (1031 exchange, divorce, estate, relocation)? That informs how much negotiation room exists.
- Schools are D-rated, which usually means shorter tenancies and higher turnover. Who's the typical renter profile here, and what's been the actual vacancy rate?
- What's the average days-on-market for RENTAL listings here right now (not sales)? A rising rental-DOM trend means longer vacancies and softer asking-rent achievability than the comps imply.
- What's the recent tenant-quality profile in this submarket — average credit score on applications, eviction rate, late-payment / NSF rate, and stable-employment percentage? A property-management company in the area should have these aggregated.
- How much new apartment / multifamily construction is in the pipeline within 1–3 miles? Heavy new supply (>2% of stock underway) typically softens rents 12–24 months out; light construction supports rent growth.
Investment metrics
- 1% rule
- 1.49% ✓
- Cap rate
- 10.69%
- Cash-on-cash
- 15.69%
- DSCR
- 1.70
- GRM
- 5.6
CMA / ARV
No comps found within radius.
Projected returns pro-forma
-3.0% appreciation · 0.0% rent growth · sell at horizon
- IRR
- 0.4%
- Equity multiple
- 1.01×
- Total profit
- $625
- Equity at exit
- $25,333
- IRR
- 6.1%
- Equity multiple
- 1.38×
- Total profit
- $18,221
- Equity at exit
- $14,690
Cash invested: $47,572 (down + closing). Projections, not guarantees.
Landlord ↔ Tenant lean methodology
- Overall (STATE)
- 87 Strongly Landlord-Friendly
- State Texas
- 87 Strongly Landlord-Friendly · R+5
- County
- — inherits STATE
- City
- — inherits STATE
ZIP-level market 77539
- Home prices YoY
- -29.8%
- Rents YoY
- -0.1%
- Active inventory
- 676
- Price-to-rent
- 11.2×
Monthly cashflow live
- Estimated rent
- $2,536 high interval (Pro) →
- Mortgage (P&I)
- −$891
- Tax from tax record
- −$420 /mo · $5,036/yr
- Insurance
- −$71
- Flood insurance flood zone
- −$66 /mo · $798/yr
- HOA
- −$0
- Vacancy / Maint / Mgmt
- −$533
- Net cashflow
- $556
Break-even live
Sensitivity live
| Price | -10% $652 | -5% $604 | +0% $556 | +5% $507 | +10% $459 |
|---|---|---|---|---|---|
| Rent | -10% $355 | -5% $455 | +0% $556 | +5% $656 | +10% $756 |
| Rate | -1.0pp $641 | -0.5pp $599 | base $556 | +0.5pp $511 | +1.0pp $467 |
2-unit breakdown (identical units grouped — click to expand)
| Units | Beds | Baths | Est. rent |
|---|---|---|---|
| 2× units | 1 | 1 | $2,536 |
| #1 | 1 | 1 | $1,268 |
| #2 | 1 | 1 | $1,268 |
| Total (2 units) | $2,536 | ||
UW: 25.0% down · 7.5% · 30yr · 1.5% tax · 5.0% vac · 8.0% maint · 8.0% mgmt
Financing live
Cash to close
- Down payment
- $42,475
- Closing costs
- $5,097
- Reserves months
- —
- Total cash needed
- —
Loan-product check · same deal, 3 products live
Conventional
25% down · 7.5% · 30yr
- Down + closing
- —
- Monthly P&I
- —
- Monthly cashflow
- —
- DSCR
- —
- Eligible?
- —
Personal DTI + credit; lowest rate.
DSCR
20% down · 8.5% · 30yr
- Down + closing
- —
- Monthly P&I
- —
- Monthly cashflow
- —
- DSCR
- —
- Eligible?
- —
No personal income docs; deal must DSCR.
Hard money
10% down · 12.0% · 12mo
- Down + closing
- —
- Monthly P&I
- —
- Monthly cashflow
- —
- DSCR
- —
- Eligible?
- —
Short-term bridge; refi at stabilization.
Rent comps 8 comps
| Address | Beds | Baths | Sqft | Rent | $/sqft | DOM | Units | Dist |
|---|---|---|---|---|---|---|---|---|
| 3206 Teakwood Cir Dickinson, TX | 3.0 | 2.0 | 1323 | $1,915 | $1.45 | 23d | 1 | 0.59mi |
| 5008 Asia Ln Dickinson, TX | 3.0 | 2.0 | 1475 | $1,739 | $1.18 | 14d | 1 | 0.62mi |
| 5049 Hauna Ln Dickinson, TX | 3.0 | 2.0 | 1272 | $1,795 | $1.41 | 5d | 1 | 0.63mi |
| 5101 Coba Calle Dickinson, TX | 3.0 | 2.0 | 1140 | $1,500 | $1.32 | 45d | 1 | 0.79mi |
| 5139 Martinique Calle Dickinson, TX | 3.0 | 2.0 | 1140 | $1,750 | $1.54 | 6d | 1 | 0.82mi |
| 3705 Misty Cove Ct Dickinson, TX | 3.0 | 2.0 | 1609 | $2,400 | $1.49 | 45d | 1 | 0.83mi |
| 5601 FM 517 Rd E Dickinson, TX | 1.0–3.0 | 1.0–2.0 | 922 | $1,509 | $1.64 | 0d | 3 | 0.95mi |
| 5313 Palm Dr Unit 1546303P Dickinson, TX | 3.0 | 2.0 | 1636 | $5,645 | $3.45 | 18d | 1 | 1.45mi |
Listing history 46 events
-
2026-06-21days on market $169,900 Active 27 DOM
-
2026-06-18days on market $169,900 Active 24 DOM
-
2026-06-17days on market $169,900 Active 23 DOM
-
2026-06-16days on market $169,900 Active 22 DOM
-
2026-06-15days on market $169,900 Active 21 DOM
-
2026-06-13days on market $169,900 Active 19 DOM
-
2026-06-09days on market $169,900 Active 15 DOM
-
2026-06-08days on market $169,900 Active 14 DOM
-
2026-06-07days on market $169,900 Active 13 DOM
-
2026-06-04days on market $169,900 Active 10 DOM
-
2026-06-03days on market $169,900 Active 9 DOM
-
2026-06-02days on market $169,900 Active 8 DOM
-
2026-06-01days on market $169,900 Active 7 DOM
-
2026-05-31days on market $169,900 Active 6 DOM
-
2026-05-25$169,900 Active
-
2026-01-31historical
-
2025-05-01historical $850
-
2025-04-24historical $850
-
2025-04-15price $850
-
2025-04-15price $850
-
2025-04-08price $875
-
2025-04-08price $875
-
2025-04-01price $900
-
2025-03-30$900
-
2025-03-08$169,900 Active
-
2025-02-28historical
-
2025-02-25$950
-
2025-02-18historical $950
-
2025-02-04$950
-
2024-04-09$169,900 Active
-
2024-02-28historical $850
-
2024-02-05price $850
-
2024-01-21$875
-
2018-08-07soldstatus
-
2018-08-03soldstatus Sold
-
2018-07-15status Pending
-
2018-06-25status Option Pending
-
2018-04-24price $150,000
-
2018-04-09$165,000 Active
-
2017-07-03soldstatus
-
2017-06-30soldstatus Sold
-
2017-06-30status Pending
-
2017-06-26status Option Pending
-
2017-03-25$79,900 Active
-
2017-02-28historical
-
2016-09-01$79,900 Active
ⓘ Source: listings_history table (triggers on properties + properties_extension) + one-shot
backfill from property_details.listing_events for pre-trigger history.
Tax reassessment forecast TX · Resets to sale price
- Current annual tax
- $5,036 · $420/mo
- Projected year-2 tax
- $5,036 · $420/mo
- Expected delta
- $0/yr ($0/mo · 0.0%)
ⓘ Screening estimate from a state-policy table — verify with the county assessor before closing.
Climate risk First Street
- Flood 7/10 Severe FEMA zone X (shaded) · 76% chance over 30 yrs
- Wildfire 1/10 Low
- Heat 10/10 Extreme 7 d/yr ≥110°F today · 26 d/yr by 30 yrs out
- Wind 9/10 Extreme 99% chance of damaging wind over 30 yrs
- Air quality 2/10 Low 1 unhealthy d/yr today · 1 by 30 yrs out
Nearby sold comps map
Loading sold comps map…
Walkable amenities ~0.75 mi
Loading nearby amenities…
Taxation est. · year 1
- Rental income
- $30,432
- − Mortgage interest
- −$9,517
- − Property taxes
- −$5,036
- − Insurance
- −$1,647
- − Repairs & maintenance
- −$2,435
- − Management
- −$2,435
- − Depreciation
- −$4,943
- Taxable income
- $4,420
- Est. tax owed @ 24.0%
- −$1,061
- After-tax cash flow
- $5,606/yr
For passive investors: Depreciation is non-cash, so a rental often shows a tax loss while cash-flowing — sheltering income. Rental losses are passive: they offset passive income freely, and up to $25,000/yr can offset ordinary (W-2) income if you actively participate and your MAGI is under $100k (phasing out to $0 by $150k); unused losses carry forward. On sale, claimed depreciation is recaptured at up to 25%, and gains may owe capital-gains tax (a 1031 exchange can defer both). Figures are a year-1 estimate at your 24.0% rate — not tax advice; consult a CPA.
Schools (NCES district)
- District
- Dickinson ISD
- NCES district ID
- 4817070
- Math proficiency
- 39% ▼ -11.00%
- Reading proficiency
- 40% ▼ -2.00%
- Median HH income
- $61,318
- Composite
- 35.16/100
- National rank
- #5005
- State rank
- #366 of 826 in TX
Livability — Dickinson
- Score
- 67/100
- State rank
- #533
- US rank
- #10431
Category grades
Schools grade is shown separately in the Schools card above.
Census & demographics
- Census place
- Dickinson, TX
- County
- Galveston County · 357,330 people
- City population
- 49,375
- Metro
- Houston-The Woodlands-Sugar Land, TX
- Population (ZIP)
- 49,375
- Household income
- $89,111
- Rent vs Own
- Severe rent burden
- 869.0
Population outlook (Galveston County) Hauer SSP2
- Today (2025)
- 390,640 people
- By 2030
- 425,226 · +8.9%
- By 2040
- 493,765 · +26.4%
- By 2050
- 559,698 · +43.3%
- By 2075
- 719,260 · +84.1%
- By 2100
- 819,628 · +109.8%
Race, ethnicity, and origin ACS 2023
- Neighborhood character
- Diverse neighborhood (Simpson 0.64)
- Race & ethnicity
- White 47% Hispanic / Latino 37% Two or more races 19% Black 10% Asian 3%
- Hispanic origin (detail)
- Mexican 29% Puerto Rican 2%
- Common ancestry
- Italian 3% Romanian 2% Lithuanian 1%
- Foreign-born
- 13% · Canada, Vietnam
- Languages at home
- 73% English-only · Spanish 24% Vietnamese 1% Other Indo-European 1%
Political lean MEDSL · Galveston
- 2024 margin
- Strong R (+27.4) · D 35.7% · R 63.1% · Other 1.2%
- 2008→2024 swing
- -7.9pp toward R · 2008: -19.5pp · 2024: -27.4pp
- All cycles
- 2024: R+27.4 2020: R+22.6 2016: R+22.6 2012: R+26.9 2008: R+19.5
Not yet ingested
- Civics
- —
Market trends
- HPI YoY
- ▼ -109.46%
- Current HPI
- 258.0104
- Rent YoY
- ▼ -0.12%
- Metro
- Houston-The Woodlands-Sugar Land, TX
- State GDP YoY
- ▲ 3.95%
- F500 in state
- 110
Industry mix (Fortune 500 HQ in TX)
| Industry | F500 HQs | Revenue |
|---|---|---|
| Energy | 16 | $1,198B |
|
||
| Technology | 5 | $198B |
|
||
| Engineering / Construction | 4 | $72B |
|
||
| Energy Services | 3 | $60B |
|
||
| Utilities | 3 | $41B |
|
||
| Healthcare | 2 | $330B |
|
||
Price history
+112.6% since first listed32 events — show timeline
- 2026-05-25 Listed $169,900 HARMLS
- 2026-01-31 Listing Removed — HARMLS
- 2025-05-01 Rental Removed $850 RENT.
- 2025-04-24 Rental Removed $850 HARMLS
- 2025-04-15 Price Changed $850 RENT.
- 2025-04-15 Price Changed $850 HARMLS
- 2025-04-08 Price Changed $875 RENT.
- 2025-04-08 Price Changed $875 HARMLS
- 2025-04-01 Price Changed $900 RENT.
- 2025-03-30 Listed for Rent $900 HARMLS
- 2025-03-08 Listed $169,900 HARMLS
- 2025-02-28 Listing Removed — HARMLS
- 2025-02-25 Listed for Rent $950 RENT.
- 2025-02-18 Rental Removed $950 RENT.
- 2025-02-04 Listed for Rent $950 RENT.
- 2024-04-09 Listed $169,900 HARMLS
- 2024-02-28 Rental Removed $850 HARMLS
- 2024-02-05 Price Changed $850 HARMLS
- 2024-01-21 Listed for Rent $875 HARMLS
- 2018-08-07 Sold (Public Records) — Public Records
- 2018-08-03 Sold (MLS) — HARMLS
- 2018-07-15 Pending — HARMLS
- 2018-06-25 Pending — HARMLS
- 2018-04-24 Price Changed $150,000 HARMLS
- 2018-04-09 Listed $165,000 HARMLS
- 2017-07-03 Sold (Public Records) — Public Records
- 2017-06-30 Sold (MLS) — HARMLS
- 2017-06-30 Pending — HARMLS
- 2017-06-26 Pending — HARMLS
- 2017-03-25 Listed $79,900 HARMLS
- 2017-02-28 Listing Removed — HARMLS
- 2016-09-01 Listed $79,900 HARMLS
Property tax history
+13.9%/yrLatest (2025): $5,036 · +13.3% YoY. Source: county tax records.
Cash-flow waterfall
monthlySold comps — $/sqft
last 12 mo · ≤1 miLoading sold comps…