7116 S Lions Ave · Broken Arrow, OK
Flood risk No data
- FEMA flood zone
- —
- Chance of flooding over 30 yrs
- —
- Est. flood insurance / yr
- —
Fire risk No data
- Est. fire insurance / yr
- —
Heat risk No data
- Hot days now (above threshold)
- —
- Hot days in 30 yrs
- —
Wind risk No data
- Chance of severe wind over 30 yrs
- —
Air-quality risk No data
- Unhealthy air days now
- —
- Unhealthy air days in 30 yrs
- —
Risk factors via First Street. Map © Google.
Why this score? — see what drove the D- grade
The composite is a weighted blend of 9 inputs, each scored 0–100. Each bar is that input's sub-score; the figure is the points it added to the 100-point composite (weight × sub-score).
- Cash flow +11.2/30.0
- Condition / age +5.0/5.0
- ARV discount +4.6/15.0
- Livability +3.9/5.0
- Rent growth +3.5/5.0
- 1% rule +3.4/10.0
- DSCR +3.3/10.0
- Schools +2.4/10.0
- Appreciation +0.0/10.0
$271,144
🖨 Deal sheet 📄 Offer letter ✓ Due diligence
Listing remarks
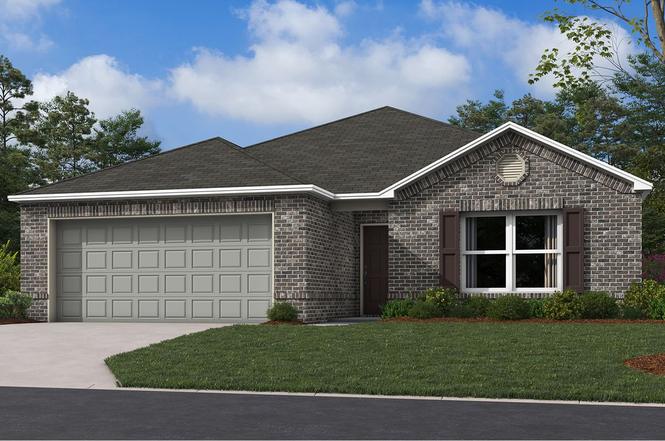
NEW CONSTRUCTION! The Fenway Plan by Lennar Homes. Popular Floor Plan – Sells Fast! This smartly designed 3-bed, 2-bath home features an open entry with tall ceilings and a spacious living room. The kitchen includes an island, plenty of cabinet space, a pantry, and a cozy breakfast nook that leads to the covered patio—perfect for morning coffee or evening hangs. The primary suite offers a large walk-in closet and private bath. Laundry room connects the garage to the kitchen for everyday convenience. Two additional bedrooms and a full bath are located up front. Open layout, modern features, and a design buyers love. Discover South Broken Arrow’s hottest new community—
Key facts
- Cozy breakfast nook
- Covered patio
- Kitchen island
Tags
Property features AI
Finance
- Financial info: List price $271,144
Exterior
- Parking: 2 garage spaces (2 total parking spaces)
- Home design: Spec new construction, plan named Rc Fenway; Active listing
Interior
- Bedrooms: 3 bedrooms
- Bathrooms: 2 full bathrooms
- Interior features: Living area approximately 1,446
Neighborhood map
What this means for you Summary
Snapshot
- This is a 3-bed/2.0-bath single-family listed at $271k. Condition is rated excellent.
Deal economics
- At list price, monthly cash flow is $-106 ($-1k/yr) — negative.
- To cash-flow at today's rent, offer at most $256k (5.6% below list).
- To meet the 1% rule (rent ≥ 1% of price), the offer needs to be $227k (16.1% below list).
- Recommended offer: $227k (16.1% below list) — sets the bar for 1% rule.
- Cap rate 5.8% vs local median 4.0% in Broken Arrow — top-decile yield for the area; either an underpriced asset or a hidden risk that comps aren't pricing in. Stress-test before assuming the spread holds.
Location & tenants
- Location reads 78/100 on livability (#7 in OK, #2,691 nationally) — a middle-class / working-renter tenant base. Strengths: commute A+, cost of living A+, housing A+; Watch: schools D+, amenities F.
- Broken Arrow (suburban): math 23% / reading 28% proficiency, ranked #79 of 270 in OK (top 29%) — low school quality limits family demand, transient renter base, plan for 1-2y turnover.
- Market conditions: Rents rising fast (+4.1%/yr); 381 active listings in the ZIP; 8 comparable units currently listed for rent nearby; rentals leasing fast (median 3d on market — plan ~1-2 weeks tenant-placement turnaround); solid renter incomes; 2,818 units permitted in Tulsa County in 2024 (518 in 5+ unit buildings).
Forward outlook
- Local home prices are declining (-3.0%/yr); year-one equity from $2k of loan paydown is wiped out by about $8k of value loss. Plan a longer hold.
- Tulsa County population projected at +30% by 2050 — long-run rental-demand tailwind backs the buy-and-hold thesis.
Negotiation context
- Only 1 days on market — expect competitive offers; lowballing is unlikely to land.
Questions for the listing agent
- What do current leases actually rent for vs. the listed asking? Can we see a recent rent roll and the last 12 months of T-12 income?
- What does the HOA fee cover, when was the last increase, and are there any pending special assessments or reserve-fund shortfalls?
- Is there a deadline driving the sale (1031 exchange, divorce, estate, relocation)? That informs how much negotiation room exists.
- Schools are D-rated, which usually means shorter tenancies and higher turnover. Who's the typical renter profile here, and what's been the actual vacancy rate?
- The area grade is low — what's the realistic commute time and amenity access for the typical tenant pool here? Any planned neighborhood developments (good or bad) we should know about?
- What's the average days-on-market for RENTAL listings here right now (not sales)? A rising rental-DOM trend means longer vacancies and softer asking-rent achievability than the comps imply.
- What's the recent tenant-quality profile in this submarket — average credit score on applications, eviction rate, late-payment / NSF rate, and stable-employment percentage? A property-management company in the area should have these aggregated.
- How much new for-sale + rental construction is in the pipeline within 1–3 miles? Heavy new supply typically softens prices + rents 12–24 months out; constrained supply supports both.
Investment metrics
- 1% rule
- 0.84% ✗
- Cap rate
- 5.83%
- Cash-on-cash
- -1.67%
- DSCR
- 0.93
- GRM
- 9.9
CMA / ARV
- ARV (on-the-fly)
- $254,496
- Comps found
- 12
Show comp detail 12 sales within ~0.75 mi
| Address | Dist | Beds/Ba | Sqft | Sold | Price | $/sf | Match |
|---|---|---|---|---|---|---|---|
| 7208 S Lions Ave | 0.00mi | 3/2.0 | 1,446 (0%) | 2mo | $277,144 | $192 | 99 |
| 7121 S Maple Ave | 0.06mi | 3/2.0 | 1,422 (-2%) | 2mo | $267,200 | $188 | 93 |
| 7105 S Maple Ave | 0.06mi | 3/2.0 | 1,422 (-2%) | 4mo | $267,200 | $188 | 92 |
| 7600 S Maple Ave | 0.08mi | 3/2.0 | 1,414 (-2%) | 3mo | $185,000 | $131 | 90 |
| 7204 S Lions Ave | 0.00mi | 3/2.0 | 1,633 (+13%) | 1mo | $284,050 | $174 | 78 |
| 7508 S Lions Ave | 0.02mi | 3/2.0 | 1,252 (-13%) | 2mo | $185,000 | $148 | 75 |
| 7025 S Maple Ave | 0.06mi | 3/2.0 | 1,633 (+13%) | 1mo | $288,175 | $176 | 75 |
| 7205 S Maple Ave | 0.06mi | 4/2.0 (+1) | 1,615 (+12%) | 1mo | $281,107 | $174 | 72 |
| 7017 S Maple Ave | 0.06mi | 4/2.0 (+1) | 1,613 (+12%) | 3mo | $285,775 | $177 | 71 |
| 7606 Glenwood Cir | 0.36mi | 3/2.0 | 1,634 (+13%) | 2mo | $245,000 | $150 | 60 |
| 7505 S Walnut Ave | 0.52mi | 3/2.0 | 1,606 (+11%) | 4mo | $285,000 | $177 | 54 |
| 8005 S Date Ave | 0.71mi | 3/2.0 | 1,312 (-9%) | 1mo | $230,000 | $175 | 51 |
Match score weights: distance 35% · size 25% · config 20% · recency 20%. Top-matched comps best support the ARV.
Projected returns pro-forma
-3.0% appreciation · 4.09% rent growth · sell at horizon
- IRR
- -17.8%
- Equity multiple
- 0.37×
- Total profit
- $-48,091
- Equity at exit
- $40,428
- IRR
- -7.9%
- Equity multiple
- 0.48×
- Total profit
- $-39,747
- Equity at exit
- $23,444
Cash invested: $75,920 (down + closing). Projections, not guarantees.
Landlord ↔ Tenant lean methodology
- Overall (STATE)
- 83 Strongly Landlord-Friendly
- State Oklahoma
- 83 Strongly Landlord-Friendly · R+20
- County
- — inherits STATE
- City
- — inherits STATE
ZIP-level market 74011
- Rents YoY
- 4.1%
- Active inventory
- 381
- Price-to-rent
- 9.9×
Monthly cashflow live
- Estimated rent
- $2,275 high interval (Pro) →
- Mortgage (P&I)
- −$1,422
- Tax est. 1.5%
- −$339 /mo · $4,067/yr
- Insurance
- −$113
- HOA
- −$29
- Vacancy / Maint / Mgmt
- −$478
- Net cashflow
- $-106
Break-even live
UW: 25.0% down · 7.5% · 30yr · 1.5% tax · 5.0% vac · 8.0% maint · 8.0% mgmt
Financing live
Cash to close
- Down payment
- $67,786
- Closing costs
- $8,134
- Reserves months
- —
- Total cash needed
- —
Loan-product check · same deal, 3 products live
Conventional
25% down · 7.5% · 30yr
- Down + closing
- —
- Monthly P&I
- —
- Monthly cashflow
- —
- DSCR
- —
- Eligible?
- —
Personal DTI + credit; lowest rate.
DSCR
20% down · 8.5% · 30yr
- Down + closing
- —
- Monthly P&I
- —
- Monthly cashflow
- —
- DSCR
- —
- Eligible?
- —
No personal income docs; deal must DSCR.
Hard money
10% down · 12.0% · 12mo
- Down + closing
- —
- Monthly P&I
- —
- Monthly cashflow
- —
- DSCR
- —
- Eligible?
- —
Short-term bridge; refi at stabilization.
Rent comps 8 comps
| Address | Beds | Baths | Sqft | Rent | $/sqft | DOM | Units | Dist |
|---|---|---|---|---|---|---|---|---|
| 7313 S Walnut Ave Broken Arrow, OK | 3.0 | 2.0 | 1600 | $1,990 | $1.24 | 10d | 1 | 0.50mi |
| 2008 W Huntsville Pl Broken Arrow, OK | 3.0 | 2.0 | 1568 | $2,100 | $1.34 | 3d | 1 | 0.60mi |
| 2420 W Imperial Ct Broken Arrow, OK | 3.0 | 2.0 | 1726 | $2,415 | $1.40 | 1d | 1 | 0.88mi |
| 2421 W Imperial Ct Broken Arrow, OK | 3.0 | 2.0 | 1726 | $2,415 | $1.40 | 1d | 1 | 0.89mi |
| 2430 W Imperial Ct Broken Arrow, OK | 3.0 | 2.0 | 1726 | $2,415 | $1.40 | 1d | 1 | 0.90mi |
| 6308 S 1st Pl Broken Arrow, OK | 3.0 | 2.0 | 1600 | $3,400 | $2.12 | 16d | 1 | 1.08mi |
| 2602 W Tucson St Broken Arrow, OK | 1.0–2.0 | 1.0–2.5 | 1028 | $1,884 | $1.83 | 1d | 19 | 1.16mi |
| 7211 S Laurel Pl Broken Arrow, OK | 4.0 | 2.0 | 1851 | $2,200 | $1.19 | 3d | 1 | 1.39mi |
HOA detail
- Monthly dues
- $29 · $348/yr
Listing history 15 events
-
2026-06-17remarks 675-char remark
-
2026-06-17days on market $271,144 Active 1 DOM
-
2026-06-17days on market $271,144 Active 81 DOM
-
2026-06-16days on market $271,144 Active 80 DOM
-
2026-06-15days on market $271,144 Active 79 DOM
-
2026-06-13days on market $271,144 Active 77 DOM
-
2026-06-10days on market $271,144 Active 74 DOM
-
2026-06-09days on market $271,144 Active 73 DOM
-
2026-06-08days on market $271,144 Active 72 DOM
-
2026-06-07days on market $271,144 Active 71 DOM
-
2026-06-05days on market $271,144 Active 68 DOM
-
2026-06-03days on market $271,144 Active 67 DOM
-
2026-06-02days on market $271,144 Active 66 DOM
-
2026-06-01days on market $271,144 Active 65 DOM
-
2026-05-31days on market $271,144 Active 64 DOM
ⓘ Source: listings_history table (triggers on properties + properties_extension) + one-shot
backfill from property_details.listing_events for pre-trigger history.
Nearby sold comps map
Loading sold comps map…
Walkable amenities ~0.75 mi
Loading nearby amenities…
Taxation est. · year 1
- Rental income
- $27,299
- − Mortgage interest
- −$15,188
- − Property taxes
- −$4,067
- − Insurance
- −$1,356
- − Repairs & maintenance
- −$2,184
- − Management
- −$2,184
- − HOA
- −$348
- − Depreciation
- −$7,888
- Taxable loss
- −$5,916
- Est. tax savings @ 24.0%
- +$1,420
- After-tax cash flow
- $152/yr
For passive investors: Depreciation is non-cash, so a rental often shows a tax loss while cash-flowing — sheltering income. Rental losses are passive: they offset passive income freely, and up to $25,000/yr can offset ordinary (W-2) income if you actively participate and your MAGI is under $100k (phasing out to $0 by $150k); unused losses carry forward. On sale, claimed depreciation is recaptured at up to 25%, and gains may owe capital-gains tax (a 1031 exchange can defer both). Figures are a year-1 estimate at your 24.0% rate — not tax advice; consult a CPA.
Condition & rehab AI · 2 photos
This new construction home is in excellent condition with no visible repairs or maintenance needed. It offers a good return on investment with potential for both resale and rental value through minor cosmetic improvements.
Value-add opportunities
- Both Painting the exterior — Enhances curb appeal and can increase both resale and rental value
- Both Landscaping improvements — Enhances curb appeal and can increase both resale and rental value
Renovation cost estimate screening
Value-add ROI direction
- Both Painting the exterior — Enhances curb appeal and can increase both resale and rental value ↑
- Both Landscaping improvements — Enhances curb appeal and can increase both resale and rental value ↑
ⓘ Cost ranges are severity-bucket heuristics (US national rule-of-thumb). Get contractor quotes + a written scope before underwriting a rehab budget.
Schools (NCES district)
- District
- Broken Arrow
- NCES district ID
- 4005490
- Math proficiency
- 23% ▼ -9.00%
- Reading proficiency
- 28% ▼ -9.00%
- Median HH income
- $64,646
- Composite
- 23.86/100
- National rank
- #7801
- State rank
- #79 of 270 in OK
Livability — Broken Arrow
- Score
- 78/100
- State rank
- #7
- US rank
- #2691
Category grades
Schools grade is shown separately in the Schools card above.
Census & demographics
- Census place
- Broken Arrow, OK
- County
- Tulsa County · 640,811 people
- City population
- 144,172
- Metro
- Tulsa, OK
- Population (ZIP)
- 33,900
- Household income
- $99,157
- Rent vs Own
- Severe rent burden
- 389.0
Population outlook (Tulsa County) Hauer SSP2
- Today (2025)
- 723,846 people
- By 2030
- 766,033 · +5.8%
- By 2040
- 851,386 · +17.6%
- By 2050
- 938,389 · +29.6%
- By 2075
- 1,166,011 · +61.1%
- By 2100
- 1,350,277 · +86.5%
Race, ethnicity, and origin ACS 2023
- Neighborhood character
- Predominantly White (68%)
- Race & ethnicity
- White 68% Two or more races 15% Hispanic / Latino 10% Native American 4% Black 4% Asian 3%
- Hispanic origin (detail)
- Mexican 7%
- Common ancestry
- Lithuanian 3% Serbian 2% Slovak 2%
- Foreign-born
- 5% · Canada
- Languages at home
- 93% English-only · Spanish 5% Other Asian/Pacific 1%
Political lean MEDSL · Tulsa
- 2024 margin
- R (+15.2) · D 41.3% · R 56.5% · Other 2.2%
- 2008→2024 swing
- +9.2pp toward D · 2008: -24.5pp · 2024: -15.2pp
- All cycles
- 2024: R+15.2 2020: R+15.6 2016: R+22.9 2012: R+27.4 2008: R+24.5
Not yet ingested
- Civics
- —
Market trends
- HPI YoY
- ▼ -180.15%
- Current HPI
- 210.8302
- Rent YoY
- ▲ 4.09%
- Metro
- Tulsa, OK
- State GDP YoY
- ▲ 1.55%
- F500 in state
- 6
Industry mix (Fortune 500 HQ in OK)
| Industry | F500 HQs | Revenue |
|---|---|---|
| Energy | 3 | $48B |
|
||
Cash-flow waterfall
monthlySold comps — $/sqft
last 12 mo · ≤1 miLoading sold comps…