 Multi-family
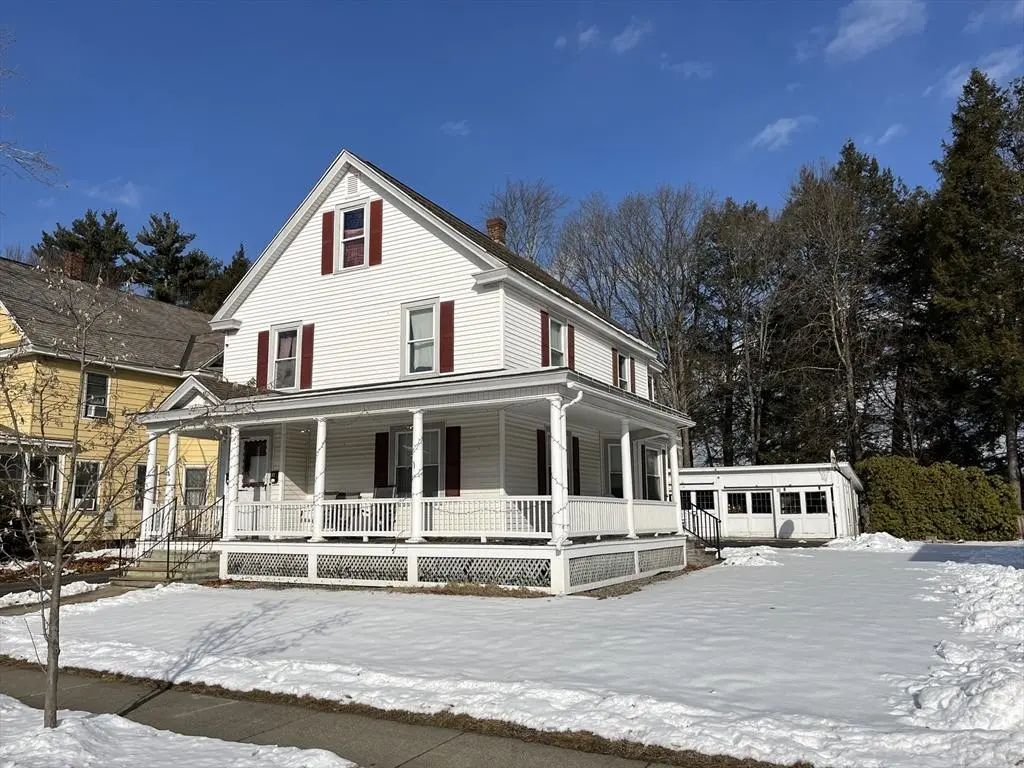
37 Cleveland St · Greenfield, MA
Flood risk 1/10 · Minimal
- FEMA flood zone
- X
- Chance of flooding over 30 yrs
- 0.0%
- Est. flood insurance / yr
- $473 – $860
Fire risk 1/10 · Minimal
- Est. fire insurance / yr
- $915 – $1,699
Heat risk 4/10 · Minor
- Hot days now (above 96°F)
- 7 days/yr
- Hot days in 30 yrs
- 16 days/yr
Wind risk 4/10 · Minor
- Chance of severe wind over 30 yrs
- 15.0%
Air-quality risk 2/10 · Minimal
- Unhealthy air days now
- 0 days/yr
- Unhealthy air days in 30 yrs
- 1 days/yr
Risk factors via First Street. Map © Google.
Why this score? — see what drove the D- grade
The composite is a weighted blend of 9 inputs, each scored 0–100. Each bar is that input's sub-score; the figure is the points it added to the 100-point composite (weight × sub-score).
- ARV discount +15.0/15.0
- Cash flow +8.1/30.0
- 1% rule +2.6/10.0
- Rent growth +2.5/5.0
- Livability +2.5/5.0
- Condition / age +2.5/5.0
- DSCR +2.2/10.0
- Schools +2.0/10.0
- Appreciation +0.0/10.0
$274,500
🖨 Deal sheet 📄 Offer letter ✓ Due diligence
Multi-family units
County records classify this as Multi-Family (2-4 Unit). Listing-text estimate: 1 unit. estimate disagrees with records
Listing remarks MLS
Once a single family home, this solid 2 family with walk up attic has vinyl siding and replacement windows. Roofs on both the house and garage were replaced under current ownership. There is a large 4 car garage, perfect for cars, storage or workshop space. It has a wonderful location, convenient to schools, shopping and highway access. Rents are below market. With some updates, you will have a great owner occupied or investment property. Open House Saturday, 1/31, from 11:00 to 1:00 p.m..
Key facts
- Walk up attic
- Large garage
- Vinyl siding
Tags
Neighborhood map
What this means for you Summary
Snapshot
- This is a 2-bed/2.0-bath multifamily listed at $274k.
Deal economics
- At list price, monthly cash flow is $-265 ($-3k/yr) — negative.
- To cash-flow at today's rent, offer at most $228k (17.0% below list).
- To meet the 1% rule (rent ≥ 1% of price), the offer needs to be $209k (23.8% below list).
- Recommended offer: $209k (23.8% below list) — sets the bar for 1% rule.
Location & tenants
- Location reads: area grade D — affects rentability + tenant quality, not the cash-flow math above.
- Greenfield (town): math 15% / reading 32% proficiency, ranked #279 of 302 in MA (top 92%) — low school quality limits family demand, transient renter base, plan for 1-2y turnover.
- Market conditions: 18 active listings in the ZIP; 1 comparable units currently listed for rent nearby; 89 units permitted in Franklin County in 2024 (22 in 5+ unit buildings).
- This rent runs 45% of the median local income ($56k/yr) — at the standard rent-burdened threshold; future hikes will face affordability resistance.
Forward outlook
- Local home prices are declining (-3.0%/yr); year-one equity from $2k of loan paydown is wiped out by about $8k of value loss. Plan a longer hold.
- Franklin County population projected at -20% by 2050 — secular population decline; favor cash flow + early exit over multi-decade hold.
Negotiation context
- It's been on market 141 days — a 12% lower offer ($242k) is reasonable based on typical stale-listing flexibility.
- 2 sale attempts since 20y ago with the ask held roughly flat each time — persistent listings suggest the price (not the market) is what's stuck; bring a comps-based counter.
- Current owner paid $172k; list at $274k implies a 60% gain — meaningful room to come down on a strong offer.
Risks & watch-outs
- Watch-outs: built in 1900 — expect roof / HVAC / electrical / plumbing capex.
Questions for the listing agent
- What do current leases actually rent for vs. the listed asking? Can we see a recent rent roll and the last 12 months of T-12 income?
- It's been on market 141 days. Have you received any prior offers? Is the seller open to a 24% concession, seller financing, or rate buy-down credit?
- Built in 1900 — when were the roof, HVAC, electrical panel, plumbing, and water heater last replaced?
- Why hasn't it sold? Are there any deal-killer items the seller is aware of (foundation, flood, title, zoning, code violations)?
- Is there a deadline driving the sale (1031 exchange, divorce, estate, relocation)? That informs how much negotiation room exists.
- The area grade is low — what's the realistic commute time and amenity access for the typical tenant pool here? Any planned neighborhood developments (good or bad) we should know about?
- What's the average days-on-market for RENTAL listings here right now (not sales)? A rising rental-DOM trend means longer vacancies and softer asking-rent achievability than the comps imply.
- What's the recent tenant-quality profile in this submarket — average credit score on applications, eviction rate, late-payment / NSF rate, and stable-employment percentage? A property-management company in the area should have these aggregated.
- How much new apartment / multifamily construction is in the pipeline within 1–3 miles? Heavy new supply (>2% of stock underway) typically softens rents 12–24 months out; light construction supports rent growth.
Investment metrics
- 1% rule
- 0.76% ✗
- Cap rate
- 5.14%
- Cash-on-cash
- -4.13%
- DSCR
- 0.82
- GRM
- 10.9
CMA / ARV
- ARV (median comp)
- $332,797
- List price
- $274,500
- Delta
- -17.52%
- Verdict
- UNDERPRICED
- Comps
- 18 within 1.0 mi
Show comp detail 4 sales within ~0.75 mi
| Address | Dist | Beds/Ba | Sqft | Sold | Price | $/sf | Match |
|---|---|---|---|---|---|---|---|
| 35-37 Shattuck St | 0.06mi | 3/2.0 (+1) | 1,662 (-0%) | 6mo | $342,500 | $206 | 87 |
| 306 Davis St | 0.33mi | 3/2.0 (+1) | 1,734 (+4%) | 6mo | $317,000 | $183 | 69 |
| 15 Pond St | 0.62mi | 3/2.0 (+1) | 1,797 (+8%) | 12mo | $220,000 | $122 | 43 |
| 28-30 Walnut St | 0.71mi | 2/2.0 | 1,554 (-7%) | 15mo | $281,056 | $181 | 43 |
Match score weights: distance 35% · size 25% · config 20% · recency 20%. Top-matched comps best support the ARV.
Projected returns pro-forma
-3.0% appreciation · 3.0% rent growth · sell at horizon
- IRR
- -23.2%
- Equity multiple
- 0.20×
- Total profit
- $-61,290
- Equity at exit
- $40,929
- IRR
- -17.9%
- Equity multiple
- 0.03×
- Total profit
- $-74,893
- Equity at exit
- $23,734
Cash invested: $76,860 (down + closing). Projections, not guarantees.
Landlord ↔ Tenant lean methodology
- Overall (STATE)
- 20 Strongly Tenant-Friendly
- State Massachusetts
- 20 Strongly Tenant-Friendly · D+15
- County
- — inherits STATE
- City
- — inherits STATE
ZIP-level market 01301
- Home prices YoY
- -24.0%
- Active inventory
- 18
- Price-to-rent
- 10.9×
Monthly cashflow live
- Estimated rent
- $2,092 medium interval (Pro) →
- Mortgage (P&I)
- −$1,440
- Tax from tax record
- −$363 /mo · $4,358/yr
- Insurance
- −$114
- HOA
- −$0
- Vacancy / Maint / Mgmt
- −$439
- Net cashflow
- $-265
Break-even live
UW: 25.0% down · 7.5% · 30yr · 1.5% tax · 5.0% vac · 8.0% maint · 8.0% mgmt
Financing live
Cash to close
- Down payment
- $68,625
- Closing costs
- $8,235
- Reserves months
- —
- Total cash needed
- —
Loan-product check · same deal, 3 products live
Conventional
25% down · 7.5% · 30yr
- Down + closing
- —
- Monthly P&I
- —
- Monthly cashflow
- —
- DSCR
- —
- Eligible?
- —
Personal DTI + credit; lowest rate.
DSCR
20% down · 8.5% · 30yr
- Down + closing
- —
- Monthly P&I
- —
- Monthly cashflow
- —
- DSCR
- —
- Eligible?
- —
No personal income docs; deal must DSCR.
Hard money
10% down · 12.0% · 12mo
- Down + closing
- —
- Monthly P&I
- —
- Monthly cashflow
- —
- DSCR
- —
- Eligible?
- —
Short-term bridge; refi at stabilization.
Rent comps 1 comps
| Address | Beds | Baths | Sqft | Rent | $/sqft | DOM | Units | Dist |
|---|---|---|---|---|---|---|---|---|
| 158 Main St Unit 9 Greenfield, MA | 2.0 | 1.0 | 1500 | $2,800 | $1.87 | 13d | 1 | 1.12mi |
Listing history 20 events
-
2026-06-18days on market $274,500 Active 141 DOM
-
2026-06-17days on market $274,500 Active 140 DOM
-
2026-06-16days on market $274,500 Active 139 DOM
-
2026-06-15days on market $274,500 Active 138 DOM
-
2026-06-14days on market $274,500 Active 136 DOM
-
2026-06-13days on market $274,500 Active 135 DOM
-
2026-06-10days on market $274,500 Active 133 DOM
-
2026-06-09days on market $274,500 Active 132 DOM
-
2026-06-08days on market $274,500 Active 131 DOM
-
2026-06-07days on market $274,500 Active 130 DOM
-
2026-06-03days on market $274,500 Active 126 DOM
-
2026-06-02days on market $274,500 Active 125 DOM
-
2026-06-01days on market $274,500 Active 124 DOM
-
2026-05-31days on market $274,500 Active 123 DOM
-
2026-05-30days on market $274,500 Active 122 DOM
-
2026-04-13price $274,500 500-char remark
Show marketing remark (500 chars)
Once a single family home, this solid 2 family with walk up attic has vinyl siding and replacement windows. Roofs on both the house and garage were replaced under current ownership. There is a large 4 car garage, perfect for cars, storage or workshop space. It has a wonderful location, convenient to schools, shopping and highway access. Rents are below market. With some updates, you will have a great owner occupied or investment property. Open House Saturday, 1/31, from 11:00 to 1:00 p.m..
-
2026-01-27$284,500 New 500-char remark
Show marketing remark (500 chars)
Once a single family home, this solid 2 family with walk up attic has vinyl siding and replacement windows. Roofs on both the house and garage were replaced under current ownership. There is a large 4 car garage, perfect for cars, storage or workshop space. It has a wonderful location, convenient to schools, shopping and highway access. Rents are below market. With some updates, you will have a great owner occupied or investment property. Open House Saturday, 1/31, from 11:00 to 1:00 p.m..
-
2007-01-05soldstatus $172,000 288-char remark
Show marketing remark (288 chars)
Enjoy relaxing on the wrap around porch of this nicely maintained home. Easy maintenance with vinyl siding, replacement windows and blown-in insulation. There are in-law apartment possibilities and a large 4 stall garage for workshop space and storage. Convenient to schools and shopping.
-
2007-01-05soldstatus $172,000
Show marketing remark (288 chars)
Enjoy relaxing on the wrap around porch of this nicely maintained home. Easy maintenance with vinyl siding, replacement windows and blown-in insulation. There are in-law apartment possibilities and a large 4 stall garage for workshop space and storage. Convenient to schools and shopping.
-
2006-05-16$182,000 288-char remark
Show marketing remark (288 chars)
Enjoy relaxing on the wrap around porch of this nicely maintained home. Easy maintenance with vinyl siding, replacement windows and blown-in insulation. There are in-law apartment possibilities and a large 4 stall garage for workshop space and storage. Convenient to schools and shopping.
ⓘ Source: listings_history table (triggers on properties + properties_extension) + one-shot
backfill from property_details.listing_events for pre-trigger history.
Tax reassessment forecast MA · Partial reset (capped growth)
- Current annual tax
- $4,358 · $363/mo
- Projected year-2 tax
- $4,358 · $363/mo
- Expected delta
- $0/yr ($0/mo · 0.0%)
ⓘ Screening estimate from a state-policy table — verify with the county assessor before closing.
Climate risk First Street
- Flood 1/10 Low FEMA zone X · 0% chance over 30 yrs
- Wildfire 1/10 Low
- Heat 4/10 Moderate 7 d/yr ≥96°F today · 16 d/yr by 30 yrs out
- Wind 4/10 Moderate 15% chance of damaging wind over 30 yrs
- Air quality 2/10 Low 0 unhealthy d/yr today · 1 by 30 yrs out
Nearby sold comps map
Loading sold comps map…
Walkable amenities ~0.75 mi
Loading nearby amenities…
Taxation est. · year 1
- Rental income
- $25,100
- − Mortgage interest
- −$15,376
- − Property taxes
- −$4,358
- − Insurance
- −$1,372
- − Repairs & maintenance
- −$2,008
- − Management
- −$2,008
- − Depreciation
- −$7,985
- Taxable loss
- −$8,008
- Est. tax savings @ 24.0%
- +$1,922
- After-tax cash flow
- $-1,253/yr
For passive investors: Depreciation is non-cash, so a rental often shows a tax loss while cash-flowing — sheltering income. Rental losses are passive: they offset passive income freely, and up to $25,000/yr can offset ordinary (W-2) income if you actively participate and your MAGI is under $100k (phasing out to $0 by $150k); unused losses carry forward. On sale, claimed depreciation is recaptured at up to 25%, and gains may owe capital-gains tax (a 1031 exchange can defer both). Figures are a year-1 estimate at your 24.0% rate — not tax advice; consult a CPA.
Schools (NCES district)
- District
- Greenfield
- NCES district ID
- 2505490
- Math proficiency
- 15% ▼ -15.00%
- Reading proficiency
- 32% ▼ -1.00%
- Median HH income
- $46,910
- Composite
- 20.45/100
- National rank
- #8580
- State rank
- #279 of 302 in MA
Livability — Greenfield
No livability data for this city. (Only ~50 U.S. cities are tracked.)
Census & demographics
- Census place
- Greenfield, MA
- County
- Franklin County · 17,876 people
- City population
- 17,876
- Metro
- Springfield, MA
- Population (ZIP)
- 17,876
- Household income
- $56,176
- Rent vs Own
- Severe rent burden
- 1270.0
Population outlook (Franklin County) Hauer SSP2
- Today (2025)
- 68,566 people
- By 2030
- 66,543 · -3.0%
- By 2040
- 60,766 · -11.4%
- By 2050
- 54,971 · -19.8%
- By 2075
- 42,642 · -37.8%
- By 2100
- 31,861 · -53.5%
Race, ethnicity, and origin ACS 2023
- Neighborhood character
- Predominantly White (87%)
- Race & ethnicity
- White 87% Hispanic / Latino 6% Two or more races 4% Black 2% Asian 2%
- Hispanic origin (detail)
- Puerto Rican 3%
- Common ancestry
- Lithuanian 9% Romanian 7% Slovak 2%
- Foreign-born
- 6% · Canada, China, Jamaica
- Languages at home
- 92% English-only · Spanish 4% Other Indo-European 1% Chinese 1%
Political lean MEDSL · Franklin
- 2024 margin
- Solid D (+37.8) · D 67.3% · R 29.6% · Other 3.1%
- 2008→2024 swing
- -9.9pp toward R · 2008: 47.7pp · 2024: 37.8pp
- All cycles
- 2024: D+37.8 2020: D+44.4 2016: D+37.0 2012: D+47.0 2008: D+47.7
Not yet ingested
- Civics
- —
Market trends
- HPI YoY
- ▼ -85.80%
- Current HPI
- 272.1354
- Rent YoY
- —
- Metro
- Springfield, MA
- State GDP YoY
- ▲ 2.28%
- F500 in state
- 38
Industry mix (Fortune 500 HQ in MA)
| Industry | F500 HQs | Revenue |
|---|---|---|
| Technology | 3 | $17B |
|
||
| Insurance | 2 | $84B |
|
||
| Retail | 2 | $76B |
|
||
| Life Sciences | 1 | $43B |
|
||
| Energy Technology | 1 | $31B |
|
||
| Aerospace / Defense | 1 | $18B |
|
||
Price history
+50.8% since first listed5 events — show timeline
- 2026-04-13 Price Changed $274,500 MLS PIN
- 2026-01-27 Listed $284,500 MLS PIN
- 2007-01-05 Sold (Public Records) $172,000 Public Records
- 2007-01-05 Sold (MLS) $172,000 MLS PIN
- 2006-05-16 Listed $182,000 MLS PIN
Property tax history
+3.7%/yrLatest (2023): $4,358 · +1.8% YoY. Source: county tax records.
Cash-flow waterfall
monthlySold comps — $/sqft
last 12 mo · ≤1 miLoading sold comps…