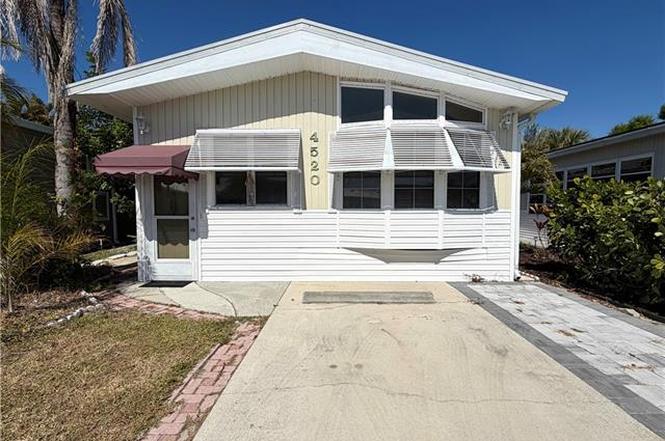
4520 Washington Way E · Estero, FL
Flood risk 7/10 · Major
- FEMA flood zone
- X (shaded)
- Chance of flooding over 30 yrs
- 0.75%
- Est. flood insurance / yr
- $507 – $1,088
Fire risk 4/10 · Minor
- Est. fire insurance / yr
- $947 – $1,759
Heat risk 10/10 · Severe
- Hot days now (above 107°F)
- 7 days/yr
- Hot days in 30 yrs
- 31 days/yr
Wind risk 10/10 · Severe
- Chance of severe wind over 30 yrs
- 99.0%
Air-quality risk 3/10 · Minor
- Unhealthy air days now
- 2 days/yr
- Unhealthy air days in 30 yrs
- 2 days/yr
Risk factors via First Street. Map © Google.
Why this score? — see what drove the D+ grade
The composite is a weighted blend of 9 inputs, each scored 0–100. Each bar is that input's sub-score; the figure is the points it added to the 100-point composite (weight × sub-score).
- Cash flow +20.9/30.0
- 1% rule +7.8/10.0
- DSCR +6.6/10.0
- Schools +4.1/10.0
- Livability +4.0/5.0
- Condition / age +2.5/5.0
- Rent growth +2.1/5.0
- ARV discount +0.0/15.0
- Appreciation +0.0/10.0
$140,000
🖨 Deal sheet (PDF) 📄 Offer letter ✓ Due diligence
Listing remarks
Welcome to this lovely 1992 Chariot manufactured home, featuring a spacious 24 x 38 layout that offers both comfort and style. This delightful one-bedroom, one-bath residence is perfect for pet lovers, providing a welcoming environment for your furry friends. The home showcases a generous living room area, providing ample space for relaxation and entertainment. Natural light flows through the windows, creating a warm and inviting atmosphere. The well-appointed kitchen makes meal preparation a joy, ensuring you have everything you need at your fingertips. Step outside to discover a beautifully designed outdoor space featuring paver stones, perfect for enjoying your morning coffee or evening
Key facts
- Living room area
- Backyard
- Paver stones
Tags
Property features AI
Finance
- Other: Community type: Mobile/Manufactured, Non-Gated; 640 units in complex; single unit per building; Zoning code: RV; Restrictions: Architectural, Deeded, No Commercial
- HOA & community: Mandatory HOA; Quarterly HOA fee of $890 (total annual recurring fees $3,560); One-time fees $250; On-site management; HOA covers cable, irrigation water, lawn/land maintenance, legal/accounting, manager, recreation facilities, reserve, sewer, street lights, street maintenance, trash removal, water; Community amenities include: clubhouse, community pool, community spa/hot tub, exercise room, tennis, pickleball, shuffleboard, bocce, basketball, volleyball, BBQ/picnic areas, billiards, library, hobby room, common laundry, extra storage, fish cleaning station, community boat ramp, boat storage, dog park, vehicle wash area, underground utilities, streetlight
Exterior
- Parking: Vehicle wash area (community amenity); Boat storage (community amenity)
- Utilities: Central water; Central sewer; Cable available
- Home design: Manufactured residential property; Single-story
- Construction: Built in 1992; Vinyl siding exterior; Shingle roof; Manufactured construction
- Exterior features: Patio; Landscaped area view; Private road access; Boat ramp and water available at dock (community)
Interior
- Kitchen: Range; Microwave; Refrigerator/Freezer
- Bedrooms: 1 bedroom
- Flooring: Carpet; Vinyl
- Bathrooms: 1 full bathroom with a combo tub and shower
- Heating & cooling: Central electric heat; Central electric cooling; Ceiling fans
- Interior features: Turnkey unit; Eat-in kitchen; Laundry in residence; See remarks
- Laundry & utility: Washer; Dryer
Neighborhood map
What this means for you Summary
Snapshot
- This is a 1-bed/1.0-bath manufactured listed at $140k.
Deal economics
- At list price, monthly cash flow is $127 ($2k/yr) — positive.
- The deal already cash-flows at list — no discount required.
- Meets the 1% rule at list price ($2k rent vs $140k).
- Recommended offer: $123k (12.0% below list) — sets the bar for market timing.
- Cap rate 8.0% vs local median 3.4% in Estero — top-decile yield for the area; either an underpriced asset or a hidden risk that comps aren't pricing in. Stress-test before assuming the spread holds.
Location & tenants
- Location reads 79/100 on livability (#149 in FL, #2,242 nationally) — a middle-class / working-renter tenant base. Strengths: crime A+, employment A+, housing A+; Watch: amenities F, commute F, cost of living D-.
- Lee (suburban): math 47% / reading 50% proficiency, ranked #42 of 73 in FL (top 58%) — families likely to look elsewhere, expect single-tenant / working-renter base with shorter leases.
- Zoned schools: Heights Elementary School (math 74% / reading 67%, grade A-, #333 of 2,144 statewide, top 16%, 1,109 students, 38% FRL); Lexington Middle School (math 55% / reading 54%, grade B-, #183 of 571 statewide, top 34%, 1,138 students, 44% FRL); South Fort Myers High School (math 23% / reading 30%, grade F, #489 of 667 statewide, top 74%, 1,917 students, 50% FRL).
- Market conditions: Rents soft (-1.4%/yr); 674 active listings in the ZIP; 13 comparable units currently listed for rent nearby; rentals at typical pace (median 21d on market — plan ~3-4 weeks tenant-placement turnaround); solid renter incomes; 15,411 units permitted in Lee County in 2024 (4,686 in 5+ unit buildings).
Forward outlook
- Local home prices are declining (-3.0%/yr); year-one equity from $968 of loan paydown is wiped out by about $4k of value loss. Plan a longer hold.
- Lee County population projected at +44% by 2050 — long-run rental-demand tailwind backs the buy-and-hold thesis.
Negotiation context
- It's been on market 134 days — a 12% lower offer ($123k) is reasonable based on typical stale-listing flexibility.
- Current owner paid $74k; list at $140k implies a 89% gain — meaningful room to come down on a strong offer.
Risks & watch-outs
- Watch-outs: flood insurance adds $66/mo.
- Climate carrying-cost: major flood risk; severe wind risk, 99% chance of damaging wind over 30y; extreme-heat days projected 7→31/yr by 2055 (HVAC capex compounding) — expect insurance premiums to compound above CPI over the hold.
Questions for the listing agent
- It's been on market 134 days. Have you received any prior offers? Is the seller open to a 12% concession, seller financing, or rate buy-down credit?
- What's the actual annual flood-insurance premium (NFIP or private), and is the property in a SFHA with mandatory coverage?
- What does the HOA fee cover, when was the last increase, and are there any pending special assessments or reserve-fund shortfalls?
- Why hasn't it sold? Are there any deal-killer items the seller is aware of (foundation, flood, title, zoning, code violations)?
- Is there a deadline driving the sale (1031 exchange, divorce, estate, relocation)? That informs how much negotiation room exists.
- Schools are A-rated — typically a magnet for longer-tenancy family renters. What's the average tenant stay here, and is there a school-zone premium baked into asking?
- The area grade is low — what's the realistic commute time and amenity access for the typical tenant pool here? Any planned neighborhood developments (good or bad) we should know about?
- What's the average days-on-market for RENTAL listings here right now (not sales)? A rising rental-DOM trend means longer vacancies and softer asking-rent achievability than the comps imply.
- What's the recent tenant-quality profile in this submarket — average credit score on applications, eviction rate, late-payment / NSF rate, and stable-employment percentage? A property-management company in the area should have these aggregated.
- How much new for-sale + rental construction is in the pipeline within 1–3 miles? Heavy new supply typically softens prices + rents 12–24 months out; constrained supply supports both.
Investment metrics
- 1% rule
- 1.28% ✓
- Cap rate
- 7.95%
- Cash-on-cash
- 5.93%
- DSCR
- 1.26
- GRM
- 6.5
CMA / ARV
- ARV (on-the-fly)
- $96,014
- Comps found
- 3
Show comp detail 3 sales within ~0.75 mi
| Address | Dist | Beds/Ba | Sqft | Sold | Price | $/sf | Match |
|---|---|---|---|---|---|---|---|
| 4541 Candlestick Ct E | 0.25mi | 1/1.5 | 789 (+0%) | 14mo | $95,000 | $120 | 74 |
| 4700 Robert E Lee Blvd W | 0.24mi | 1/1.0 | 696 (-12%) | 6mo | $85,000 | $122 | 64 |
| 20540 Basin Dr | 0.58mi | 2/2.0 (+1) | 680 (-14%) | 4mo | $128,000 | $188 | 38 |
Match score weights: distance 35% · size 25% · config 20% · recency 20%. Top-matched comps best support the ARV.
Projected returns pro-forma
-3.0% appreciation · 0.0% rent growth · sell at horizon
- IRR
- -14.5%
- Equity multiple
- 0.50×
- Total profit
- $-19,608
- Equity at exit
- $20,874
- IRR
- -13.9%
- Equity multiple
- 0.34×
- Total profit
- $-25,998
- Equity at exit
- $12,105
Cash invested: $39,200 (down + closing). Projections, not guarantees.
Landlord ↔ Tenant lean methodology
- Overall (STATE)
- 87 Strongly Landlord-Friendly
- State Florida
- 87 Strongly Landlord-Friendly · R+3
- County
- — inherits STATE
- City
- — inherits STATE
ZIP-level market 33928
- Rents YoY
- -1.4%
- Active inventory
- 674
- Price-to-rent
- 6.5×
Monthly cashflow live
- Estimated rent
- $1,788 high interval (Pro) →
- Mortgage (P&I)
- −$734
- Tax from tax record
- −$130 /mo · $1,557/yr
- Insurance
- −$58
- Flood insurance flood zone
- −$66 /mo · $798/yr
- HOA
- −$297
- Vacancy / Maint / Mgmt
- −$376
- Net cashflow
- $127
Break-even live
Sensitivity live
| Price | -10% $206 | -5% $167 | +0% $127 | +5% $88 | +10% $48 |
|---|---|---|---|---|---|
| Rent | -10% $-14 | -5% $56 | +0% $127 | +5% $198 | +10% $268 |
| Rate | -1.0pp $198 | -0.5pp $163 | base $127 | +0.5pp $91 | +1.0pp $54 |
UW: 25.0% down · 7.5% · 30yr · 1.5% tax · 5.0% vac · 8.0% maint · 8.0% mgmt
Financing live
Cash to close
- Down payment
- $35,000
- Closing costs
- $4,200
- Reserves months
- —
- Total cash needed
- —
Loan-product check · same deal, 3 products live
Conventional
25% down · 7.5% · 30yr
- Down + closing
- —
- Monthly P&I
- —
- Monthly cashflow
- —
- DSCR
- —
- Eligible?
- —
Personal DTI + credit; lowest rate.
DSCR
20% down · 8.5% · 30yr
- Down + closing
- —
- Monthly P&I
- —
- Monthly cashflow
- —
- DSCR
- —
- Eligible?
- —
No personal income docs; deal must DSCR.
Hard money
10% down · 12.0% · 12mo
- Down + closing
- —
- Monthly P&I
- —
- Monthly cashflow
- —
- DSCR
- —
- Eligible?
- —
Short-term bridge; refi at stabilization.
Rent comps 13 comps
| Address | Beds | Baths | Sqft | Rent | $/sqft | DOM | Units | Dist |
|---|---|---|---|---|---|---|---|---|
| 4751 Lafayette Ln W Estero, FL | 2.0 | 1.0 | 584 | $1,550 | $2.65 | 25d | 1 | 0.33mi |
| 19600 Veduro Cir Fort Myers, FL | 1.0–3.0 | 1.0–2.0 | 993 | $1,649 | $1.66 | 16d | 11 | 0.73mi |
| 7340 Stoney Grove CIR Fort Myers, FL | 1.0–3.0 | 1.0–2.0 | 1106 | $1,640 | $1.48 | 3d | 39 | 0.81mi |
| 19113 Holly Rd Fort Myers, FL | 2.0 | 1.0 | 676 | $1,550 | $2.29 | 23d | 1 | 1.00mi |
| 19091 Holly Rd Fort Myers, FL | 2.0 | 1.0 | 720 | $1,295 | $1.80 | 25d | 1 | 1.02mi |
| 19760 Osprey Cove Blvd #145 Estero, FL | 2.0 | 2.0 | 1121 | $1,500 | $1.34 | 12d | 1 | 1.10mi |
| 18645 Holly Rd Unit 1 Fort Myers, FL | 2.0 | 1.0 | 950 | $1,800 | $1.89 | 20d | 1 | 1.18mi |
| 18543 Iris Rd Fort Myers, FL | 2.0 | 1.0 | 1110 | $1,795 | $1.62 | 16d | 1 | 1.28mi |
| 18448 Iris Rd Fort Myers, FL | 2.0 | 2.0 | 1064 | $2,200 | $2.07 | 23d | 1 | 1.39mi |
| 18448 Iris Rd Fort Myers, FL | 2.0 | 2.0 | 1064 | $2,150 | $2.02 | 13d | 1 | 1.39mi |
| 18448 Iris Rd Fort Myers, FL | 2.0 | 2.0 | 1064 | $2,150 | $2.02 | 12d | 1 | 1.39mi |
| 8208 Matanzas Rd Fort Myers, FL | 2.0 | 1.0 | 896 | $1,899 | $2.12 | 25d | 1 | 1.42mi |
| 7346 Captiva Blvd Fort Myers, FL | 2.0 | 2.0 | 1068 | $1,995 | $1.87 | 25d | 1 | 1.43mi |
HOA detail
- Monthly dues
- $297 · $3,564/yr
Listing history 14 events
-
2026-06-22days on market $140,000 Active 134 DOM
-
2026-06-17days on market $140,000 Active 130 DOM
-
2026-06-16days on market $140,000 Active 129 DOM
-
2026-06-15days on market $140,000 Active 128 DOM
-
2026-06-13days on market $140,000 Active 126 DOM
-
2026-06-10days on market $140,000 Active 123 DOM
-
2026-06-09days on market $140,000 Active 122 DOM
-
2026-06-07days on market $140,000 Active 120 DOM
-
2026-06-02days on market $140,000 Active 115 DOM
-
2026-06-01days on market $140,000 Active 114 DOM
-
2026-06-01days on market $140,000 Active 113 DOM
-
2026-02-07$140,000 Active
-
2002-05-31soldstatus $74,000
-
1984-06-01soldstatus $16,200
ⓘ Source: listings_history table (triggers on properties + properties_extension) + one-shot
backfill from property_details.listing_events for pre-trigger history.
Tax reassessment forecast FL · Resets to sale price
- Current annual tax
- $1,557 · $130/mo
- Projected year-2 tax
- $1,557 · $130/mo
- Expected delta
- $0/yr ($0/mo · 0.0%)
ⓘ Screening estimate from a state-policy table — verify with the county assessor before closing.
Climate risk First Street
- Flood 7/10 Severe FEMA zone X (shaded) · 75% chance over 30 yrs
- Wildfire 4/10 Moderate
- Heat 10/10 Extreme 7 d/yr ≥107°F today · 31 d/yr by 30 yrs out
- Wind 10/10 Extreme 99% chance of damaging wind over 30 yrs
- Air quality 3/10 Moderate 2 unhealthy d/yr today · 2 by 30 yrs out
Nearby sold comps map
Loading sold comps map…
Walkable amenities ~0.75 mi
Loading nearby amenities…
Taxation est. · year 1
- Rental income
- $21,460
- − Mortgage interest
- −$7,842
- − Property taxes
- −$1,557
- − Insurance
- −$1,498
- − Repairs & maintenance
- −$1,717
- − Management
- −$1,717
- − HOA
- −$3,564
- − Depreciation
- −$4,073
- Taxable loss
- −$506
- Est. tax savings @ 24.0%
- +$121
- After-tax cash flow
- $1,647/yr
For passive investors: Depreciation is non-cash, so a rental often shows a tax loss while cash-flowing — sheltering income. Rental losses are passive: they offset passive income freely, and up to $25,000/yr can offset ordinary (W-2) income if you actively participate and your MAGI is under $100k (phasing out to $0 by $150k); unused losses carry forward. On sale, claimed depreciation is recaptured at up to 25%, and gains may owe capital-gains tax (a 1031 exchange can defer both). Figures are a year-1 estimate at your 24.0% rate — not tax advice; consult a CPA.
Schools (NCES district)
- District
- Lee
- NCES district ID
- 1201080
- Math proficiency
- 47% ▼ -11.00%
- Reading proficiency
- 50% ▼ -4.00%
- Median HH income
- $49,518
- Composite
- 41.49/100
- National rank
- #3458
- State rank
- #42 of 73 in FL
Livability — Estero
- Score
- 79/100
- State rank
- #149
- US rank
- #2242
Category grades
Schools grade is shown separately in the Schools card above.
Census & demographics
- Census place
- Estero, FL
- County
- Lee County · 788,662 people
- City population
- 31,926
- Metro
- Cape Coral-Fort Myers, FL
- Population (ZIP)
- 31,926
- Household income
- $102,624
- Rent vs Own
- Severe rent burden
- 606.0
Population outlook (Lee County) Hauer SSP2
- Today (2025)
- 871,946 people
- By 2030
- 955,468 · +9.6%
- By 2040
- 1,113,587 · +27.7%
- By 2050
- 1,256,891 · +44.1%
- By 2075
- 1,560,270 · +78.9%
- By 2100
- 1,726,848 · +98.0%
Race, ethnicity, and origin ACS 2023
- Neighborhood character
- Predominantly White (85%)
- Race & ethnicity
- White 85% Hispanic / Latino 8% Two or more races 7% Asian 3% Black 1%
- Hispanic origin (detail)
- Mexican 2% Puerto Rican 2% Cuban 1%
- Common ancestry
- Romanian 5% Lithuanian 3% Slovak 2%
- Foreign-born
- 11% · Canada, China, Jamaica
- Languages at home
- 90% English-only · Spanish 5% Other Indo-European 1% French/Haitian/Cajun 1%
Political lean MEDSL · Lee
- 2024 margin
- Strong R (+28.4) · D 35.5% · R 63.9%
- 2008→2024 swing
- -18.0pp toward R · 2008: -10.4pp · 2024: -28.4pp
- All cycles
- 2024: R+28.4 2020: R+19.2 2016: R+20.4 2012: R+16.6 2008: R+10.4
Not yet ingested
- Civics
- —
Market trends
- HPI YoY
- ▼ -109.49%
- Current HPI
- 197.5913
- Rent YoY
- ▼ -1.42%
- Metro
- Cape Coral-Fort Myers, FL
- State GDP YoY
- ▲ 3.28%
- F500 in state
- 36
Industry mix (Fortune 500 HQ in FL)
| Industry | F500 HQs | Revenue |
|---|---|---|
| Industrial Technology | 2 | $29B |
|
||
| Insurance | 2 | $17B |
|
||
| Retail | 1 | $60B |
|
||
| Technology Distribution | 1 | $58B |
|
||
| Homebuilding | 1 | $35B |
|
||
| Technology Manufacturing | 1 | $35B |
|
||
Price history
+764.2% since first listed3 events — show timeline
- 2026-02-07 Listed $140,000 BEARMLS
- 2002-05-31 Sold (Public Records) $74,000 Public Records
- 1984-06-01 Sold (Public Records) $16,200 Public Records
Property tax history
+4.4%/yrLatest (2025): $1,557 · -3.2% YoY. Source: county tax records.
Cash-flow waterfall
monthlySold comps — $/sqft
last 12 mo · ≤1 miLoading sold comps…