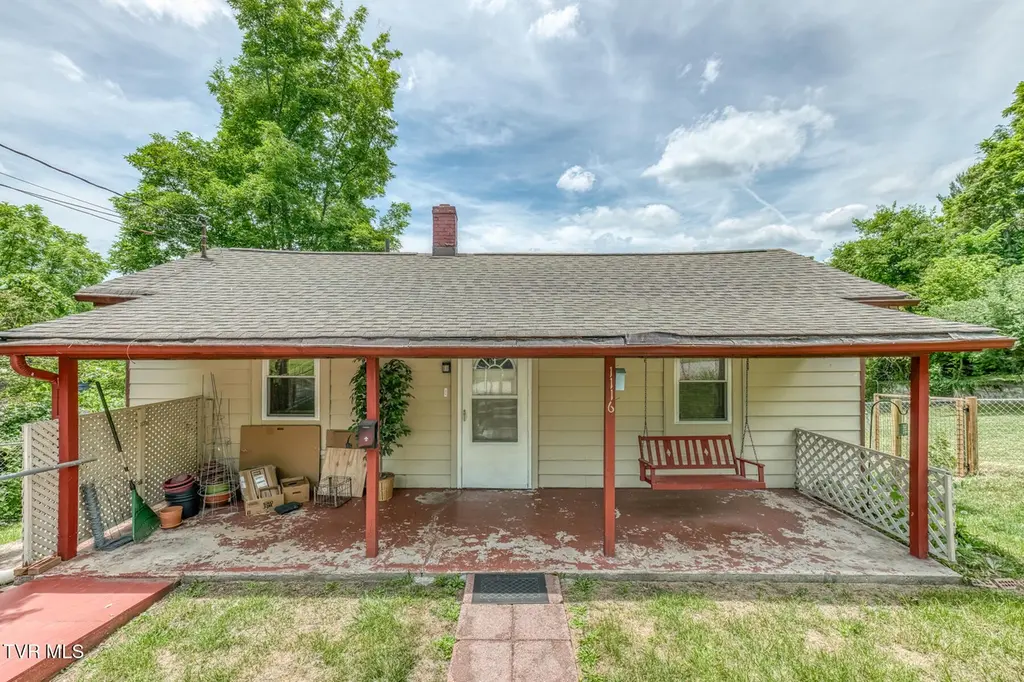
1116 Corporation St · Bristol, VA
Flood risk 1/10 · Minimal
- FEMA flood zone
- X (unshaded)
- Chance of flooding over 30 yrs
- 0.0%
- Est. flood insurance / yr
- $473 – $860
Fire risk 3/10 · Minor
- Est. fire insurance / yr
- $666 – $1,236
Heat risk 4/10 · Minor
- Hot days now (above 98°F)
- 7 days/yr
- Hot days in 30 yrs
- 21 days/yr
Wind risk 2/10 · Minimal
- Chance of severe wind over 30 yrs
- —
Air-quality risk 2/10 · Minimal
- Unhealthy air days now
- 1 days/yr
- Unhealthy air days in 30 yrs
- 2 days/yr
Risk factors via First Street. Map © Google.
Why this score? — see what drove the B+ grade
The composite is a weighted blend of 9 inputs, each scored 0–100. Each bar is that input's sub-score; the figure is the points it added to the 100-point composite (weight × sub-score).
- Cash flow +30.0/30.0
- ARV discount +15.0/15.0
- 1% rule +10.0/10.0
- DSCR +10.0/10.0
- Schools +5.2/10.0
- Livability +3.7/5.0
- Rent growth +2.5/5.0
- Condition / age +2.5/5.0
- Appreciation +0.0/10.0
$94,500
🖨 Deal sheet 📄 Offer letter ✓ Due diligence
Listing remarks
Affordable opportunity with plenty of potential! Situated on a spacious lot that backs up to two different streets, 1116 Corporate Street offers possibilities that are hard to find at this price point. This 3-bedroom, 1-bath home features a functional layout and could make an excellent rental property, investment opportunity, fix-and-flip project, or affordable option for a first-time home buyer willing to add their own improvements over time. The large lot provides room for additional parking, outdoor living space, gardening, or future projects. With solid curb appeal, a desirable lot, and plenty of upside for the right buyer, this property is ready for its next chapter. Whether you're loo
Key facts
- 0.23 acre lot
- Built 1941
- Listed 5 days
Property features AI
Exterior
- Utilities: Public water; Public sewer
- Home design: Single-family house; Residential property; Not in a subdivision
- Construction: Vinyl siding; Asphalt shingle roof; Built with a finished below-grade area
- Exterior features: Front porch; Back yard fencing; Shed(s); Sloped lot
Interior
- Kitchen: Electric range; Refrigerator
- Flooring: Carpet; Laminate; Vinyl
- Bathrooms: 1 full bathroom
- Heating & cooling: Oil heating; No central cooling
- Interior features: Finished basement; Total of 6 rooms
- Laundry & utility: Washer hookup; Electric dryer hookup
Neighborhood map
What this means for you Summary
Snapshot
- This is a 3-bed/1.0-bath single-family listed at $94k.
Deal economics
- At list price, monthly cash flow is $938 ($11k/yr) — positive.
- The deal already cash-flows at list — no discount required.
- Meets the 1% rule at list price ($2k rent vs $94k).
- Cap rate 18.2% vs local median 4.9% in Bristol — top-decile yield for the area; either an underpriced asset or a hidden risk that comps aren't pricing in. Stress-test before assuming the spread holds.
Location & tenants
- Location reads 74/100 on livability (#140 in VA, #4,544 nationally) — a middle-class / working-renter tenant base. Strengths: cost of living A+, housing A+, health & safety A+; Watch: crime F, commute F, employment F.
- Bristol City Public School District (urban): math 57% / reading 70% proficiency, ranked #53 of 131 in VA (top 40%) — acceptable for families but not a draw, mixed tenant base, ~2y average lease.
- Zoned schools: Highland View Elementary (math 42% / reading 62%, grade C-, #696 of 1,108 statewide, top 66%, 175 students, 98% FRL); Virginia High (math 62% / reading 77%, grade B, #159 of 319 statewide, top 53%, 637 students, 100% FRL) — zoned schools average 99% FRL vs 58% district-wide (41 pts higher); higher-poverty schools than district average — tighter screening recommended.
- Market conditions: 154 active listings in the ZIP; 5 comparable units currently listed for rent nearby; rentals leasing fast (median 13d on market — plan ~1-2 weeks tenant-placement turnaround); 15 units permitted in Bristol city in 2024 (5 in 5+ unit buildings).
Forward outlook
- Local home prices are declining (-3.0%/yr); year-one equity from $653 of loan paydown is wiped out by about $3k of value loss. Plan a longer hold.
- Bristol County population projected at -20% by 2050 — secular population decline; favor cash flow + early exit over multi-decade hold.
- At projected returns (-3.0% appreciation + 3.0% rent growth), your $26k cash investment doubles in ~3 years — after that, you're playing with house money.
Negotiation context
- Only 6 days on market — expect competitive offers; lowballing is unlikely to land.
Risks & watch-outs
- Watch-outs: built in 1941 — expect roof / HVAC / electrical / plumbing capex.
Questions for the listing agent
- Built in 1941 — when were the roof, HVAC, electrical panel, plumbing, and water heater last replaced?
- Is there a deadline driving the sale (1031 exchange, divorce, estate, relocation)? That informs how much negotiation room exists.
- Schools are A-rated — typically a magnet for longer-tenancy family renters. What's the average tenant stay here, and is there a school-zone premium baked into asking?
- Crime grade is F in this area — have there been break-ins, vandalism, or insurance claims at this property in the last 3 years? What carrier currently insures it and at what premium?
- What's the average days-on-market for RENTAL listings here right now (not sales)? A rising rental-DOM trend means longer vacancies and softer asking-rent achievability than the comps imply.
- What's the recent tenant-quality profile in this submarket — average credit score on applications, eviction rate, late-payment / NSF rate, and stable-employment percentage? A property-management company in the area should have these aggregated.
- How much new for-sale + rental construction is in the pipeline within 1–3 miles? Heavy new supply typically softens prices + rents 12–24 months out; constrained supply supports both.
Investment metrics
- 1% rule
- 2.02% ✓
- Cap rate
- 18.20%
- Cash-on-cash
- 42.54%
- DSCR
- 2.89
- GRM
- 4.1
CMA / ARV
- ARV (on-the-fly)
- $182,942
- Comps found
- 12
Show comp detail 12 sales within ~0.75 mi
| Address | Dist | Beds/Ba | Sqft | Sold | Price | $/sf | Match |
|---|---|---|---|---|---|---|---|
| 623 Fairview St | 0.31mi | 3/2.0 | 2,016 (+7%) | 7mo | $196,000 | $97 | 64 |
| 1009 Massachusetts Ave | 0.39mi | 4/2.0 (+1) | 1,830 (-3%) | 5mo | $78,000 | $43 | 64 |
| 708 Portsmouth Ave | 0.14mi | 4/1.0 (+1) | 1,671 (-11%) | 7mo | $75,000 | $45 | 64 |
| 809 Leona St | 0.30mi | 4/2.0 (+1) | 1,782 (-6%) | 5mo | $125,000 | $70 | 63 |
| 235 Mcdowell St | 0.51mi | 3/2.0 | 1,788 (-5%) | 3mo | $214,900 | $120 | 61 |
| 631 Taylor St | 0.37mi | 3/1.0 | 1,664 (-12%) | 5mo | $232,000 | $139 | 59 |
| 571 Booher Springs Rd | 0.74mi | 3/2.0 | 1,844 (-2%) | 4mo | $350,000 | $190 | 54 |
| 523 Goodson St | 0.40mi | 4/2.0 (+1) | 2,167 (+15%) | 1mo | $40,000 | $18 | 47 |
| 421 Carolina Ave | 0.50mi | 4/1.0 (+1) | 1,647 (-13%) | 7mo | $244,000 | $148 | 45 |
| 539 Madison St | 0.61mi | 4/2.5 (+1) | 2,048 (+9%) | 3mo | $193,000 | $94 | 44 |
| 201 Esther St | 0.56mi | 4/1.0 (+1) | 1,652 (-12%) | 7mo | $157,500 | $95 | 42 |
| 140 Tracy St | 0.61mi | 4/2.0 (+1) | 2,091 (+11%) | 6mo | $289,000 | $138 | 40 |
Match score weights: distance 35% · size 25% · config 20% · recency 20%. Top-matched comps best support the ARV.
Projected returns pro-forma
-3.0% appreciation · 3.0% rent growth · sell at horizon
- IRR
- 39.3%
- Equity multiple
- 2.68×
- Total profit
- $44,411
- Equity at exit
- $14,090
- IRR
- 45.7%
- Equity multiple
- 5.37×
- Total profit
- $115,519
- Equity at exit
- $8,171
Cash invested: $26,460 (down + closing). Projections, not guarantees.
Landlord ↔ Tenant lean methodology
- Overall (STATE)
- 55 Moderately Landlord-Leaning
- State Virginia
- 55 Moderately Landlord-Leaning · D+2
- County
- — inherits STATE
- City
- — inherits STATE
ZIP-level market 24202
- Home prices YoY
- -30.0%
- Active inventory
- 154
- Price-to-rent
- 4.1×
Monthly cashflow live
- Estimated rent
- $1,912 high interval (Pro) →
- Mortgage (P&I)
- −$496
- Tax from tax record
- −$38 /mo · $452/yr
- Insurance
- −$39
- HOA
- −$0
- Vacancy / Maint / Mgmt
- −$402
- Net cashflow
- $938
Break-even live
UW: 25.0% down · 7.5% · 30yr · 1.5% tax · 5.0% vac · 8.0% maint · 8.0% mgmt
Financing live
Cash to close
- Down payment
- $23,625
- Closing costs
- $2,835
- Reserves months
- —
- Total cash needed
- —
Loan-product check · same deal, 3 products live
Conventional
25% down · 7.5% · 30yr
- Down + closing
- —
- Monthly P&I
- —
- Monthly cashflow
- —
- DSCR
- —
- Eligible?
- —
Personal DTI + credit; lowest rate.
DSCR
20% down · 8.5% · 30yr
- Down + closing
- —
- Monthly P&I
- —
- Monthly cashflow
- —
- DSCR
- —
- Eligible?
- —
No personal income docs; deal must DSCR.
Hard money
10% down · 12.0% · 12mo
- Down + closing
- —
- Monthly P&I
- —
- Monthly cashflow
- —
- DSCR
- —
- Eligible?
- —
Short-term bridge; refi at stabilization.
Rent comps 5 comps
| Address | Beds | Baths | Sqft | Rent | $/sqft | DOM | Units | Dist |
|---|---|---|---|---|---|---|---|---|
| 279 Reservoir St Bristol, VA | 3.0 | 1.5 | 1300 | $1,600 | $1.23 | 13d | 1 | 0.15mi |
| 201 Springdale Rd Bristol, TN | 3.0 | 2.0 | 1635 | $2,750 | $1.68 | 43d | 1 | 0.57mi |
| 924 Maryland Ave Unit F Bristol, TN | 2.0 | 2.0 | 1780 | $2,000 | $1.12 | 13d | 1 | 0.75mi |
| 712 Haynes St Bristol, TN | 3.0 | 2.0 | 2228 | $2,100 | $0.94 | 13d | 1 | 1.33mi |
| 314 Crossway Rd Bristol, VA | 2.0 | 2.0 | 1909 | $1,800 | $0.94 | 13d | 1 | 1.44mi |
Listing history 7 events
-
2026-06-19days on market $94,500 Active 6 DOM
-
2026-06-18days on market $94,500 Active 5 DOM
-
2026-06-17days on market $94,500 Active 4 DOM
-
2026-06-16days on market $94,500 Active 3 DOM
-
2026-06-15days on market $94,500 Active 2 DOM
-
2026-06-14remarks 699-char remark
-
2026-06-14$94,500 Active 1 DOM
ⓘ Source: listings_history table (triggers on properties + properties_extension) + one-shot
backfill from property_details.listing_events for pre-trigger history.
Tax reassessment forecast VA · Resets to sale price
- Current annual tax
- $452 · $38/mo
- Projected year-2 tax
- $775 · $65/mo
- Expected delta
- +$323/yr (+$27/mo · 71.4%)
ⓘ Screening estimate from a state-policy table — verify with the county assessor before closing.
Climate risk First Street
- Flood 1/10 Low FEMA zone X (unshaded) · 0% chance over 30 yrs
- Wildfire 3/10 Moderate
- Heat 4/10 Moderate 7 d/yr ≥98°F today · 21 d/yr by 30 yrs out
- Wind 2/10 Low
- Air quality 2/10 Low 1 unhealthy d/yr today · 2 by 30 yrs out
Nearby sold comps map
Loading sold comps map…
Walkable amenities ~0.75 mi
Loading nearby amenities…
Taxation est. · year 1
- Rental income
- $22,947
- − Mortgage interest
- −$5,293
- − Property taxes
- −$452
- − Insurance
- −$472
- − Repairs & maintenance
- −$1,836
- − Management
- −$1,836
- − Depreciation
- −$2,749
- Taxable income
- $10,308
- Est. tax owed @ 24.0%
- −$2,474
- After-tax cash flow
- $8,783/yr
For passive investors: Depreciation is non-cash, so a rental often shows a tax loss while cash-flowing — sheltering income. Rental losses are passive: they offset passive income freely, and up to $25,000/yr can offset ordinary (W-2) income if you actively participate and your MAGI is under $100k (phasing out to $0 by $150k); unused losses carry forward. On sale, claimed depreciation is recaptured at up to 25%, and gains may owe capital-gains tax (a 1031 exchange can defer both). Figures are a year-1 estimate at your 24.0% rate — not tax advice; consult a CPA.
Schools (NCES district)
- District
- Bristol City Public School District
- NCES district ID
- 5100450
- Math proficiency
- 57% ▼ -24.00%
- Reading proficiency
- 70% ▼ -6.00%
- Median HH income
- $33,978
- Composite
- 52.4/100
- National rank
- #1579
- State rank
- #53 of 131 in VA
Livability — Bristol
- Score
- 74/100
- State rank
- #140
- US rank
- #4544
Category grades
Schools grade is shown separately in the Schools card above.
Census & demographics
- Census place
- Bristol, VA
- City population
- 16,039
- Population (ZIP)
- 12,324
Population outlook (Bristol County) Hauer SSP2
- Today (2025)
- 16,113 people
- By 2030
- 15,510 · -3.7%
- By 2040
- 14,121 · -12.4%
- By 2050
- 12,847 · -20.3%
- By 2075
- 9,870 · -38.7%
- By 2100
- 7,883 · -51.1%
Race, ethnicity, and origin ACS 2023
- Neighborhood character
- Predominantly White (94%)
- Race & ethnicity
- White 94% Two or more races 3% Hispanic / Latino 2%
- Common ancestry
- Slovak 2% Portuguese 1% Italian 1%
- Foreign-born
- 1%
- Languages at home
- 97% English-only · Spanish 2% Other Indo-European 1%
Political lean MEDSL · Bristol
- 2024 margin
- Solid R (+39.7) · D 29.8% · R 69.5%
- 2008→2024 swing
- -13.6pp toward R · 2008: -26.0pp · 2024: -39.7pp
- All cycles
- 2024: R+39.7 2020: R+38.9 2016: R+43.8 2012: R+31.1 2008: R+26.0
Not yet ingested
- Civics
- —
Market trends
- HPI YoY
- ▼ -78.07%
- Current HPI
- 182.4415
- Rent YoY
- —
- Metro
- —
- State GDP YoY
- ▲ 2.40%
- F500 in state
- 50
Industry mix (Fortune 500 HQ in VA)
| Industry | F500 HQs | Revenue |
|---|---|---|
| Aerospace / Defense | 4 | $236B |
|
||
| Technology / Defense | 3 | $32B |
|
||
| Financial Services | 2 | $176B |
|
||
| Utilities | 2 | $27B |
|
||
| Insurance | 2 | $25B |
|
||
| Technology | 2 | $15B |
|
||
Price history
1 event — show timeline
- 2026-06-13 Listed $94,500 TVRMLS
Cash-flow waterfall
monthlySold comps — $/sqft
last 12 mo · ≤1 miLoading sold comps…