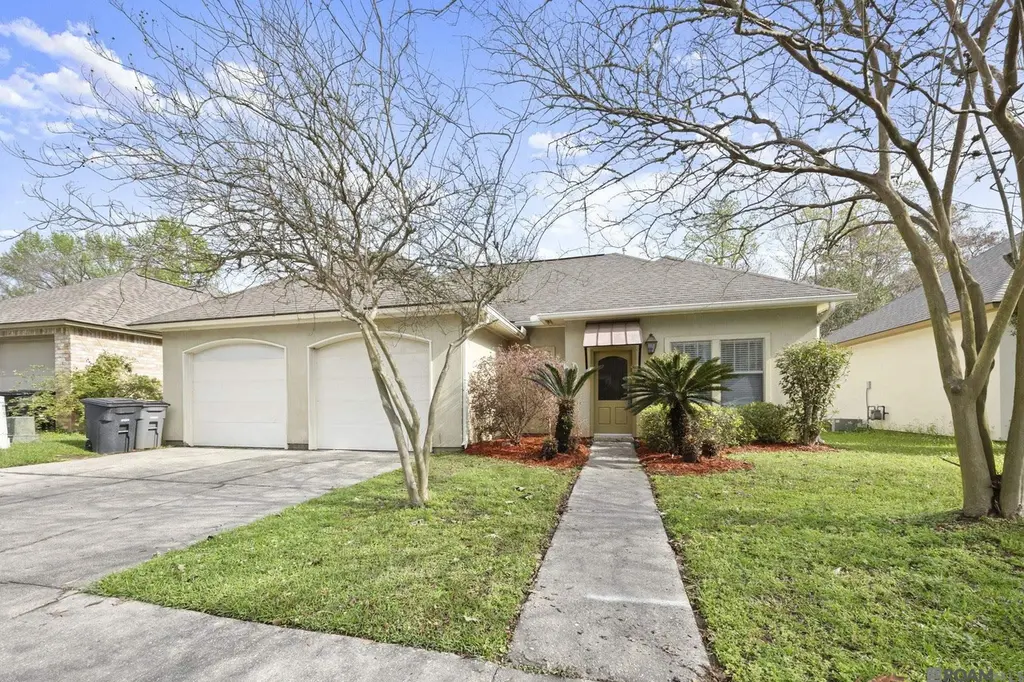
9431 Boone Dr · Baton Rouge, LA
Flood risk 1/10 · Minimal
- FEMA flood zone
- X
- Chance of flooding over 30 yrs
- 0.0%
- Est. flood insurance / yr
- $507 – $1,088
Fire risk 1/10 · Minimal
- Est. fire insurance / yr
- $1,269 – $2,357
Heat risk 8/10 · Major
- Hot days now (above 108°F)
- 7 days/yr
- Hot days in 30 yrs
- 21 days/yr
Wind risk 9/10 · Severe
- Chance of severe wind over 30 yrs
- 99.0%
Air-quality risk 3/10 · Minor
- Unhealthy air days now
- 3 days/yr
- Unhealthy air days in 30 yrs
- 3 days/yr
Risk factors via First Street. Map © Google.
Why this score? — see what drove the D- grade
The composite is a weighted blend of 9 inputs, each scored 0–100. Each bar is that input's sub-score; the figure is the points it added to the 100-point composite (weight × sub-score).
- ARV discount +13.0/15.0
- Cash flow +10.1/30.0
- Livability +3.7/5.0
- DSCR +2.9/10.0
- 1% rule +2.7/10.0
- Rent growth +2.7/5.0
- Condition / age +2.5/5.0
- Schools +2.4/10.0
- Appreciation +0.0/10.0
$255,000
🖨 Deal sheet (PDF) 📄 Offer letter ✓ Due diligence
Listing remarks MLS
LOCATION IS THE KEY! 3 bed 2 bath home located in Santa Rosa subdivision off Staring Lane. This home features an open kitchen with porcelain counters, a peninsula breakfast bar, workstation, split floor plan, and double garage, fireplace with gas logs and a large rear porch/patio. Easy access to LSU, healthcare and shopping/restaurants.
Key facts
- Workstation
- Split floor plan
- Porcelain counters
Tags
Neighborhood map
What this means for you Summary
Snapshot
- This is a 3-bed/2.0-bath single-family listed at $255k.
Deal economics
- At list price, monthly cash flow is $-150 ($-2k/yr) — negative.
- To cash-flow at today's rent, offer at most $228k (10.4% below list).
- To meet the 1% rule (rent ≥ 1% of price), the offer needs to be $196k (23.3% below list).
- Recommended offer: $196k (23.3% below list) — sets the bar for 1% rule.
- Cap rate 5.6% vs local median 4.2% in Baton Rouge — top-decile yield for the area; either an underpriced asset or a hidden risk that comps aren't pricing in. Stress-test before assuming the spread holds.
Location & tenants
- Location reads 74/100 on livability (#24 in LA, #4,535 nationally) — a middle-class / working-renter tenant base. Strengths: commute A+, cost of living A+, health & safety A+; Watch: amenities D, crime F, employment D-.
- East Baton Rouge Parish (urban): math 22% / reading 34% proficiency, ranked #47 of 98 in LA (top 48%) — low school quality limits family demand, transient renter base, plan for 1-2y turnover; 77% free/reduced lunch — lower-income household profile, screen leases tightly.
- Zoned schools: Wildwood Elementary School (math 23% / reading 34%, grade F, #350 of 646 statewide, top 55%, 533 students, 59% FRL); Westdale Middle School (math 15% / reading 30%, grade F, #151 of 218 statewide, top 70%, 757 students, 69% FRL); Liberty High School (math 50% / reading 74%, grade B-, #15 of 265 statewide, top 6%, 1,208 students, 60% FRL).
- Market conditions: Rents flat; 629 active listings in the ZIP; 40 comparable units currently listed for rent nearby; rentals at typical pace (median 25d on market — plan ~3-4 weeks tenant-placement turnaround); solid renter incomes; 2,252 units permitted in East Baton Rouge Parish in 2024 (440 in 5+ unit buildings).
Forward outlook
- Local home prices are declining (-3.0%/yr); year-one equity from $2k of loan paydown is wiped out by about $8k of value loss. Plan a longer hold.
- East Baton Rouge County population projected at +4% by 2050 — modest demand growth; plan on rents tracking national, not racing it.
Negotiation context
- It's been on market 72 days — a 6% lower offer ($240k) is reasonable based on typical stale-listing flexibility.
- 7 sale attempts since 21y ago with the ask held roughly flat each time — persistent listings suggest the price (not the market) is what's stuck; bring a comps-based counter.
Risks & watch-outs
- Climate carrying-cost: severe wind risk, 99% chance of damaging wind over 30y; extreme-heat days projected 7→21/yr by 2055 (HVAC capex compounding) — expect insurance premiums to compound above CPI over the hold.
Questions for the listing agent
- What do current leases actually rent for vs. the listed asking? Can we see a recent rent roll and the last 12 months of T-12 income?
- It's been on market 72 days. Have you received any prior offers? Is the seller open to a 23% concession, seller financing, or rate buy-down credit?
- What does the HOA fee cover, when was the last increase, and are there any pending special assessments or reserve-fund shortfalls?
- Why hasn't it sold? Are there any deal-killer items the seller is aware of (foundation, flood, title, zoning, code violations)?
- Is there a deadline driving the sale (1031 exchange, divorce, estate, relocation)? That informs how much negotiation room exists.
- Crime grade is F in this area — have there been break-ins, vandalism, or insurance claims at this property in the last 3 years? What carrier currently insures it and at what premium?
- The area grade is low — what's the realistic commute time and amenity access for the typical tenant pool here? Any planned neighborhood developments (good or bad) we should know about?
- What's the average days-on-market for RENTAL listings here right now (not sales)? A rising rental-DOM trend means longer vacancies and softer asking-rent achievability than the comps imply.
- What's the recent tenant-quality profile in this submarket — average credit score on applications, eviction rate, late-payment / NSF rate, and stable-employment percentage? A property-management company in the area should have these aggregated.
- How much new for-sale + rental construction is in the pipeline within 1–3 miles? Heavy new supply typically softens prices + rents 12–24 months out; constrained supply supports both.
Investment metrics
- 1% rule
- 0.77% ✗
- Cap rate
- 5.59%
- Cash-on-cash
- -2.52%
- DSCR
- 0.89
- GRM
- 10.9
CMA / ARV
- ARV (median comp)
- $290,431
- List price
- $255,000
- Delta
- -12.20%
- Verdict
- UNDERPRICED
- Comps
- 20 within 1.0 mi
Show comp detail 12 sales within ~0.75 mi
| Address | Dist | Beds/Ba | Sqft | Sold | Price | $/sf | Match |
|---|---|---|---|---|---|---|---|
| 9239 Asoka Ave | 0.18mi | 3/2.0 | 1,538 (+2%) | 3mo | $299,000 | $194 | 86 |
| 9421 Worthington Lake Ave | 0.10mi | 3/2.0 | 1,414 (-7%) | 0mo | $255,000 | $180 | 84 |
| 9215 Asoka Ave | 0.23mi | 3/2.0 | 1,629 (+8%) | 1mo | $302,500 | $186 | 76 |
| 9004 Boone Dr | 0.40mi | 3/2.0 | 1,469 (-3%) | 1mo | $279,000 | $190 | 76 |
| 473 Lake Worth Dr | 0.24mi | 3/2.0 | 1,404 (-7%) | 2mo | $250,000 | $178 | 74 |
| 9114 Magnolia Leaf Ave | 0.32mi | 3/2.0 | 1,634 (+8%) | 3mo | $310,000 | $190 | 70 |
| 9216 Magnolia Leaf Ave | 0.27mi | 3/2.0 | 1,690 (+12%) | 1mo | $310,000 | $183 | 68 |
| 721 Hudsons Way | 0.41mi | 3/2.0 | 1,634 (+8%) | 2mo | $300,000 | $184 | 66 |
| 9444 Kingcrest Pkwy | 0.44mi | 3/1.5 | 1,334 (-12%) | 2mo | $194,500 | $146 | 56 |
| 8929 Worthington Estates Ave | 0.47mi | 4/2.0 (+1) | 1,687 (+11%) | 3mo | $275,000 | $163 | 52 |
| 8810 Southlawn Dr | 0.56mi | 3/2.0 | 1,740 (+15%) | 2mo | $320,000 | $184 | 47 |
| 1220 Doolittle Dr | 0.57mi | 4/2.0 (+1) | 1,717 (+13%) | 3mo | $209,000 | $122 | 44 |
Match score weights: distance 35% · size 25% · config 20% · recency 20%. Top-matched comps best support the ARV.
Projected returns pro-forma
-3.0% appreciation · 0.68% rent growth · sell at horizon
- IRR
- -23.0%
- Equity multiple
- 0.22×
- Total profit
- $-55,363
- Equity at exit
- $38,021
- IRR
- -24.7%
- Equity multiple
- -0.09×
- Total profit
- $-78,055
- Equity at exit
- $22,048
Cash invested: $71,400 (down + closing). Projections, not guarantees.
Landlord ↔ Tenant lean methodology
- Overall (STATE)
- 90 Strongly Landlord-Friendly
- State Louisiana
- 90 Strongly Landlord-Friendly · R+12
- County
- — inherits STATE
- City
- — inherits STATE
ZIP-level market 70810
- Rents YoY
- 0.7%
- Active inventory
- 629
- Price-to-rent
- 10.9×
Monthly cashflow live
- Estimated rent
- $1,956 high interval (Pro) →
- Mortgage (P&I)
- −$1,337
- Tax from tax record
- −$237 /mo · $2,842/yr
- Insurance
- −$106
- HOA
- −$15
- Vacancy / Maint / Mgmt
- −$411
- Net cashflow
- $-150
Break-even live
Sensitivity live
| Price | -10% $-6 | -5% $-78 | +0% $-150 | +5% $-222 | +10% $-295 |
|---|---|---|---|---|---|
| Rent | -10% $-305 | -5% $-227 | +0% $-150 | +5% $-73 | +10% $4 |
| Rate | -1.0pp $-22 | -0.5pp $-85 | base $-150 | +0.5pp $-216 | +1.0pp $-284 |
UW: 25.0% down · 7.5% · 30yr · 1.5% tax · 5.0% vac · 8.0% maint · 8.0% mgmt
Financing live
Cash to close
- Down payment
- $63,750
- Closing costs
- $7,650
- Reserves months
- —
- Total cash needed
- —
Loan-product check · same deal, 3 products live
Conventional
25% down · 7.5% · 30yr
- Down + closing
- —
- Monthly P&I
- —
- Monthly cashflow
- —
- DSCR
- —
- Eligible?
- —
Personal DTI + credit; lowest rate.
DSCR
20% down · 8.5% · 30yr
- Down + closing
- —
- Monthly P&I
- —
- Monthly cashflow
- —
- DSCR
- —
- Eligible?
- —
No personal income docs; deal must DSCR.
Hard money
10% down · 12.0% · 12mo
- Down + closing
- —
- Monthly P&I
- —
- Monthly cashflow
- —
- DSCR
- —
- Eligible?
- —
Short-term bridge; refi at stabilization.
Rent comps 40 comps
| Address | Beds | Baths | Sqft | Rent | $/sqft | DOM | Units | Dist |
|---|---|---|---|---|---|---|---|---|
| 9441 Boone Dr Baton Rouge, LA | 3.0 | 2.0 | 1611 | $2,050 | $1.27 | 25d | 1 | 0.04mi |
| 9176 Boone Dr Baton Rouge, LA | 3.0 | 2.0 | 1469 | $1,950 | $1.33 | 45d | 1 | 0.24mi |
| 9144 High Point Rd Baton Rouge, LA | 4.0 | 2.0 | 2050 | $2,100 | $1.02 | 16d | 1 | 0.46mi |
| 9144 High Point Rd Baton Rouge, LA | 4.0 | 2.0 | 2050 | $2,100 | $1.02 | 25d | 1 | 0.46mi |
| 560 Staring Ln Baton Rouge, LA | 3.0 | 1.5 | 1423 | $1,750 | $1.23 | 23d | 1 | 0.50mi |
| 8500 Bluebonnet Blvd #24 Baton Rouge, LA | 3.0 | 2.0 | 1430 | $1,600 | $1.12 | 21d | 1 | 0.56mi |
| 8008 Bluebonnet Blvd Baton Rouge, LA | 1.0–3.0 | 1.0–2.0 | 1071 | $1,994 | $1.86 | 16d | 10 | 0.63mi |
| 10624 Glenstone Ct Baton Rouge, LA | 2.0–3.0 | 2.0 | 1032 | $1,271 | $1.23 | 45d | 2 | 0.68mi |
| 9516 Thayer Ave Baton Rouge, LA | 3.0 | 2.0 | 1596 | $1,950 | $1.22 | 45d | 1 | 0.85mi |
| 10642 Molly Ave Baton Rouge, LA | 3.0 | 2.0 | 1950 | $2,300 | $1.18 | 25d | 1 | 0.89mi |
| 10734 Erin Vale Ave Baton Rouge, LA | 3.0 | 2.0 | 1614 | $2,000 | $1.24 | 46d | 1 | 0.99mi |
| 809 Summer Breeze Dr #1108 Baton Rouge, LA | 3.0 | 2.0 | 1200 | $1,450 | $1.21 | 25d | 1 | 1.00mi |
| 10156 Perkins Rowe Baton Rouge, LA | 1.0–4.0 | 1.0–4.0 | 1433 | $2,745 | $1.92 | 16d | 23 | 1.01mi |
| 717 Summer Breeze Dr Baton Rouge, LA | 3.0 | 2.0 | 1750 | $2,000 | $1.14 | 25d | 1 | 1.06mi |
| 8457 Governor Dr Unit 8457-A Baton Rouge, LA | 2.0 | 1.5 | 1100 | $1,000 | $0.91 | 45d | 1 | 1.06mi |
| 10201 Park Rowe Ave Baton Rouge, LA | 1.0–3.0 | 1.0–2.0 | 1036 | $2,428 | $2.34 | 16d | 18 | 1.11mi |
| 8262 Governor Dr Unit 8262-A Baton Rouge, LA | 3.0 | 3.0 | 1400 | $1,400 | $1.00 | 16d | 1 | 1.13mi |
| 9477 Macedonia Ave Baton Rouge, LA | 4.0 | 2.0 | 1604 | $1,950 | $1.22 | 25d | 1 | 1.15mi |
| 8220 Governor Dr Baton Rouge, LA | 3.0 | 2.0 | 1350 | $1,350 | $1.00 | 21d | 1 | 1.16mi |
| 8231 Bayou Fountain Ave Unit 8231-1 Baton Rouge, LA | 2.0 | 2.0 | 1250 | $1,200 | $0.96 | 16d | 1 | 1.16mi |
| 8216 Governor Dr Baton Rouge, LA | 3.0 | 2.0 | 1212 | $1,350 | $1.11 | 25d | 1 | 1.16mi |
| 8185 Bayou Fountain Ave Unit 8185-2 Baton Rouge, LA | 2.0 | 1.5 | 1200 | $1,045 | $0.87 | 25d | 1 | 1.20mi |
| 7072 Kodiak Dr Baton Rouge, LA | 3.0 | 2.0 | 1650 | $3,450 | $2.09 | 25d | 1 | 1.22mi |
| 8336 Bayou Fountain Ave Unit 8336-D Baton Rouge, LA | 2.0 | 1.5 | 1110 | $1,045 | $0.94 | 16d | 1 | 1.22mi |
| 10157 Bonnet Cove Ave Baton Rouge, LA | 3.0 | 3.0 | 1785 | $1,900 | $1.06 | 45d | 1 | 1.22mi |
| 8091 Bayou Fountain Ave Baton Rouge, LA | 2.0 | 2.5 | 1100 | $1,195 | $1.09 | 45d | 1 | 1.22mi |
| 553 Westhaven Blvd Unit 1519869P Baton Rouge, LA | 3.0 | 2.0 | 1797 | $3,688 | $2.05 | 16d | 1 | 1.24mi |
| 7743 Bles Ave Unit 1B Baton Rouge, LA | 2.0 | 2.0 | 1050 | $1,000 | $0.95 | 25d | 1 | 1.26mi |
| 10440 Cotton Ln Baton Rouge, LA | 3.0 | 2.5 | 1771 | $3,600 | $2.03 | 23d | 1 | 1.30mi |
| 9536 Bermuda Ave Baton Rouge, LA | 4.0 | 2.0 | 2040 | $2,000 | $0.98 | 25d | 1 | 1.31mi |
| 11430 Cotton Ln Baton Rouge, LA | 3.0 | 2.5 | 1771 | $3,400 | $1.92 | 45d | 1 | 1.32mi |
| 11432 Cotton Ln Baton Rouge, LA | 3.0 | 2.5 | 1771 | $3,400 | $1.92 | 45d | 1 | 1.32mi |
| 777 Hadley Dr Baton Rouge, LA | 3.0 | 2.0 | 1405 | $1,900 | $1.35 | 23d | 1 | 1.33mi |
| 10600 Lakes Blvd Baton Rouge, LA | 1.0–3.0 | 1.0–3.0 | 1425 | $2,100 | $1.47 | 25d | 4 | 1.33mi |
| 10600 Lakes Blvd Baton Rouge, LA | 3.0 | 3.0 | 1464 | $1,850 | $1.26 | 45d | 2 | 1.33mi |
| 10600 Lakes Blvd Baton Rouge, LA | 2.0–3.0 | 2.5–3.0 | 1420 | $2,250 | $1.58 | 16d | 4 | 1.33mi |
| 735 Bromley Dr Baton Rouge, LA | 3.0 | 2.0 | 2000 | $2,300 | $1.15 | 25d | 1 | 1.35mi |
| 8505 Aston Ave Baton Rouge, LA | 4.0 | 2.0 | 1875 | $2,300 | $1.23 | 16d | 1 | 1.36mi |
| 1859 Southpointe Dr #3 Baton Rouge, LA | 2.0 | 1.5 | 1113 | $950 | $0.85 | 45d | 1 | 1.37mi |
| 641 Greenwich Dr Baton Rouge, LA | 3.0 | 2.0 | 1973 | $2,400 | $1.22 | 25d | 1 | 1.38mi |
HOA detail
- Monthly dues
- $15 · $180/yr
- Likely covers
- gas
Listing history 31 events
-
2026-06-22days on market $255,000 Active 72 DOM
-
2026-06-18days on market $255,000 Active 69 DOM
-
2026-06-17days on market $255,000 Active 68 DOM
-
2026-06-16days on market $255,000 Active 67 DOM
-
2026-06-15days on market $255,000 Active 66 DOM
-
2026-06-14days on market $255,000 Active 64 DOM
-
2026-06-10days on market $255,000 Active 61 DOM
-
2026-06-09days on market $255,000 Active 60 DOM
-
2026-06-08days on market $255,000 Active 59 DOM
-
2026-06-07days on market $255,000 Active 58 DOM
-
2026-06-05days on market $255,000 Active 55 DOM
-
2026-06-03days on market $255,000 Active 54 DOM
-
2026-06-02days on market $255,000 Active 53 DOM
-
2026-06-01days on market $255,000 Active 52 DOM
-
2026-05-31days on market $255,000 Active 51 DOM
-
2026-05-31days on market $255,000 Active 50 DOM
-
2026-05-12price $255,000 338-char remark
Show marketing remark (339 chars)
LOCATION IS THE KEY! 3 bed 2 bath home located in Santa Rosa subdivision off Staring Lane. This home features an open kitchen with porcelain counters, a peninsula breakfast bar, workstation, split floor plan, and double garage, fireplace with gas logs and a large rear porch/patio. Easy access to LSU, healthcare and shopping/restaurants.
-
2026-05-12price $255,000 339-char remark
Show marketing remark (339 chars)
LOCATION IS THE KEY! 3 bed 2 bath home located in Santa Rosa subdivision off Staring Lane. This home features an open kitchen with porcelain counters, a peninsula breakfast bar, workstation, split floor plan, and double garage, fireplace with gas logs and a large rear porch/patio. Easy access to LSU, healthcare and shopping/restaurants.
-
2026-04-17price $265,000 338-char remark
Show marketing remark (339 chars)
LOCATION IS THE KEY! 3 bed 2 bath home located in Santa Rosa subdivision off Staring Lane. This home features an open kitchen with porcelain counters, a peninsula breakfast bar, workstation, split floor plan, and double garage, fireplace with gas logs and a large rear porch/patio. Easy access to LSU, healthcare and shopping/restaurants.
-
2026-04-17price $265,000 339-char remark
Show marketing remark (339 chars)
LOCATION IS THE KEY! 3 bed 2 bath home located in Santa Rosa subdivision off Staring Lane. This home features an open kitchen with porcelain counters, a peninsula breakfast bar, workstation, split floor plan, and double garage, fireplace with gas logs and a large rear porch/patio. Easy access to LSU, healthcare and shopping/restaurants.
-
2026-04-15status Active 338-char remark
Show marketing remark (339 chars)
LOCATION IS THE KEY! 3 bed 2 bath home located in Santa Rosa subdivision off Staring Lane. This home features an open kitchen with porcelain counters, a peninsula breakfast bar, workstation, split floor plan, and double garage, fireplace with gas logs and a large rear porch/patio. Easy access to LSU, healthcare and shopping/restaurants.
-
2026-04-15status Active 339-char remark
Show marketing remark (339 chars)
LOCATION IS THE KEY! 3 bed 2 bath home located in Santa Rosa subdivision off Staring Lane. This home features an open kitchen with porcelain counters, a peninsula breakfast bar, workstation, split floor plan, and double garage, fireplace with gas logs and a large rear porch/patio. Easy access to LSU, healthcare and shopping/restaurants.
-
2026-03-13$257,000 Active 338-char remark
Show marketing remark (339 chars)
LOCATION IS THE KEY! 3 bed 2 bath home located in Santa Rosa subdivision off Staring Lane. This home features an open kitchen with porcelain counters, a peninsula breakfast bar, workstation, split floor plan, and double garage, fireplace with gas logs and a large rear porch/patio. Easy access to LSU, healthcare and shopping/restaurants.
-
2026-03-13$257,000 Active 339-char remark
Show marketing remark (339 chars)
LOCATION IS THE KEY! 3 bed 2 bath home located in Santa Rosa subdivision off Staring Lane. This home features an open kitchen with porcelain counters, a peninsula breakfast bar, workstation, split floor plan, and double garage, fireplace with gas logs and a large rear porch/patio. Easy access to LSU, healthcare and shopping/restaurants.
-
2022-04-04soldstatus $259,380
-
2022-03-31soldstatus Sold
-
2022-03-11status Pending
-
2022-02-19historical
-
2022-02-16$257,380 Active
-
2022-02-16$257,380
-
2005-06-27$164,900
ⓘ Source: listings_history table (triggers on properties + properties_extension) + one-shot
backfill from property_details.listing_events for pre-trigger history.
Tax reassessment forecast LA · Resets to sale price
- Current annual tax
- $2,842 · $237/mo
- Projected year-2 tax
- $2,842 · $237/mo
- Expected delta
- $0/yr ($0/mo · 0.0%)
ⓘ Screening estimate from a state-policy table — verify with the county assessor before closing.
Climate risk First Street
- Flood 1/10 Low FEMA zone X · 0% chance over 30 yrs
- Wildfire 1/10 Low
- Heat 8/10 Severe 7 d/yr ≥108°F today · 21 d/yr by 30 yrs out
- Wind 9/10 Extreme 99% chance of damaging wind over 30 yrs
- Air quality 3/10 Moderate 3 unhealthy d/yr today · 3 by 30 yrs out
Nearby sold comps map
Loading sold comps map…
Walkable amenities ~0.75 mi
Loading nearby amenities…
Taxation est. · year 1
- Rental income
- $23,470
- − Mortgage interest
- −$14,284
- − Property taxes
- −$2,842
- − Insurance
- −$1,275
- − Repairs & maintenance
- −$1,878
- − Management
- −$1,878
- − HOA
- −$180
- − Depreciation
- −$7,418
- Taxable loss
- −$6,284
- Est. tax savings @ 24.0%
- +$1,508
- After-tax cash flow
- $-294/yr
For passive investors: Depreciation is non-cash, so a rental often shows a tax loss while cash-flowing — sheltering income. Rental losses are passive: they offset passive income freely, and up to $25,000/yr can offset ordinary (W-2) income if you actively participate and your MAGI is under $100k (phasing out to $0 by $150k); unused losses carry forward. On sale, claimed depreciation is recaptured at up to 25%, and gains may owe capital-gains tax (a 1031 exchange can defer both). Figures are a year-1 estimate at your 24.0% rate — not tax advice; consult a CPA.
Schools (NCES district)
- District
- East Baton Rouge Parish
- NCES district ID
- 2200540
- Math proficiency
- 22% ▼ -36.00%
- Reading proficiency
- 34% ▼ -31.00%
- Median HH income
- $46,263
- Composite
- 24.14/100
- National rank
- #7745
- State rank
- #47 of 98 in LA
Livability — Baton Rouge
- Score
- 74/100
- State rank
- #24
- US rank
- #4535
Category grades
Schools grade is shown separately in the Schools card above.
Census & demographics
- County
- East Baton Rouge Parish · 399,686 people
- City population
- 351,868
- Metro
- Baton Rouge, LA
- Population (ZIP)
- 42,659
- Household income
- $92,098
- Rent vs Own
- Severe rent burden
- 1106.0
Population outlook (East Baton Rouge County) Hauer SSP2
- Today (2025)
- 464,810 people
- By 2030
- 472,137 · +1.6%
- By 2040
- 480,243 · +3.3%
- By 2050
- 484,422 · +4.2%
- By 2075
- 492,069 · +5.9%
- By 2100
- 476,347 · +2.5%
Race, ethnicity, and origin ACS 2023
- Neighborhood character
- Diverse neighborhood (Simpson 0.60)
- Race & ethnicity
- White 55% Black 29% Hispanic / Latino 7% Two or more races 6% Asian 6%
- Hispanic origin (detail)
- Mexican 1%
- Common ancestry
- Lithuanian 11% Slovak 2% Scottish 1%
- Foreign-born
- 9% · Canada, China, South Korea
- Languages at home
- 89% English-only · Spanish 4% Other Indo-European 2% Chinese 1%
Political lean MEDSL · East Baton Rouge
- 2024 margin
- D (+11.1) · D 54.5% · R 43.4% · Other 2.1%
- 2008→2024 swing
- +8.9pp toward D · 2008: 2.2pp · 2024: 11.1pp
- All cycles
- 2024: D+11.1 2020: D+13.1 2016: D+9.2 2012: D+5.2 2008: D+2.2
Not yet ingested
- Civics
- —
Market trends
- HPI YoY
- ▼ -117.55%
- Current HPI
- 172.7593
- Rent YoY
- ▲ 0.68%
- Metro
- Baton Rouge, LA
- State GDP YoY
- ▲ 3.29%
- F500 in state
- 10
Industry mix (Fortune 500 HQ in LA)
| Industry | F500 HQs | Revenue |
|---|---|---|
| Telecommunications | 2 | $23B |
|
||
| Utilities | 1 | $12B |
|
||
| Wholesale / Distribution | 1 | $5B |
|
||
| Advertising | 1 | $2B |
|
||
Price history
+54.6% since first listed15 events — show timeline
- 2026-05-12 Price Changed $255,000 AcadianaMLS
- 2026-05-12 Price Changed $255,000 GBRMLS
- 2026-04-17 Price Changed $265,000 AcadianaMLS
- 2026-04-17 Price Changed $265,000 GBRMLS
- 2026-04-15 Relisted — AcadianaMLS
- 2026-04-15 Relisted — GBRMLS
- 2026-03-13 Listed $257,000 GBRMLS
- 2026-03-13 Listed $257,000 AcadianaMLS
- 2022-04-04 Sold (Public Records) $259,380 Public Records
- 2022-03-31 Sold (MLS) — GBRMLS
- 2022-03-11 Pending — GBRMLS
- 2022-02-19 Delisted — GBRMLS
- 2022-02-16 Listed $257,380 AcadianaMLS
- 2022-02-16 Listed $257,380 GBRMLS
- 2005-06-27 Listed $164,900 AcadianaMLS
Property tax history
+7.8%/yrLatest (2025): $2,842 · -0.5% YoY. Source: county tax records.
Cash-flow waterfall
monthlySold comps — $/sqft
last 12 mo · ≤1 miLoading sold comps…