276 McDuff Ave S · Jacksonville, FL
Flood risk 1/10 · Minimal
- FEMA flood zone
- X (unshaded)
- Chance of flooding over 30 yrs
- 0.0%
- Est. flood insurance / yr
- $507 – $1,088
Fire risk 1/10 · Minimal
- Est. fire insurance / yr
- $947 – $1,759
Heat risk 9/10 · Severe
- Hot days now (above 107°F)
- 7 days/yr
- Hot days in 30 yrs
- 20 days/yr
Wind risk 9/10 · Severe
- Chance of severe wind over 30 yrs
- 99.0%
Air-quality risk 5/10 · Moderate
- Unhealthy air days now
- 7 days/yr
- Unhealthy air days in 30 yrs
- 7 days/yr
Risk factors via First Street. Map © Google.
Why this score? — see what drove the B+ grade
The composite is a weighted blend of 9 inputs, each scored 0–100. Each bar is that input's sub-score; the figure is the points it added to the 100-point composite (weight × sub-score).
- Cash flow +26.4/30.0
- ARV discount +15.0/15.0
- DSCR +9.0/10.0
- 1% rule +7.1/10.0
- Appreciation +6.7/10.0
- Livability +4.2/5.0
- Schools +3.9/10.0
- Rent growth +2.9/5.0
- Condition / age +2.5/5.0
$114,900
🖨 Deal sheet 📄 Offer letter ✓ Due diligence
Listing remarks MLS
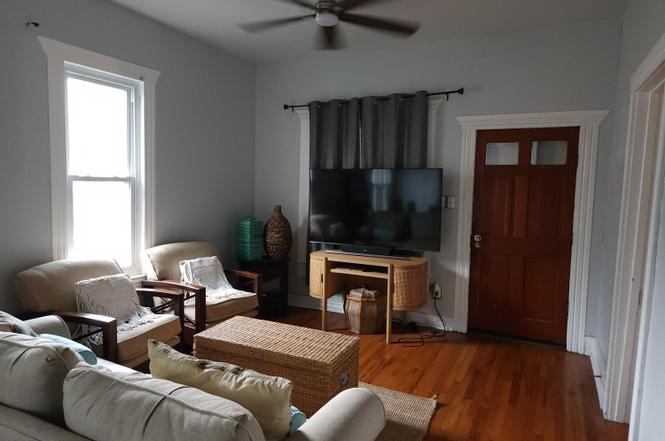
Fixer upper for great price. Owner motivated
Key facts
- Wood and tile floors
- Timeless molding
- Florida bungalow
Tags
Property features AI
Finance
- Other: Unfurnished
- HOA & community: Not a senior community
Exterior
- Parking: Detached garage (1 car)
- Utilities: Public sewer; Cable connected; Electricity connected; Sewer connected; Water connected
- Home design: Single-family residence; Residential use
- Exterior features: Chain link and wood fencing; Shingle roof; Lot approximately 0.18 acres
Interior
- Kitchen: Dishwasher
- Bedrooms: 3 bedrooms
- Flooring: Tile flooring; Wood flooring
- Bathrooms: 1 full bathroom
- Heating & cooling: Central heating; Central air conditioning
- Interior features: Ceiling fans; Eat-in kitchen; Open floor plan
- Laundry & utility: Washer hookup; Electric dryer hookup; In-unit laundry
Neighborhood map
What this means for you Summary
Snapshot
- This is a 3-bed/1.0-bath single-family listed at $115k.
Deal economics
- At list price, monthly cash flow is $300 ($4k/yr) — positive.
- The deal already cash-flows at list — no discount required.
- Meets the 1% rule at list price ($1k rent vs $115k).
- Recommended offer: $105k (9.0% below list) — sets the bar for market timing.
- Cap rate 9.4% vs local median 4.0% in Jacksonville — top-decile yield for the area; either an underpriced asset or a hidden risk that comps aren't pricing in. Stress-test before assuming the spread holds.
Location & tenants
- Location reads 83/100 on livability (#50 in FL, #911 nationally) — a professional / high-income tenant draw. Strengths: amenities A+, commute A+, housing A+.
- Duval (urban): math 46% / reading 45% proficiency, ranked #48 of 73 in FL (top 66%) — families likely to look elsewhere, expect single-tenant / working-renter base with shorter leases.
- Market conditions: Rents rising (+1.7%/yr); 172 active listings in the ZIP; 40 comparable units currently listed for rent nearby; rentals at typical pace (median 24d on market — plan ~3-4 weeks tenant-placement turnaround); lower-income renter base — watch delinquency; 6,503 units permitted in Duval County in 2024 (1,131 in 5+ unit buildings).
Forward outlook
- In year one you build about $5k of equity ($794 loan paydown + $4k appreciation (3.4% local appreciation)).
- Duval County population projected at +19% by 2050 — long-run rental-demand tailwind backs the buy-and-hold thesis.
- At projected returns (3.4% appreciation + 1.7% rent growth), your $32k cash investment doubles in ~4 years — after that, you're playing with house money.
- By year 8, paydown + projected appreciation supports a ~$35k cash-out refi (75% LTV) — recoverable capital for the next deal without selling this one.
Negotiation context
- It's been on market 92 days — a 9% lower offer ($105k) is reasonable based on typical stale-listing flexibility.
- 7 sale attempts since 22y ago; this cycle's ask has dropped $15k (12%) from the opening price — seller is motivated, your offer sets the floor, not the list.
- Current owner paid $79k; 45% above their basis — modest negotiation headroom, anchor on the comps not their cost.
Risks & watch-outs
- Watch-outs: built in 1941 — expect roof / HVAC / electrical / plumbing capex.
- Climate carrying-cost: severe wind risk, 99% chance of damaging wind over 30y; extreme-heat days projected 7→20/yr by 2055 (HVAC capex compounding) — expect insurance premiums to compound above CPI over the hold.
Questions for the listing agent
- It's been on market 92 days. Have you received any prior offers? Is the seller open to a 9% concession, seller financing, or rate buy-down credit?
- Built in 1941 — when were the roof, HVAC, electrical panel, plumbing, and water heater last replaced?
- Why hasn't it sold? Are there any deal-killer items the seller is aware of (foundation, flood, title, zoning, code violations)?
- Is there a deadline driving the sale (1031 exchange, divorce, estate, relocation)? That informs how much negotiation room exists.
- Schools are B-rated — typically a magnet for longer-tenancy family renters. What's the average tenant stay here, and is there a school-zone premium baked into asking?
- What's the average days-on-market for RENTAL listings here right now (not sales)? A rising rental-DOM trend means longer vacancies and softer asking-rent achievability than the comps imply.
- What's the recent tenant-quality profile in this submarket — average credit score on applications, eviction rate, late-payment / NSF rate, and stable-employment percentage? A property-management company in the area should have these aggregated.
- How much new for-sale + rental construction is in the pipeline within 1–3 miles? Heavy new supply typically softens prices + rents 12–24 months out; constrained supply supports both.
Investment metrics
- 1% rule
- 1.21% ✓
- Cap rate
- 9.43%
- Cash-on-cash
- 11.19%
- DSCR
- 1.50
- GRM
- 6.9
CMA / ARV
- ARV (on-the-fly)
- $163,584
- Comps found
- 12
Show comp detail 12 sales within ~0.75 mi
| Address | Dist | Beds/Ba | Sqft | Sold | Price | $/sf | Match |
|---|---|---|---|---|---|---|---|
| 2908 Spencer St | 0.21mi | 3/2.0 | 1,100 (-3%) | 0mo | $158,000 | $144 | 80 |
| 3127 Dignan St | 0.16mi | 3/2.0 | 1,197 (+5%) | 2mo | $210,000 | $175 | 78 |
| 2881 Lenox Ave | 0.31mi | 3/1.0 | 1,068 (-6%) | 2mo | $90,000 | $84 | 74 |
| 3205 Dignan St | 0.26mi | 3/2.0 | 1,080 (-5%) | 2mo | $140,000 | $130 | 74 |
| 156 Willow Branch Ave | 0.22mi | 4/2.0 (+1) | 1,268 (+12%) | 0mo | $105,000 | $83 | 61 |
| 2667 Amy St | 0.58mi | 3/1.0 | 1,038 (-9%) | 0mo | $117,000 | $113 | 58 |
| 724 James St | 0.60mi | 3/2.0 | 1,207 (+6%) | 2mo | $265,000 | $220 | 56 |
| 3557 Dillon St | 0.58mi | 3/1.5 | 1,035 (-9%) | 1mo | $180,000 | $174 | 56 |
| 3053 Gilmore St | 0.46mi | 2/1.0 (-1) | 1,008 (-11%) | 0mo | $130,000 | $129 | 54 |
| 3333 Ernest St | 0.66mi | 3/1.0 | 984 (-13%) | 1mo | $207,000 | $210 | 46 |
| 357 Smith St | 0.60mi | 3/2.0 | 1,000 (-12%) | 3mo | $142,000 | $142 | 46 |
| 3332 Dellwood Ave | 0.72mi | 2/1.0 (-1) | 1,023 (-10%) | 0mo | $184,000 | $180 | 45 |
Match score weights: distance 35% · size 25% · config 20% · recency 20%. Top-matched comps best support the ARV.
Projected returns pro-forma
3.41% appreciation · 1.7% rent growth · sell at horizon
- IRR
- 18.1%
- Equity multiple
- 2.05×
- Total profit
- $33,713
- Equity at exit
- $54,355
- IRR
- 18.5%
- Equity multiple
- 3.73×
- Total profit
- $87,857
- Equity at exit
- $85,923
Cash invested: $32,172 (down + closing). Projections, not guarantees.
Landlord ↔ Tenant lean methodology
- Overall (STATE)
- 87 Strongly Landlord-Friendly
- State Florida
- 87 Strongly Landlord-Friendly · R+3
- County
- — inherits STATE
- City
- — inherits STATE
ZIP-level market 32254
- Home prices YoY
- 1.2%
- Rents YoY
- 1.7%
- Active inventory
- 172
- Price-to-rent
- 6.9×
Monthly cashflow live
- Estimated rent
- $1,386 high interval (Pro) →
- Mortgage (P&I)
- −$603
- Tax from tax record
- −$144 /mo · $1,732/yr
- Insurance
- −$48
- HOA
- −$0
- Vacancy / Maint / Mgmt
- −$291
- Net cashflow
- $300
Break-even live
UW: 25.0% down · 7.5% · 30yr · 1.5% tax · 5.0% vac · 8.0% maint · 8.0% mgmt
Financing live
Cash to close
- Down payment
- $28,725
- Closing costs
- $3,447
- Reserves months
- —
- Total cash needed
- —
Loan-product check · same deal, 3 products live
Conventional
25% down · 7.5% · 30yr
- Down + closing
- —
- Monthly P&I
- —
- Monthly cashflow
- —
- DSCR
- —
- Eligible?
- —
Personal DTI + credit; lowest rate.
DSCR
20% down · 8.5% · 30yr
- Down + closing
- —
- Monthly P&I
- —
- Monthly cashflow
- —
- DSCR
- —
- Eligible?
- —
No personal income docs; deal must DSCR.
Hard money
10% down · 12.0% · 12mo
- Down + closing
- —
- Monthly P&I
- —
- Monthly cashflow
- —
- DSCR
- —
- Eligible?
- —
Short-term bridge; refi at stabilization.
Rent comps 40 comps
| Address | Beds | Baths | Sqft | Rent | $/sqft | DOM | Units | Dist |
|---|---|---|---|---|---|---|---|---|
| 3035 Fitzgerald St Jacksonville, FL | 2.0 | 1.0 | 900 | $1,021 | $1.13 | 2d | 1 | 0.09mi |
| 3118 Dignan St Jacksonville, FL | 4.0 | 2.0 | 1103 | $1,148 | $1.04 | 1d | 1 | 0.13mi |
| 420 Sunshine St Jacksonville, FL | 3.0 | 2.0 | 1050 | $1,350 | $1.29 | 1d | 1 | 0.38mi |
| 3318 Dignan St Jacksonville, FL | 3.0 | 2.0 | 960 | $1,200 | $1.25 | 23d | 1 | 0.39mi |
| 3159 Phyllis St Jacksonville, FL | 3.0 | 2.0 | 1209 | $1,561 | $1.29 | 2d | 1 | 0.40mi |
| 3319 Hunt St Jacksonville, FL | 3.0 | 1.0 | 924 | $1,295 | $1.40 | 23d | 1 | 0.40mi |
| 3323 Nolan St Jacksonville, FL | 3.0 | 1.0 | 927 | $1,050 | $1.13 | 1d | 1 | 0.40mi |
| 3352 Dillon St Jacksonville, FL | 3.0 | 2.0 | 1229 | $1,372 | $1.12 | 23d | 1 | 0.45mi |
| 3236 Phyllis St Unit 3244 Jacksonville, FL | 2.0 | 1.0 | 720 | $850 | $1.18 | 23d | 1 | 0.47mi |
| 3250 Phyllis St Jacksonville, FL | 2.0 | 1.0 | 720 | $850 | $1.18 | 23d | 1 | 0.48mi |
| 3515 Dignan St Jacksonville, FL | 3.0 | 1.0 | 915 | $1,036 | $1.13 | 2d | 1 | 0.50mi |
| 3356 Lenox Ave Jacksonville, FL | 2.0 | 1.0 | 899 | $999 | $1.11 | 23d | 1 | 0.51mi |
| 2980 Ernest St Jacksonville, FL | 2.0 | 1.0 | 920 | $1,200 | $1.30 | 23d | 1 | 0.52mi |
| 3347 Phyllis St Jacksonville, FL | 3.0 | 2.0 | 1145 | $1,395 | $1.22 | 23d | 1 | 0.56mi |
| 2410 McQuade St Jacksonville, FL | 3.0 | 2.0 | 1307 | $1,425 | $1.09 | 23d | 1 | 0.56mi |
| 3550 Edison Ave Jacksonville, FL | 3.0 | 2.0 | 1230 | $1,463 | $1.19 | 4d | 1 | 0.57mi |
| 809 McDuff Ave S Jacksonville, FL | 2.0 | 1.0 | 1006 | $995 | $0.99 | 4d | 1 | 0.58mi |
| 3233 Dellwood Ave Jacksonville, FL | 2.0 | 2.0 | 1000 | $1,750 | $1.75 | 23d | 1 | 0.61mi |
| 371 Smith St Jacksonville, FL | 3.0 | 2.0 | 1050 | $1,325 | $1.26 | 4d | 1 | 0.62mi |
| 2812 Ernest St Jacksonville, FL | 3.0 | 1.0 | 1461 | $2,800 | $1.92 | 23d | 1 | 0.62mi |
| 2587 Orchard St Jacksonville, FL | 2.0 | 2.0 | 992 | $1,295 | $1.31 | 7d | 1 | 0.64mi |
| 3312 Ernest St Jacksonville, FL | 3.0 | 1.0 | 1065 | $1,148 | $1.08 | 23d | 1 | 0.64mi |
| 3688 Dillon St Jacksonville, FL | 3.0 | 2.0 | 1230 | $1,421 | $1.16 | 23d | 1 | 0.67mi |
| 3036 Green St Jacksonville, FL | 3.0 | 1.0 | 924 | $1,495 | $1.62 | 23d | 1 | 0.67mi |
| 3353 Dellwood Ave Jacksonville, FL | 3.0 | 1.0 | 934 | $1,595 | $1.71 | 17d | 1 | 0.70mi |
| 841 Ontario St Jacksonville, FL | 2.0 | 1.0 | 1000 | $1,285 | $1.28 | 23d | 1 | 0.71mi |
| 676 Bridal Ave Jacksonville, FL | 3.0 | 2.0 | 1008 | $1,450 | $1.44 | 23d | 1 | 0.71mi |
| 2759 Dellwood Ave Jacksonville, FL | 3.0 | 2.0 | 1080 | $2,100 | $1.94 | 19d | 1 | 0.74mi |
| 717 King St Jacksonville, FL | 3.0 | 2.0 | 1132 | $1,800 | $1.59 | 17d | 1 | 0.74mi |
| 3313 Green St Jacksonville, FL | 3.0 | 1.0 | 1058 | $1,450 | $1.37 | 7d | 1 | 0.74mi |
| 715 Ralph St Jacksonville, FL | 4.0 | 2.0 | 1338 | $2,195 | $1.64 | 4d | 1 | 0.77mi |
| 3609 Dellwood Ave Jacksonville, FL | 2.0 | 2.0 | 936 | $1,495 | $1.60 | 23d | 1 | 0.82mi |
| 3233 Post St Jacksonville, FL | 2.0 | 1.0 | 750 | $1,095 | $1.46 | 23d | 1 | 0.84mi |
| 3302 College St Jacksonville, FL | 3.0 | 1.0 | 1174 | $1,095 | $0.93 | 7d | 1 | 0.84mi |
| 912 Huron St Jacksonville, FL | 2.0 | 1.0 | 900 | $1,100 | $1.22 | 14d | 1 | 0.85mi |
| 2803 College St Jacksonville, FL | 2.0 | 1.0 | 1100 | $1,550 | $1.41 | 13d | 1 | 0.86mi |
| 2701 Myra St Jacksonville, FL | 3.0 | 1.0 | 1065 | $1,595 | $1.50 | 21d | 1 | 0.86mi |
| 3352 College St Jacksonville, FL | 3.0 | 2.0 | 1335 | $1,550 | $1.16 | 14d | 1 | 0.89mi |
| 2561 Rosselle St #1 Jacksonville, FL | 3.0 | 3.0 | 1287 | $1,395 | $1.08 | 23d | 1 | 0.89mi |
| 2128 Woodside St Jacksonville, FL | 2.0 | 1.0 | 776 | $895 | $1.15 | 23d | 1 | 0.91mi |
Listing history 24 events
-
2026-06-08days on market $114,900 Active 92 DOM
-
2026-06-07days on market $114,900 Active 91 DOM
-
2026-06-03days on market $114,900 Active 87 DOM
-
2026-06-02days on market $114,900 Active 86 DOM
-
2026-06-01days on market $114,900 Active 85 DOM
-
2026-05-31days on market $114,900 Active 84 DOM
-
2026-03-29price $114,900
-
2026-03-23price $124,900
-
2026-03-08$129,900 Active
-
2022-11-04soldstatus $79,000 Sold 44-char remark
Show marketing remark (44 chars)
Fixer upper for great price. Owner motivated
-
2022-08-10$89,000 Active 44-char remark
Show marketing remark (44 chars)
Fixer upper for great price. Owner motivated
-
2021-06-14soldstatus $65,000
-
2020-10-11historical
-
2020-05-10price $75,000
-
2020-04-11$87,000 Active
-
2005-12-31soldstatus $55,000
-
2005-10-21historical
-
2005-09-06$69,900
-
2005-09-06historical
-
2005-06-07$79,900
-
2005-06-07historical
-
2005-06-07historical
-
2004-10-25$79,900
-
2004-10-25$89,900
ⓘ Source: listings_history table (triggers on properties + properties_extension) + one-shot
backfill from property_details.listing_events for pre-trigger history.
Tax reassessment forecast FL · Resets to sale price
- Current annual tax
- $1,732 · $144/mo
- Projected year-2 tax
- $1,732 · $144/mo
- Expected delta
- $0/yr ($0/mo · 0.0%)
ⓘ Screening estimate from a state-policy table — verify with the county assessor before closing.
Climate risk First Street
- Flood 1/10 Low FEMA zone X (unshaded) · 0% chance over 30 yrs
- Wildfire 1/10 Low
- Heat 9/10 Extreme 7 d/yr ≥107°F today · 20 d/yr by 30 yrs out
- Wind 9/10 Extreme 99% chance of damaging wind over 30 yrs
- Air quality 5/10 Major 7 unhealthy d/yr today · 7 by 30 yrs out
Nearby sold comps map
Loading sold comps map…
Walkable amenities ~0.75 mi
Loading nearby amenities…
Taxation est. · year 1
- Rental income
- $16,630
- − Mortgage interest
- −$6,436
- − Property taxes
- −$1,732
- − Insurance
- −$574
- − Repairs & maintenance
- −$1,330
- − Management
- −$1,330
- − Depreciation
- −$3,343
- Taxable income
- $1,884
- Est. tax owed @ 24.0%
- −$452
- After-tax cash flow
- $3,148/yr
For passive investors: Depreciation is non-cash, so a rental often shows a tax loss while cash-flowing — sheltering income. Rental losses are passive: they offset passive income freely, and up to $25,000/yr can offset ordinary (W-2) income if you actively participate and your MAGI is under $100k (phasing out to $0 by $150k); unused losses carry forward. On sale, claimed depreciation is recaptured at up to 25%, and gains may owe capital-gains tax (a 1031 exchange can defer both). Figures are a year-1 estimate at your 24.0% rate — not tax advice; consult a CPA.
Schools (NCES district)
- District
- Duval
- NCES district ID
- 1200480
- Math proficiency
- 46% ▼ -11.00%
- Reading proficiency
- 45% ▼ -4.00%
- Median HH income
- $48,987
- Composite
- 38.97/100
- National rank
- #4076
- State rank
- #48 of 73 in FL
Livability — Jacksonville
- Score
- 83/100
- State rank
- #50
- US rank
- #911
Category grades
Schools grade is shown separately in the Schools card above.
Census & demographics
- Census place
- Jacksonville, FL
- County
- Duval County · 1,015,274 people
- City population
- 979,034
- Metro
- Jacksonville, FL
- Population (ZIP)
- 13,927
- Household income
- $34,953
- Rent vs Own
- Severe rent burden
- 882.0
Population outlook (Duval County) Hauer SSP2
- Today (2025)
- 1,013,010 people
- By 2030
- 1,059,228 · +4.6%
- By 2040
- 1,141,439 · +12.7%
- By 2050
- 1,205,258 · +19.0%
- By 2075
- 1,324,282 · +30.7%
- By 2100
- 1,319,620 · +30.3%
Race, ethnicity, and origin ACS 2023
- Neighborhood character
- Diverse neighborhood (Simpson 0.56)
- Race & ethnicity
- Black 60% White 28% Two or more races 7% Hispanic / Latino 5%
- Hispanic origin (detail)
- Puerto Rican 1%
- Common ancestry
- Slovak 1% Hispanic 1% Lithuanian 1%
- Foreign-born
- 4% · Canada
- Languages at home
- 94% English-only · Spanish 4% French/Haitian/Cajun 2%
Political lean MEDSL · Duval
- 2024 margin
- Toss-up / Even · D 48.7% · R 50.1% · Other 1.2%
- 2008→2024 swing
- +0.4pp no change · 2008: -1.9pp · 2024: -1.5pp
- All cycles
- 2024: R+1.5 2020: D+3.8 2016: R+1.5 2012: R+3.6 2008: R+1.9
Not yet ingested
- Civics
- —
Market trends
- HPI YoY
- ▲ 3.41%
- Current HPI
- 282.2981
- Rent YoY
- ▲ 1.70%
- Metro
- Jacksonville, FL
- State GDP YoY
- ▲ 3.28%
- F500 in state
- 36
Industry mix (Fortune 500 HQ in FL)
| Industry | F500 HQs | Revenue |
|---|---|---|
| Industrial Technology | 2 | $29B |
|
||
| Insurance | 2 | $17B |
|
||
| Retail | 1 | $60B |
|
||
| Technology Distribution | 1 | $58B |
|
||
| Homebuilding | 1 | $35B |
|
||
| Technology Manufacturing | 1 | $35B |
|
||
Price history
+43.8% since first listed18 events — show timeline
- 2026-03-29 Price Changed $114,900 realMLS
- 2026-03-23 Price Changed $124,900 realMLS
- 2026-03-08 Listed $129,900 realMLS
- 2022-11-04 Sold (MLS) $79,000 realMLS
- 2022-08-10 Listed $89,000 realMLS
- 2021-06-14 Sold (Public Records) $65,000 Public Records
- 2020-10-11 Listing Removed — realMLS
- 2020-05-10 Price Changed $75,000 realMLS
- 2020-04-11 Listed $87,000 realMLS
- 2005-12-31 Sold (Public Records) $55,000 Public Records
- 2005-10-21 Listing Removed — realMLS
- 2005-09-06 Listing Removed — realMLS
- 2005-09-06 Listed $69,900 realMLS
- 2005-06-07 Listing Removed — realMLS
- 2005-06-07 Listing Removed — realMLS
- 2005-06-07 Listed $79,900 realMLS
- 2004-10-25 Listed $89,900 realMLS
- 2004-10-25 Listed $79,900 realMLS
Property tax history
+11.3%/yrLatest (2025): $1,732 · +17.4% YoY. Source: county tax records.
Cash-flow waterfall
monthlySold comps — $/sqft
last 12 mo · ≤1 miLoading sold comps…