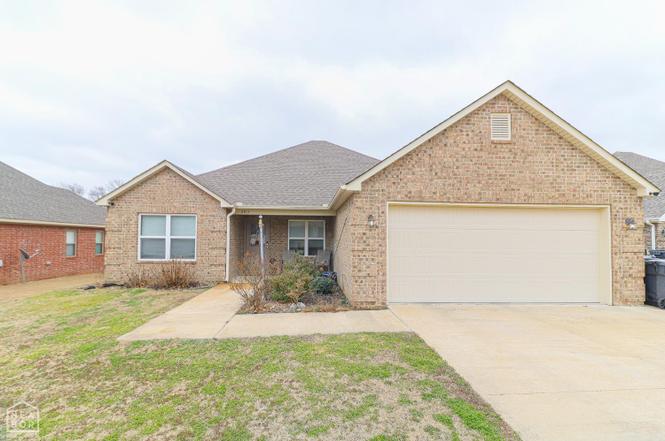
4811 Yukon Dr · Jonesboro, AR
Flood risk 1/10 · Minimal
- FEMA flood zone
- —
- Chance of flooding over 30 yrs
- 0.0%
- Est. flood insurance / yr
- —
Fire risk 4/10 · Minor
- Est. fire insurance / yr
- $1,499 – $2,785
Heat risk 5/10 · Moderate
- Hot days now (above 108°F)
- 7 days/yr
- Hot days in 30 yrs
- 21 days/yr
Wind risk 4/10 · Minor
- Chance of severe wind over 30 yrs
- 8.0%
Air-quality risk 2/10 · Minimal
- Unhealthy air days now
- 0 days/yr
- Unhealthy air days in 30 yrs
- 1 days/yr
Risk factors via First Street. Map © Google.
Why this score? — see what drove the D grade
The composite is a weighted blend of 9 inputs, each scored 0–100. Each bar is that input's sub-score; the figure is the points it added to the 100-point composite (weight × sub-score).
- Cash flow +10.1/30.0
- Appreciation +9.7/10.0
- ARV discount +9.1/15.0
- Livability +3.2/5.0
- DSCR +2.9/10.0
- Rent growth +2.5/5.0
- Condition / age +2.5/5.0
- 1% rule +2.2/10.0
- Schools +1.9/10.0
$239,900
🖨 Deal sheet (PDF) 📄 Offer letter ✓ Due diligence
Listing remarks MLS
This home will feature a soaker tub in the master bathroom, luxury vinyl plank flooring throughout living room and wet areas. There will be carpet in the bedrooms only. It will also feature staggered cabinets and a kitchen island. There will be a vaulted ceiling in the living room with a ceiling fan. It will have a neutral color scheme. It is a functional open floorplan. Estimated completion date is March 2019.
Key facts
- Split floor plan
- Backyard shed
- All brick exterior
Tags
Property features AI
Finance
- Other: Approximately 0.31 acre lot; Approximate living area 1,680
- Financial info: Cash financing available
Exterior
- Parking: 2-car garage
- Utilities: Public sewer; Public water
- Home design: Brick exterior; Inside city limits; Level lot
- Construction: Slab foundation; Architectural shingle roof
- Exterior features: Deck; Porch; Above-ground pool; Paved road
Interior
- Kitchen: Electric range; Disposal
- Flooring: Carpet; Vinyl; Tile
- Bathrooms: 2 full bathrooms
- Heating & cooling: Central electric heating; Central electric cooling
- Interior features: Ceiling fan(s); Sheetrock walls/ceilings
Neighborhood map
What this means for you Summary
Snapshot
- This is a 3-bed/2.0-bath single-family listed at $240k.
Deal economics
- At list price, monthly cash flow is $-143 ($-2k/yr) — negative.
- To cash-flow at today's rent, offer at most $215k (10.5% below list).
- To meet the 1% rule (rent ≥ 1% of price), the offer needs to be $173k (27.9% below list).
- Recommended offer: $173k (27.9% below list) — sets the bar for 1% rule.
- Cap rate 5.6% vs local median 4.4% in Jonesboro — meaningfully above typical; check what's discounted (condition, days-on-market, listing class) to confirm the premium yield is real.
Location & tenants
- Location reads 65/100 on livability (#145 in AR) — a middle-class / working-renter tenant base. Strengths: cost of living A+, housing A+, health & safety A+; Watch: crime F, amenities F, commute F.
- Nettleton School District (urban): math 21% / reading 24% proficiency, ranked #199 of 238 in AR (top 84%) — low school quality limits family demand, transient renter base, plan for 1-2y turnover.
- Zoned schools: Nettleton Steam School (math 33% / reading 26%, grade F, #305 of 454 statewide, top 71%, 324 students, 100% FRL); Nettleton Junior High School (math 21% / reading 31%, grade F, #159 of 201 statewide, top 80%, 546 students, 100% FRL); Nettleton High School (math 11% / reading 27%, grade F, #248 of 292 statewide, top 86%, 981 students, 68% FRL) — zoned schools average 89% FRL vs 56% district-wide (34 pts higher); higher-poverty schools than district average — tighter screening recommended.
- Market conditions: 150 active listings in the ZIP; 3 comparable units currently listed for rent nearby; rentals lingering (median 46d on market — plan ~5-8 weeks vacancy on turnover, expect pricing pressure); 100% of comp listings sitting > 30 days — soft ceiling on asking rent; solid renter incomes; 926 units permitted in Craighead County in 2024 (69 in 5+ unit buildings).
Forward outlook
- In year one you build about $24k of equity ($2k loan paydown + $23k appreciation (9.4% local appreciation)).
- Craighead County population projected at +38% by 2050 — long-run rental-demand tailwind backs the buy-and-hold thesis.
- By year 2, paydown + projected appreciation supports a ~$39k cash-out refi (75% LTV) — recoverable capital for the next deal without selling this one.
Negotiation context
- It's been on market 62 days — a 6% lower offer ($226k) is reasonable based on typical stale-listing flexibility.
- 2 sale attempts since 8y ago with the ask held roughly flat each time — persistent listings suggest the price (not the market) is what's stuck; bring a comps-based counter.
- Current owner paid $170k; 41% above their basis — modest negotiation headroom, anchor on the comps not their cost.
Risks & watch-outs
- Climate carrying-cost: extreme-heat days projected 7→21/yr by 2055 (HVAC capex compounding) — expect insurance premiums to compound above CPI over the hold.
Questions for the listing agent
- What do current leases actually rent for vs. the listed asking? Can we see a recent rent roll and the last 12 months of T-12 income?
- It's been on market 62 days. Have you received any prior offers? Is the seller open to a 28% concession, seller financing, or rate buy-down credit?
- Why hasn't it sold? Are there any deal-killer items the seller is aware of (foundation, flood, title, zoning, code violations)?
- Is there a deadline driving the sale (1031 exchange, divorce, estate, relocation)? That informs how much negotiation room exists.
- Schools are D-rated, which usually means shorter tenancies and higher turnover. Who's the typical renter profile here, and what's been the actual vacancy rate?
- Crime grade is F in this area — have there been break-ins, vandalism, or insurance claims at this property in the last 3 years? What carrier currently insures it and at what premium?
- The area grade is low — what's the realistic commute time and amenity access for the typical tenant pool here? Any planned neighborhood developments (good or bad) we should know about?
- What's the average days-on-market for RENTAL listings here right now (not sales)? A rising rental-DOM trend means longer vacancies and softer asking-rent achievability than the comps imply.
- What's the recent tenant-quality profile in this submarket — average credit score on applications, eviction rate, late-payment / NSF rate, and stable-employment percentage? A property-management company in the area should have these aggregated.
- How much new for-sale + rental construction is in the pipeline within 1–3 miles? Heavy new supply typically softens prices + rents 12–24 months out; constrained supply supports both.
Investment metrics
- 1% rule
- 0.72% ✗
- Cap rate
- 5.58%
- Cash-on-cash
- -2.55%
- DSCR
- 0.89
- GRM
- 11.6
CMA / ARV
- ARV (on-the-fly)
- $248,640
- Comps found
- 12
Show comp detail 12 sales within ~0.75 mi
| Address | Dist | Beds/Ba | Sqft | Sold | Price | $/sf | Match |
|---|---|---|---|---|---|---|---|
| 4811 Yukon Dr | 0.00mi | 3/2.0 | 1,680 (0%) | 1mo | $235,000 | $140 | 99 |
| 4835 Yukon Dr | 0.04mi | 3/2.0 | 1,652 (-2%) | 4mo | $247,000 | $150 | 92 |
| 280 Prospect Farm Ln | 0.12mi | 3/2.0 | 1,698 (+1%) | 1mo | $246,900 | $145 | 92 |
| 285 Prospect Farms Ln | 0.14mi | 3/2.0 | 1,546 (-8%) | 3mo | $229,500 | $148 | 78 |
| 300 Prospect Trl | 0.17mi | 3/2.0 | 1,924 (+14%) | 1mo | $125,000 | $65 | 66 |
| 5141 Yukon Dr | 0.37mi | 3/2.0 | 1,549 (-8%) | 5mo | $215,000 | $139 | 66 |
| 4833 Edgemont Dr | 0.75mi | 3/2.0 | 1,672 (-0%) | 2mo | $286,990 | $172 | 62 |
| 4769 Wildwood Ln | 0.51mi | 3/2.0 | 1,473 (-12%) | 1mo | $209,900 | $142 | 55 |
| 508 Brent | 0.58mi | 4/2.0 (+1) | 1,784 (+6%) | 5mo | $255,000 | $143 | 53 |
| 4829 Edgemont Dr | 0.74mi | 3/2.0 | 1,510 (-10%) | 2mo | $256,000 | $170 | 46 |
| 5200 Prospector | 0.56mi | 4/2.0 (+1) | 1,439 (-14%) | 2mo | $235,000 | $163 | 44 |
| 514 Brent | 0.60mi | 4/2.0 (+1) | 1,474 (-12%) | 5mo | $255,000 | $173 | 42 |
Match score weights: distance 35% · size 25% · config 20% · recency 20%. Top-matched comps best support the ARV.
Projected returns pro-forma
9.42% appreciation · 3.0% rent growth · sell at horizon
- IRR
- 21.2%
- Equity multiple
- 2.67×
- Total profit
- $112,036
- Equity at exit
- $206,042
- IRR
- 19.3%
- Equity multiple
- 5.98×
- Total profit
- $334,721
- Equity at exit
- $434,032
Cash invested: $67,172 (down + closing). Projections, not guarantees.
Landlord ↔ Tenant lean methodology
- Overall (STATE)
- 92 Strongly Landlord-Friendly
- State Arkansas
- 92 Strongly Landlord-Friendly · R+14
- County
- — inherits STATE
- City
- — inherits STATE
ZIP-level market 72405
- Home prices YoY
- 3.5%
- Active inventory
- 150
- Price-to-rent
- 11.6×
Monthly cashflow live
- Estimated rent
- $1,731 medium interval (Pro) →
- Mortgage (P&I)
- −$1,258
- Tax from tax record
- −$152 /mo · $1,823/yr
- Insurance
- −$100
- HOA
- −$0
- Vacancy / Maint / Mgmt
- −$363
- Net cashflow
- $-143
Break-even live
Sensitivity live
| Price | -10% $-7 | -5% $-75 | +0% $-143 | +5% $-210 | +10% $-278 |
|---|---|---|---|---|---|
| Rent | -10% $-279 | -5% $-211 | +0% $-143 | +5% $-74 | +10% $-6 |
| Rate | -1.0pp $-22 | -0.5pp $-82 | base $-143 | +0.5pp $-205 | +1.0pp $-268 |
UW: 25.0% down · 7.5% · 30yr · 1.5% tax · 5.0% vac · 8.0% maint · 8.0% mgmt
Financing live
Cash to close
- Down payment
- $59,975
- Closing costs
- $7,197
- Reserves months
- —
- Total cash needed
- —
Loan-product check · same deal, 3 products live
Conventional
25% down · 7.5% · 30yr
- Down + closing
- —
- Monthly P&I
- —
- Monthly cashflow
- —
- DSCR
- —
- Eligible?
- —
Personal DTI + credit; lowest rate.
DSCR
20% down · 8.5% · 30yr
- Down + closing
- —
- Monthly P&I
- —
- Monthly cashflow
- —
- DSCR
- —
- Eligible?
- —
No personal income docs; deal must DSCR.
Hard money
10% down · 12.0% · 12mo
- Down + closing
- —
- Monthly P&I
- —
- Monthly cashflow
- —
- DSCR
- —
- Eligible?
- —
Short-term bridge; refi at stabilization.
Rent comps 3 comps
| Address | Beds | Baths | Sqft | Rent | $/sqft | DOM | Units | Dist |
|---|---|---|---|---|---|---|---|---|
| 259 Wolf Den Dr Jonesboro, AR | 3.0 | 2.0 | 1419 | $1,550 | $1.09 | 45d | 1 | 0.17mi |
| 337 Wolf Den Dr Jonesboro, AR | 3.0 | 2.0 | 1419 | $1,600 | $1.13 | 45d | 1 | 0.32mi |
| 5408 Mariposa Grove Dr Jonesboro, AR | 3.0 | 2.0 | 1209 | $1,595 | $1.32 | 45d | 1 | 0.71mi |
Listing history 4 events
-
2026-04-21status Under Contract
-
2026-02-17$239,900 New Listing
-
2019-04-05soldstatus $170,450 414-char remark
Show marketing remark (414 chars)
This home will feature a soaker tub in the master bathroom, luxury vinyl plank flooring throughout living room and wet areas. There will be carpet in the bedrooms only. It will also feature staggered cabinets and a kitchen island. There will be a vaulted ceiling in the living room with a ceiling fan. It will have a neutral color scheme. It is a functional open floorplan. Estimated completion date is March 2019.
-
2018-12-03$170,450 414-char remark
Show marketing remark (414 chars)
This home will feature a soaker tub in the master bathroom, luxury vinyl plank flooring throughout living room and wet areas. There will be carpet in the bedrooms only. It will also feature staggered cabinets and a kitchen island. There will be a vaulted ceiling in the living room with a ceiling fan. It will have a neutral color scheme. It is a functional open floorplan. Estimated completion date is March 2019.
ⓘ Source: listings_history table (triggers on properties + properties_extension) + one-shot
backfill from property_details.listing_events for pre-trigger history.
Tax reassessment forecast AR · Resets to sale price
- Current annual tax
- $1,823 · $152/mo
- Projected year-2 tax
- $1,823 · $152/mo
- Expected delta
- $0/yr ($0/mo · 0.0%)
ⓘ Screening estimate from a state-policy table — verify with the county assessor before closing.
Climate risk First Street
- Flood 1/10 Low 0% chance over 30 yrs
- Wildfire 4/10 Moderate
- Heat 5/10 Major 7 d/yr ≥108°F today · 21 d/yr by 30 yrs out
- Wind 4/10 Moderate 8% chance of damaging wind over 30 yrs
- Air quality 2/10 Low 0 unhealthy d/yr today · 1 by 30 yrs out
Nearby sold comps map
Loading sold comps map…
Walkable amenities ~0.75 mi
Loading nearby amenities…
Taxation est. · year 1
- Rental income
- $20,770
- − Mortgage interest
- −$13,438
- − Property taxes
- −$1,823
- − Insurance
- −$1,200
- − Repairs & maintenance
- −$1,662
- − Management
- −$1,662
- − Depreciation
- −$6,979
- Taxable loss
- −$5,993
- Est. tax savings @ 24.0%
- +$1,438
- After-tax cash flow
- $-273/yr
For passive investors: Depreciation is non-cash, so a rental often shows a tax loss while cash-flowing — sheltering income. Rental losses are passive: they offset passive income freely, and up to $25,000/yr can offset ordinary (W-2) income if you actively participate and your MAGI is under $100k (phasing out to $0 by $150k); unused losses carry forward. On sale, claimed depreciation is recaptured at up to 25%, and gains may owe capital-gains tax (a 1031 exchange can defer both). Figures are a year-1 estimate at your 24.0% rate — not tax advice; consult a CPA.
Schools (NCES district)
- District
- Nettleton School District
- NCES district ID
- 0510440
- Math proficiency
- 21% ▼ -16.00%
- Reading proficiency
- 24% ▼ -12.00%
- Median HH income
- $39,754
- Composite
- 19.0/100
- National rank
- #8846
- State rank
- #199 of 238 in AR
Livability — Jonesboro
- Score
- 65/100
- State rank
- #145
- US rank
- #12692
Category grades
Schools grade is shown separately in the Schools card above.
Census & demographics
- Census place
- Jonesboro, AR
- County
- Craighead County · 97,185 people
- City population
- 91,245
- Metro
- Jonesboro, AR
- Population (ZIP)
- 18,675
- Household income
- $92,440
- Rent vs Own
- Severe rent burden
- 443.0
Population outlook (Craighead County) Hauer SSP2
- Today (2025)
- 122,235 people
- By 2030
- 131,338 · +7.4%
- By 2040
- 149,862 · +22.6%
- By 2050
- 168,034 · +37.5%
- By 2075
- 208,094 · +70.2%
- By 2100
- 233,251 · +90.8%
Race, ethnicity, and origin ACS 2023
- Neighborhood character
- Predominantly White (78%)
- Race & ethnicity
- White 78% Two or more races 10% Black 9% Hispanic / Latino 3% Asian 1%
- Common ancestry
- Slovak 2% Italian 1% Serbian 1%
- Foreign-born
- 4% · Canada
- Languages at home
- 93% English-only · Spanish 4% Arabic 1%
Political lean MEDSL · Craighead
- 2024 margin
- Solid R (+37.4) · D 30.1% · R 67.5% · Other 2.4%
- 2008→2024 swing
- -12.9pp toward R · 2008: -24.5pp · 2024: -37.4pp
- All cycles
- 2024: R+37.4 2020: R+35.4 2016: R+35.2 2012: R+31.1 2008: R+24.5
Not yet ingested
- Civics
- —
Market trends
- HPI YoY
- ▲ 9.42%
- Current HPI
- 277.37
- Rent YoY
- —
- Metro
- Jonesboro, AR
- State GDP YoY
- ▲ 3.80%
- F500 in state
- 10
Industry mix (Fortune 500 HQ in AR)
| Industry | F500 HQs | Revenue |
|---|---|---|
| Retail | 1 | $681B |
|
||
| Food / Agriculture | 1 | $53B |
|
||
| Retail / Energy | 1 | $22B |
|
||
| Transportation / Logistics | 1 | $12B |
|
||
| Energy | 1 | $4B |
|
||
Price history
+40.7% since first listed4 events — show timeline
- 2026-04-21 Pending — CARMLS
- 2026-02-17 Listed $239,900 CARMLS
- 2019-04-05 Sold (MLS) $170,450 NEABOR MLS
- 2018-12-03 Listed $170,450 NEABOR MLS
Property tax history
+36.0%/yrLatest (2025): $1,823 · +18.8% YoY. Source: county tax records.
Cash-flow waterfall
monthlySold comps — $/sqft
last 12 mo · ≤1 miLoading sold comps…