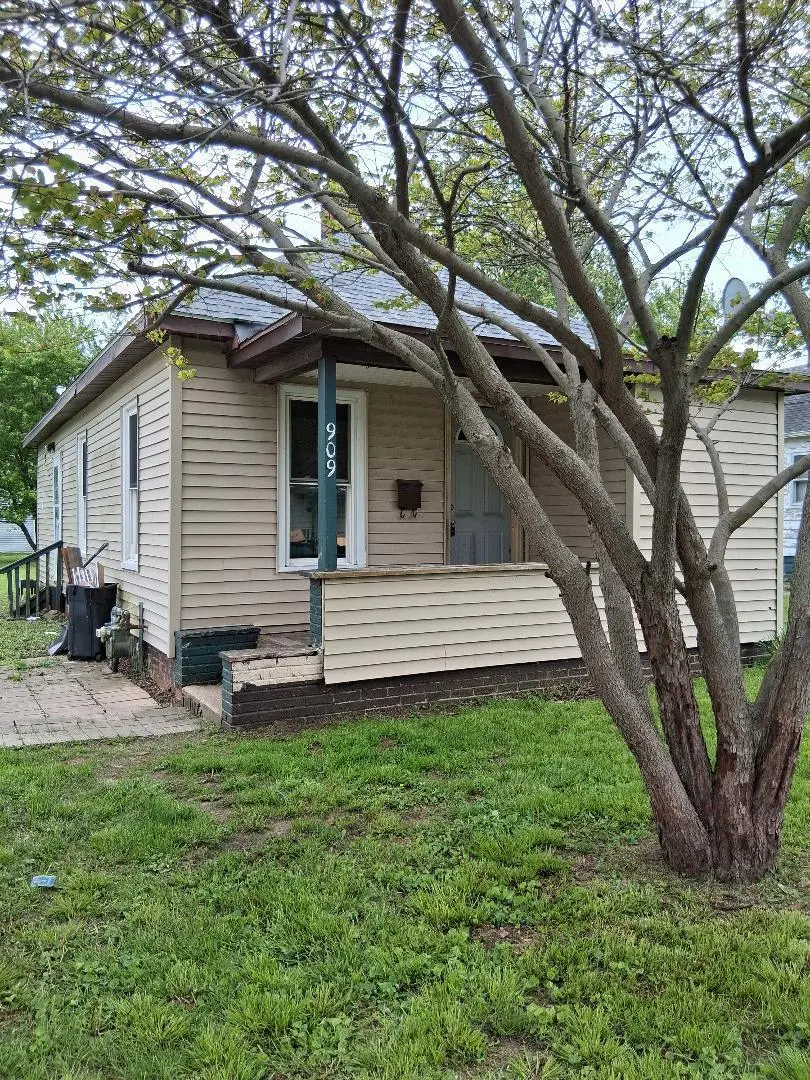
909 Cable St · Streator, IL
Flood risk 1/10 · Minimal
- FEMA flood zone
- X (unshaded)
- Chance of flooding over 30 yrs
- 0.0%
- Est. flood insurance / yr
- $473 – $860
Fire risk 1/10 · Minimal
- Est. fire insurance / yr
- $804 – $1,492
Heat risk 3/10 · Minor
- Hot days now (above 104°F)
- 7 days/yr
- Hot days in 30 yrs
- 17 days/yr
Wind risk 2/10 · Minimal
- Chance of severe wind over 30 yrs
- 1.0%
Air-quality risk 2/10 · Minimal
- Unhealthy air days now
- 1 days/yr
- Unhealthy air days in 30 yrs
- 1 days/yr
Risk factors via First Street. Map © Google.
Why this score? — see what drove the B grade
The composite is a weighted blend of 9 inputs, each scored 0–100. Each bar is that input's sub-score; the figure is the points it added to the 100-point composite (weight × sub-score).
- Cash flow +30.0/30.0
- ARV discount +15.0/15.0
- 1% rule +10.0/10.0
- DSCR +10.0/10.0
- Livability +3.2/5.0
- Rent growth +2.5/5.0
- Condition / age +2.5/5.0
- Schools +1.3/10.0
- Appreciation +0.0/10.0
$45,000
🖨 Deal sheet (PDF) 📄 Offer letter ✓ Due diligence
Listing remarks
This is a fantastic opportunity to gain sweet equity. This charming 2 bedroom, 1 bathroom home is located on a nice lot and has an abundance of potential. It has newer windows and a bonus room that could be used as an office or a 3rd bedroom. This home needs some of your TLC and is being "Sold as is".
Key facts
- 2 parking spots
- Built 1889
- Listed 44 days
Property features AI
Finance
- Other: Possession at closing
- HOA & community: No master association fee required
Exterior
- Parking: Driveway with space for 2 vehicles
- Utilities: Public water; Public sewer
- Home design: Detached single-family home; One-story; Fee simple ownership; Built more than 100 years ago; Property was built before 1978
- Construction: Vinyl siding
- Exterior features: Lot under 0.25 acre; Lot dimensions: 7087
Interior
- Kitchen: Range; Refrigerator; Kitchen on the main level (7 x 13)
- Bedrooms: 2 bedrooms (both on the main level); Master bedroom on the main level (11 x 7); Second bedroom on the main level (7 x 9)
- Bathrooms: 1 full bathroom
- Heating & cooling: Electric heating
- Interior features: 6 total rooms; Basement is partial with crawl space
- Laundry & utility: Main-level laundry in a laundry closet (4 x 5)
Neighborhood map
What this means for you Summary
Snapshot
- This is a 2-bed/1.0-bath single-family listed at $45k.
Deal economics
- At list price, monthly cash flow is $582 ($7k/yr) — positive.
- The deal already cash-flows at list — no discount required.
- Meets the 1% rule at list price ($1k rent vs $45k).
- Recommended offer: $44k (3.0% below list) — sets the bar for market timing.
- Cap rate 21.8% vs local median 7.8% in Streator — top-decile yield for the area; either an underpriced asset or a hidden risk that comps aren't pricing in. Stress-test before assuming the spread holds.
Location & tenants
- Location reads 63/100 on livability (#752 in IL) — a middle-class / working-renter tenant base. Strengths: cost of living A+, health & safety A+, housing B+; Watch: schools F, amenities F, commute F.
- Streator Twp Hsd 40 (town): math 11% / reading 19% proficiency, ranked #513 of 620 in IL (top 83%) — low school quality limits family demand, transient renter base, plan for 1-2y turnover.
- Market conditions: 87 active listings in the ZIP; 82 units permitted in LaSalle County in 2024 (0 in 5+ unit buildings).
Forward outlook
- Local home prices are declining (-3.0%/yr); year-one equity from $311 of loan paydown is wiped out by about $1k of value loss. Plan a longer hold.
- LaSalle County population projected at -16% by 2050 — secular population decline; favor cash flow + early exit over multi-decade hold.
- At projected returns (-3.0% appreciation + 3.0% rent growth), your $13k cash investment doubles in ~3 years — after that, you're playing with house money.
Negotiation context
- It's been on market 45 days — a 3% lower offer ($44k) is reasonable based on typical stale-listing flexibility.
Risks & watch-outs
- Watch-outs: built in 1889 — expect roof / HVAC / electrical / plumbing capex.
Questions for the listing agent
- It's been on market 45 days. Have you received any prior offers? Is the seller open to a 3% concession, seller financing, or rate buy-down credit?
- Built in 1889 — when were the roof, HVAC, electrical panel, plumbing, and water heater last replaced?
- Is there a deadline driving the sale (1031 exchange, divorce, estate, relocation)? That informs how much negotiation room exists.
- Schools are F-rated, which usually means shorter tenancies and higher turnover. Who's the typical renter profile here, and what's been the actual vacancy rate?
- What's the average days-on-market for RENTAL listings here right now (not sales)? A rising rental-DOM trend means longer vacancies and softer asking-rent achievability than the comps imply.
- What's the recent tenant-quality profile in this submarket — average credit score on applications, eviction rate, late-payment / NSF rate, and stable-employment percentage? A property-management company in the area should have these aggregated.
- How much new for-sale + rental construction is in the pipeline within 1–3 miles? Heavy new supply typically softens prices + rents 12–24 months out; constrained supply supports both.
Investment metrics
- 1% rule
- 2.42% ✓
- Cap rate
- 21.81%
- Cash-on-cash
- 55.43%
- DSCR
- 3.47
- GRM
- 3.4
CMA / ARV
- ARV (on-the-fly)
- $73,932
- Comps found
- 5
Show comp detail 5 sales within ~0.75 mi
| Address | Dist | Beds/Ba | Sqft | Sold | Price | $/sf | Match |
|---|---|---|---|---|---|---|---|
| 1004 Hall St | 0.37mi | 2/1.0 | 688 (-6%) | 10mo | $84,900 | $123 | 64 |
| 1024 E 12th St | 0.32mi | 2/1.0 | 800 (+9%) | 13mo | $105,000 | $131 | 59 |
| 1505 S Bloomington St | 0.53mi | 2/1.0 | 786 (+7%) | 8mo | $79,000 | $101 | 56 |
| 208 W 12th St | 0.60mi | 3/1.0 (+1) | 778 (+6%) | 2mo | $37,500 | $48 | 54 |
| 409 E 12th St | 0.24mi | 2/1.0 | 840 (+15%) | 15mo | $72,200 | $86 | 52 |
Match score weights: distance 35% · size 25% · config 20% · recency 20%. Top-matched comps best support the ARV.
Projected returns pro-forma
-3.0% appreciation · 3.0% rent growth · sell at horizon
- IRR
- 53.7%
- Equity multiple
- 3.36×
- Total profit
- $29,773
- Equity at exit
- $6,710
- IRR
- 58.9%
- Equity multiple
- 6.84×
- Total profit
- $73,643
- Equity at exit
- $3,891
Cash invested: $12,600 (down + closing). Projections, not guarantees.
Landlord ↔ Tenant lean methodology
- Overall (STATE)
- 43 Moderately Tenant-Leaning
- State Illinois
- 43 Moderately Tenant-Leaning · D+7
- County
- — inherits STATE
- City
- — inherits STATE
ZIP-level market 61364
- Home prices YoY
- -31.1%
- Active inventory
- 87
- Price-to-rent
- 3.4×
Monthly cashflow live
- Estimated rent
- $1,089 medium interval (Pro) →
- Mortgage (P&I)
- −$236
- Tax from tax record
- −$24 /mo · $282/yr
- Insurance
- −$19
- HOA
- −$0
- Vacancy / Maint / Mgmt
- −$229
- Net cashflow
- $582
Break-even live
Sensitivity live
| Price | -10% $607 | -5% $595 | +0% $582 | +5% $569 | +10% $557 |
|---|---|---|---|---|---|
| Rent | -10% $496 | -5% $539 | +0% $582 | +5% $625 | +10% $668 |
| Rate | -1.0pp $605 | -0.5pp $593 | base $582 | +0.5pp $570 | +1.0pp $558 |
UW: 25.0% down · 7.5% · 30yr · 1.5% tax · 5.0% vac · 8.0% maint · 8.0% mgmt
Financing live
Cash to close
- Down payment
- $11,250
- Closing costs
- $1,350
- Reserves months
- —
- Total cash needed
- —
Loan-product check · same deal, 3 products live
Conventional
25% down · 7.5% · 30yr
- Down + closing
- —
- Monthly P&I
- —
- Monthly cashflow
- —
- DSCR
- —
- Eligible?
- —
Personal DTI + credit; lowest rate.
DSCR
20% down · 8.5% · 30yr
- Down + closing
- —
- Monthly P&I
- —
- Monthly cashflow
- —
- DSCR
- —
- Eligible?
- —
No personal income docs; deal must DSCR.
Hard money
10% down · 12.0% · 12mo
- Down + closing
- —
- Monthly P&I
- —
- Monthly cashflow
- —
- DSCR
- —
- Eligible?
- —
Short-term bridge; refi at stabilization.
Listing history 18 events
-
2026-06-19pricedays on market $45,000 Active 45 DOM
-
2026-06-18days on market $59,900 Active 44 DOM
-
2026-06-17days on market $59,900 Active 43 DOM
-
2026-06-16days on market $59,900 Active 42 DOM
-
2026-06-15days on market $59,900 Active 41 DOM
-
2026-06-14days on market $59,900 Active 39 DOM
-
2026-06-12pricedays on market $59,900 Active 38 DOM
-
2026-06-09days on market $65,000 Active 35 DOM
-
2026-06-08days on market $65,000 Active 34 DOM
-
2026-06-07days on market $65,000 Active 33 DOM
-
2026-06-05days on market $65,000 Active 30 DOM
-
2026-06-03days on market $65,000 Active 29 DOM
-
2026-06-02days on market $65,000 Active 28 DOM
-
2026-06-01days on market $65,000 Active 27 DOM
-
2026-05-31days on market $65,000 Active 26 DOM
-
2026-05-30days on market $65,000 Active 25 DOM
-
2026-05-20price $65,000
-
2026-05-04$75,000 Active
ⓘ Source: listings_history table (triggers on properties + properties_extension) + one-shot
backfill from property_details.listing_events for pre-trigger history.
Tax reassessment forecast IL · Partial reset (capped growth)
- Current annual tax
- $282 · $24/mo
- Projected year-2 tax
- $652 · $54/mo
- Expected delta
- +$370/yr (+$31/mo · 131.1%)
ⓘ Screening estimate from a state-policy table — verify with the county assessor before closing.
Climate risk First Street
- Flood 1/10 Low FEMA zone X (unshaded) · 0% chance over 30 yrs
- Wildfire 1/10 Low
- Heat 3/10 Moderate 7 d/yr ≥104°F today · 17 d/yr by 30 yrs out
- Wind 2/10 Low 100% chance of damaging wind over 30 yrs
- Air quality 2/10 Low 1 unhealthy d/yr today · 1 by 30 yrs out
Nearby sold comps map
Loading sold comps map…
Walkable amenities ~0.75 mi
Loading nearby amenities…
Taxation est. · year 1
- Rental income
- $13,067
- − Mortgage interest
- −$2,521
- − Property taxes
- −$282
- − Insurance
- −$225
- − Repairs & maintenance
- −$1,045
- − Management
- −$1,045
- − Depreciation
- −$1,309
- Taxable income
- $6,640
- Est. tax owed @ 24.0%
- −$1,594
- After-tax cash flow
- $5,391/yr
For passive investors: Depreciation is non-cash, so a rental often shows a tax loss while cash-flowing — sheltering income. Rental losses are passive: they offset passive income freely, and up to $25,000/yr can offset ordinary (W-2) income if you actively participate and your MAGI is under $100k (phasing out to $0 by $150k); unused losses carry forward. On sale, claimed depreciation is recaptured at up to 25%, and gains may owe capital-gains tax (a 1031 exchange can defer both). Figures are a year-1 estimate at your 24.0% rate — not tax advice; consult a CPA.
Schools (NCES district)
- District
- Streator Twp Hsd 40
- NCES district ID
- 1738100
- Math proficiency
- 11% ▼ -4.00%
- Reading proficiency
- 19% ▼ -1.00%
- Median HH income
- $43,002
- Composite
- 13.07/100
- National rank
- #9561
- State rank
- #513 of 620 in IL
Livability — Streator
- Score
- 63/100
- State rank
- #752
- US rank
- #15266
Category grades
Schools grade is shown separately in the Schools card above.
Census & demographics
- Census place
- Streator, IL
- County
- La Salle County · 41,676 people
- City population
- 17,963
- Metro
- Ottawa, IL
- Population (ZIP)
- 17,963
- Household income
- $59,060
- Rent vs Own
- Severe rent burden
- 450.0
Population outlook (LaSalle County) Hauer SSP2
- Today (2025)
- 107,080 people
- By 2030
- 104,196 · -2.7%
- By 2040
- 97,413 · -9.0%
- By 2050
- 90,294 · -15.7%
- By 2075
- 76,252 · -28.8%
- By 2100
- 61,339 · -42.7%
Race, ethnicity, and origin ACS 2023
- Neighborhood character
- Predominantly White (83%)
- Race & ethnicity
- White 83% Hispanic / Latino 11% Two or more races 4% Black 3%
- Hispanic origin (detail)
- Mexican 10%
- Common ancestry
- Romanian 3% Lithuanian 2% Slovak 2%
- Foreign-born
- 3% · Canada
- Languages at home
- 93% English-only · Spanish 6%
Political lean MEDSL · LaSalle
- 2024 margin
- R (+18.5) · D 40.1% · R 58.6% · Other 1.3%
- 2008→2024 swing
- -29.6pp toward R · 2008: 11.1pp · 2024: -18.5pp
- All cycles
- 2024: R+18.5 2020: R+14.3 2016: R+14.4 2012: R+0.4 2008: D+11.1
Not yet ingested
- Civics
- —
Market trends
- HPI YoY
- ▼ -105.28%
- Current HPI
- 233.5533
- Rent YoY
- —
- Metro
- Ottawa, IL
- State GDP YoY
- ▲ 1.59%
- F500 in state
- 60
Industry mix (Fortune 500 HQ in IL)
| Industry | F500 HQs | Revenue |
|---|---|---|
| Insurance | 4 | $201B |
|
||
| Consumer Goods | 4 | $87B |
|
||
| Industrial Machinery | 3 | $64B |
|
||
| Healthcare | 2 | $55B |
|
||
| Retail / Pharmacy | 1 | $148B |
|
||
| Agriculture / Food | 1 | $86B |
|
||
Price history
-13.3% since first listed2 events — show timeline
- 2026-05-20 Price Changed $65,000 MRED as Distributed by MLS Grid
- 2026-05-04 Listed $75,000 MRED as Distributed by MLS Grid
Property tax history
+0.8%/yrLatest (2024): $282 · +15.6% YoY. Source: county tax records.
Cash-flow waterfall
monthlySold comps — $/sqft
last 12 mo · ≤1 miLoading sold comps…