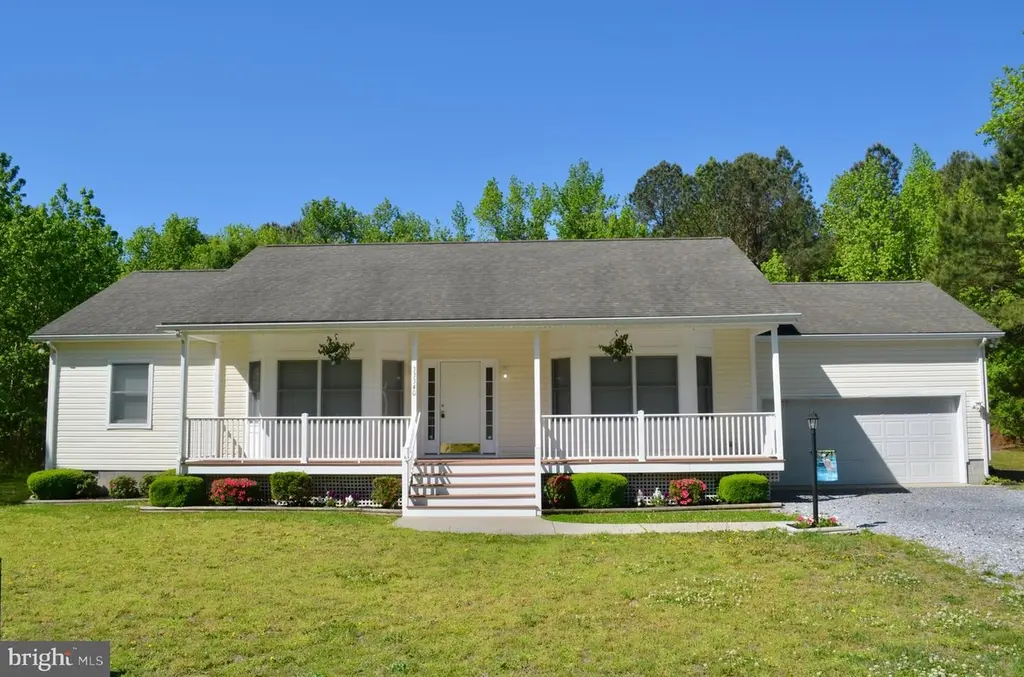
33340 Substation Rd · Millville, DE
Flood risk 1/10 · Minimal
- FEMA flood zone
- X (unshaded)
- Chance of flooding over 30 yrs
- 0.0%
- Est. flood insurance / yr
- $473 – $860
Fire risk 3/10 · Minor
- Est. fire insurance / yr
- $476 – $884
Heat risk 8/10 · Major
- Hot days now (above 100°F)
- 7 days/yr
- Hot days in 30 yrs
- 18 days/yr
Wind risk 8/10 · Major
- Chance of severe wind over 30 yrs
- 80.0%
Air-quality risk 2/10 · Minimal
- Unhealthy air days now
- 0 days/yr
- Unhealthy air days in 30 yrs
- 1 days/yr
Risk factors via First Street. Map © Google.
Why this score? — see what drove the D- grade
The composite is a weighted blend of 9 inputs, each scored 0–100. Each bar is that input's sub-score; the figure is the points it added to the 100-point composite (weight × sub-score).
- ARV discount +11.0/15.0
- Appreciation +10.0/10.0
- Cash flow +6.5/30.0
- Livability +3.2/5.0
- Schools +2.9/10.0
- Rent growth +2.5/5.0
- Condition / age +2.5/5.0
- DSCR +0.8/10.0
- 1% rule +0.2/10.0
$450,000
🖨 Deal sheet (PDF) 📄 Offer letter ✓ Due diligence
Listing remarks
Very Nice 3 bedroom 2 bath home in very good condition. NO HOA. High ceilings, stainless appliances, water conditioner, attached garage. Private setting with trees on three sides, but lot is cleared. Move in ready. A must see for a home in this price range and not too far from shopping and the beaches.
Key facts
- Water conditioner
- Cleared lot
- Stainless appliances
Tags
Property features AI
Finance
- Other: Fee simple ownership; Property in a very good condition; Not in a federal flood zone; Pets allowed (cats and dogs permitted)
Exterior
- Parking: Attached front-entry garage with opener (1 garage space); Driveway with three spaces; Off-street parking; crushed stone surfaces; Total of 4 garage/parking spaces
- Utilities: Well water with conditioner; On-site septic system; Electric service (110 volts); Cable available; Municipal trash not available
- Home design: Detached single-story home; Main entrance faces north
- Construction: Frame construction with vinyl siding; Architectural shingle roof; Crawl space foundation; Double-pane windows; Estimated year built
- Exterior features: Deck(s) and patio(s); Exterior lighting; Gutter system; Sidewalks; Backs to trees; Cleared, private front and rear yards; Rural setting; Unrestricted
Interior
- Kitchen: Dishwasher; Microwave; Single oven; Stove; Refrigerator; Icemaker; Stainless steel appliances; Water conditioner (owned)
- Bedrooms: Three bedrooms on the main level
- Flooring: Carpet; Laminate plank
- Bathrooms: Two full bathrooms (both on the main level)
- Heating & cooling: Heat pump(s) with electric heating; Central air conditioning
- Interior features: Combination kitchen and dining area; Six-panel and sliding glass doors; 9'+ ceilings with drywall; Not furnished
- Laundry & utility: Washer and dryer in unit on the main floor; Electric water heater
Neighborhood map
What this means for you Summary
Snapshot
- This is a 3-bed/2.0-bath single-family listed at $450k.
Deal economics
- At list price, monthly cash flow is $-761 ($-9k/yr) — negative.
- To cash-flow at today's rent, offer at most $316k (29.9% below list).
- To meet the 1% rule (rent ≥ 1% of price), the offer needs to be $236k (47.6% below list).
- Recommended offer: $236k (47.6% below list) — sets the bar for 1% rule.
- Cap rate 4.3% vs local median 2.4% in Millville — top-decile yield for the area; either an underpriced asset or a hidden risk that comps aren't pricing in. Stress-test before assuming the spread holds.
Location & tenants
- Location reads 64/100 on livability (#49 in DE) — a middle-class / working-renter tenant base. Strengths: crime A+, employment A, housing A; Watch: amenities F, commute F, cost of living F.
- Indian River School District (rural): math 25% / reading 41% proficiency, ranked #14 of 26 in DE (top 54%) — families likely to look elsewhere, expect single-tenant / working-renter base with shorter leases.
- Zoned schools: Lord Baltimore Elementary School (math 51% / reading 67%, grade B-, #4 of 105 statewide, top 4%, 579 students, 0% FRL); Selbyville Middle School (math 20% / reading 49%, grade F, #12 of 36 statewide, top 34%, 719 students, 0% FRL); Sussex Central High School (math 23% / reading 42%, grade F, #24 of 40 statewide, top 59%, 2,039 students, 0% FRL) — zoned schools average 0% FRL vs 49% district-wide (49 pts lower); this property's tenant base skews higher-income than the district average.
- Market conditions: 285 active listings in the ZIP; 3 comparable units currently listed for rent nearby; rentals at typical pace (median 15d on market — plan ~3-4 weeks tenant-placement turnaround); 4,354 units permitted in Sussex County in 2024 (344 in 5+ unit buildings).
Forward outlook
- In year one you build about $48k of equity ($3k loan paydown + $45k appreciation (10.0% local appreciation)).
- Sussex County population projected at +25% by 2050 — long-run rental-demand tailwind backs the buy-and-hold thesis.
- By year 2, paydown + projected appreciation supports a ~$77k cash-out refi (75% LTV) — recoverable capital for the next deal without selling this one.
Negotiation context
- It's been on market 43 days — a 3% lower offer ($436k) is reasonable based on typical stale-listing flexibility.
- 2 sale attempts with the ask held roughly flat each time — persistent listings suggest the price (not the market) is what's stuck; bring a comps-based counter.
Risks & watch-outs
- Climate carrying-cost: severe wind risk, 80% chance of damaging wind over 30y; extreme-heat days projected 7→18/yr by 2055 (HVAC capex compounding) — expect insurance premiums to compound above CPI over the hold.
Questions for the listing agent
- What do current leases actually rent for vs. the listed asking? Can we see a recent rent roll and the last 12 months of T-12 income?
- It's been on market 43 days. Have you received any prior offers? Is the seller open to a 48% concession, seller financing, or rate buy-down credit?
- Is there a deadline driving the sale (1031 exchange, divorce, estate, relocation)? That informs how much negotiation room exists.
- Schools are F-rated, which usually means shorter tenancies and higher turnover. Who's the typical renter profile here, and what's been the actual vacancy rate?
- The area grade is low — what's the realistic commute time and amenity access for the typical tenant pool here? Any planned neighborhood developments (good or bad) we should know about?
- What's the average days-on-market for RENTAL listings here right now (not sales)? A rising rental-DOM trend means longer vacancies and softer asking-rent achievability than the comps imply.
- What's the recent tenant-quality profile in this submarket — average credit score on applications, eviction rate, late-payment / NSF rate, and stable-employment percentage? A property-management company in the area should have these aggregated.
- How much new for-sale + rental construction is in the pipeline within 1–3 miles? Heavy new supply typically softens prices + rents 12–24 months out; constrained supply supports both.
Investment metrics
- 1% rule
- 0.52% ✗
- Cap rate
- 4.26%
- Cash-on-cash
- -7.25%
- DSCR
- 0.68
- GRM
- 15.9
CMA / ARV
- ARV (median comp)
- $487,534
- List price
- $450,000
- Delta
- -7.70%
- Verdict
- FAIR
- Comps
- 20 within 1.0 mi
Show comp detail 8 sales within ~0.75 mi
| Address | Dist | Beds/Ba | Sqft | Sold | Price | $/sf | Match |
|---|---|---|---|---|---|---|---|
| 36244 Beaver Dam Rd | 0.45mi | 3/2.0 | 1,480 (-1%) | 4mo | $429,990 | $291 | 74 |
| 34282 Central Ave | 0.22mi | 3/2.0 | 1,600 (+7%) | 17mo | $625,000 | $391 | 64 |
| 35027 Tybee St | 0.38mi | 2/2.5 (-1) | 1,610 (+8%) | 4mo | $460,000 | $286 | 59 |
| 31822 Shad Creek Way | 0.41mi | 3/2.0 | 1,570 (+5%) | 22mo | $499,990 | $318 | 54 |
| 26227 Summerset Blvd | 0.60mi | 3/2.5 | 1,650 (+10%) | 2mo | $450,000 | $273 | 52 |
| 61 Old Forge Dr | 0.71mi | 3/2.0 | 1,604 (+7%) | 15mo | $499,000 | $311 | 42 |
| 51 Old Forge Dr | 0.69mi | 3/2.0 | 1,680 (+12%) | 10mo | $495,000 | $295 | 39 |
| 10 Fairway Dr | 0.63mi | 3/2.0 | 1,676 (+12%) | 14mo | $460,000 | $274 | 39 |
Match score weights: distance 35% · size 25% · config 20% · recency 20%. Top-matched comps best support the ARV.
Projected returns pro-forma
10.0% appreciation · 3.0% rent growth · sell at horizon
- IRR
- 19.1%
- Equity multiple
- 2.56×
- Total profit
- $196,337
- Equity at exit
- $405,396
- IRR
- 17.6%
- Equity multiple
- 5.89×
- Total profit
- $615,784
- Equity at exit
- $874,251
Cash invested: $126,000 (down + closing). Projections, not guarantees.
Landlord ↔ Tenant lean methodology
- Overall (STATE)
- 70 Landlord-Friendly
- State Delaware
- 70 Landlord-Friendly · D+7
- County
- — inherits STATE
- City
- — inherits STATE
ZIP-level market 19945
- Home prices YoY
- 16.9%
- Active inventory
- 285
- Price-to-rent
- 15.9×
Monthly cashflow live
- Estimated rent
- $2,358 medium interval (Pro) →
- Mortgage (P&I)
- −$2,360
- Tax from tax record
- −$77 /mo · $921/yr
- Insurance
- −$188
- HOA
- −$0
- Vacancy / Maint / Mgmt
- −$495
- Net cashflow
- $-761
Break-even live
Sensitivity live
| Price | -10% $-506 | -5% $-634 | +0% $-761 | +5% $-1,402 | +10% $-1,558 |
|---|---|---|---|---|---|
| Rent | -10% $-947 | -5% $-854 | +0% $-761 | +5% $-668 | +10% $-575 |
| Rate | -1.0pp $-535 | -0.5pp $-647 | base $-761 | +0.5pp $-878 | +1.0pp $-996 |
UW: 25.0% down · 7.5% · 30yr · 1.5% tax · 5.0% vac · 8.0% maint · 8.0% mgmt
Financing live
Cash to close
- Down payment
- $112,500
- Closing costs
- $13,500
- Reserves months
- —
- Total cash needed
- —
Loan-product check · same deal, 3 products live
Conventional
25% down · 7.5% · 30yr
- Down + closing
- —
- Monthly P&I
- —
- Monthly cashflow
- —
- DSCR
- —
- Eligible?
- —
Personal DTI + credit; lowest rate.
DSCR
20% down · 8.5% · 30yr
- Down + closing
- —
- Monthly P&I
- —
- Monthly cashflow
- —
- DSCR
- —
- Eligible?
- —
No personal income docs; deal must DSCR.
Hard money
10% down · 12.0% · 12mo
- Down + closing
- —
- Monthly P&I
- —
- Monthly cashflow
- —
- DSCR
- —
- Eligible?
- —
Short-term bridge; refi at stabilization.
Rent comps 3 comps
| Address | Beds | Baths | Sqft | Rent | $/sqft | DOM | Units | Dist |
|---|---|---|---|---|---|---|---|---|
| 35205 Tupelo Cir Frankford, DE | 1.0–3.0 | 1.0–2.0 | 1046 | $2,444 | $2.34 | 15d | 21 | 1.20mi |
| 21 Village Green Dr Ocean View, DE | 3.0 | 2.5 | 2076 | $2,445 | $1.18 | 15d | 3 | 1.33mi |
| 33697 Ashland Dr Frankford, DE | 3.0 | 2.0 | 1696 | $2,200 | $1.30 | 45d | 1 | 1.43mi |
Listing history 19 events
-
2026-06-21days on market $450,000 Active 43 DOM
-
2026-06-18days on market $450,000 Active 40 DOM
-
2026-06-17days on market $450,000 Active 39 DOM
-
2026-06-16days on market $450,000 Active 38 DOM
-
2026-06-15days on market $450,000 Active 37 DOM
-
2026-06-14days on market $450,000 Active 35 DOM
-
2026-06-13days on market $450,000 Active 34 DOM
-
2026-06-10days on market $450,000 Active 32 DOM
-
2026-06-09days on market $450,000 Active 31 DOM
-
2026-06-08days on market $450,000 Active 30 DOM
-
2026-06-07days on market $450,000 Active 29 DOM
-
2026-06-02days on market $450,000 Active 24 DOM
-
2026-06-01days on market $450,000 Active 23 DOM
-
2026-05-31days on market $450,000 Active 22 DOM
-
2026-05-30days on market $450,000 Active 21 DOM
-
2026-05-09$450,000 Active 303-char remark
-
2026-05-05historical
-
2026-03-27$450,000 Active
-
2026-03-23historical
ⓘ Source: listings_history table (triggers on properties + properties_extension) + one-shot
backfill from property_details.listing_events for pre-trigger history.
Tax reassessment forecast DE · Partial reset (capped growth)
- Current annual tax
- $921 · $77/mo
- Projected year-2 tax
- $1,766 · $147/mo
- Expected delta
- +$844/yr (+$70/mo · 91.7%)
ⓘ Screening estimate from a state-policy table — verify with the county assessor before closing.
Climate risk First Street
- Flood 1/10 Low FEMA zone X (unshaded) · 0% chance over 30 yrs
- Wildfire 3/10 Moderate
- Heat 8/10 Severe 7 d/yr ≥100°F today · 18 d/yr by 30 yrs out
- Wind 8/10 Severe 80% chance of damaging wind over 30 yrs
- Air quality 2/10 Low 0 unhealthy d/yr today · 1 by 30 yrs out
Nearby sold comps map
Loading sold comps map…
Walkable amenities ~0.75 mi
Loading nearby amenities…
Taxation est. · year 1
- Rental income
- $28,297
- − Mortgage interest
- −$25,207
- − Property taxes
- −$921
- − Insurance
- −$2,250
- − Repairs & maintenance
- −$2,264
- − Management
- −$2,264
- − Depreciation
- −$13,091
- Taxable loss
- −$17,699
- Est. tax savings @ 24.0%
- +$4,248
- After-tax cash flow
- $-4,887/yr
For passive investors: Depreciation is non-cash, so a rental often shows a tax loss while cash-flowing — sheltering income. Rental losses are passive: they offset passive income freely, and up to $25,000/yr can offset ordinary (W-2) income if you actively participate and your MAGI is under $100k (phasing out to $0 by $150k); unused losses carry forward. On sale, claimed depreciation is recaptured at up to 25%, and gains may owe capital-gains tax (a 1031 exchange can defer both). Figures are a year-1 estimate at your 24.0% rate — not tax advice; consult a CPA.
Schools (NCES district)
- District
- Indian River School District
- NCES district ID
- 1000680
- Math proficiency
- 25% ▼ -27.00%
- Reading proficiency
- 41% ▼ -17.00%
- Median HH income
- $53,838
- Composite
- 28.99/100
- National rank
- #6620
- State rank
- #14 of 26 in DE
Livability — Millville
- Score
- 64/100
- State rank
- #49
- US rank
- #13839
Category grades
Schools grade is shown separately in the Schools card above.
Census & demographics
- City population
- 2,093
- Population (ZIP)
- 8,917
Population outlook (Sussex County) Hauer SSP2
- Today (2025)
- 248,853 people
- By 2030
- 264,464 · +6.3%
- By 2040
- 290,980 · +16.9%
- By 2050
- 311,259 · +25.1%
- By 2075
- 352,488 · +41.6%
- By 2100
- 367,406 · +47.6%
Race, ethnicity, and origin ACS 2023
- Neighborhood character
- Predominantly White (77%)
- Race & ethnicity
- White 77% Black 12% Hispanic / Latino 8% Two or more races 7%
- Hispanic origin (detail)
- Mexican 4%
- Common ancestry
- Romanian 3% Slovak 3% Lithuanian 1%
- Foreign-born
- 5% · Canada
- Languages at home
- 91% English-only · Spanish 8%
Political lean MEDSL · Sussex
- 2024 margin
- R (+11.0) · D 43.9% · R 54.9% · Other 1.2%
- 2008→2024 swing
- -2.4pp toward R · 2008: -8.6pp · 2024: -11.0pp
- All cycles
- 2024: R+11.0 2020: R+11.2 2016: R+22.0 2012: R+13.0 2008: R+8.6
Not yet ingested
- Civics
- —
Market trends
- HPI YoY
- ▲ 46.51%
- Current HPI
- 322.2407
- Rent YoY
- —
- Metro
- —
- State GDP YoY
- —
- F500 in state
- 0
Price history
+0.0% since first listed4 events — show timeline
- 2026-05-09 Listed $450,000 BRIGHT MLS
- 2026-05-05 Listing Removed — BRIGHT MLS
- 2026-03-27 Listed $450,000 BRIGHT MLS
- 2026-03-23 Coming Soon — BRIGHT MLS
Property tax history
+3.1%/yrLatest (2025): $921 · +14.6% YoY. Source: county tax records.
Cash-flow waterfall
monthlySold comps — $/sqft
last 12 mo · ≤1 miLoading sold comps…