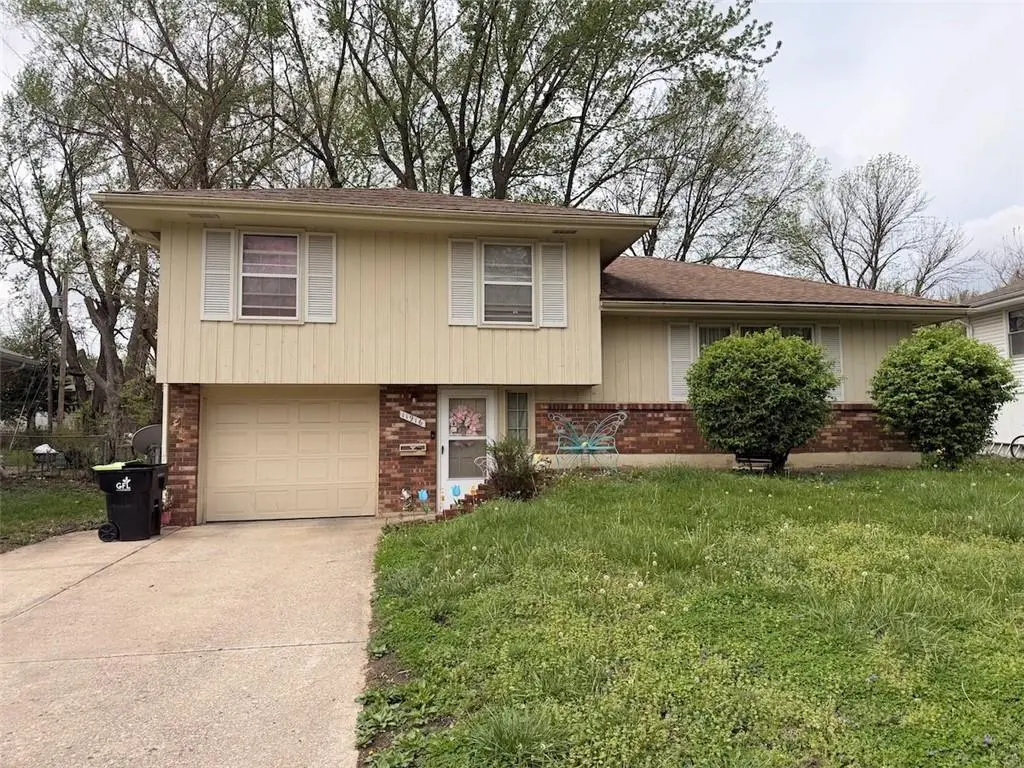
11916 Armitage Dr · Grandview, MO
Flood risk 7/10 · Major
- FEMA flood zone
- X (unshaded)
- Chance of flooding over 30 yrs
- 0.99%
- Est. flood insurance / yr
- $473 – $860
Fire risk 2/10 · Minimal
- Est. fire insurance / yr
- $1,054 – $1,958
Heat risk 4/10 · Minor
- Hot days now (above 106°F)
- 7 days/yr
- Hot days in 30 yrs
- 17 days/yr
Wind risk 2/10 · Minimal
- Chance of severe wind over 30 yrs
- —
Air-quality risk 3/10 · Minor
- Unhealthy air days now
- 3 days/yr
- Unhealthy air days in 30 yrs
- 3 days/yr
Risk factors via First Street. Map © Google.
Why this score? — see what drove the C- grade
The composite is a weighted blend of 9 inputs, each scored 0–100. Each bar is that input's sub-score; the figure is the points it added to the 100-point composite (weight × sub-score).
- Cash flow +17.5/30.0
- ARV discount +15.0/15.0
- DSCR +5.5/10.0
- 1% rule +4.3/10.0
- Rent growth +4.0/5.0
- Livability +3.1/5.0
- Condition / age +2.5/5.0
- Schools +1.1/10.0
- Appreciation +0.0/10.0
$170,000
🖨 Deal sheet 📄 Offer letter ✓ Due diligence
Listing remarks
Split-level home with solid bones and a classic, functional floor plan. Previously used as a rental, this home offers strong potential as a continued investment or an excellent option for an owner-occupant looking to build equity over time. Featuring 3 bedrooms, 1.5 baths, multiple living areas, and abundant natural light, it provides a great foundation for a refresh or light renovation. Additional highlights include a 1-car garage, basement storage, and a spacious fenced-backyard with mature trees and a patio, ideal for outdoor living and future enhancements. Convenient location with easy access to highways, shopping, schools, entertainment, and more. Property is being sold in its present
Key facts
- Patio
- Mature trees
- 8,516 sq ft lot
Tags
Property features AI
Exterior
- Parking: Attached 2-car garage
- Security: Smoke detector(s)
- Utilities: Public water; Public sewer
- Home design: Single-family residence; 1.5 stories, split entry; Residential property
- Construction: Wood siding exterior; Composition roof
- Exterior features: Metal fencing; Paved road access
Interior
- Bedrooms: 3 bedrooms (all carpet)
- Flooring: Carpet; Vinyl
- Bathrooms: 1 full bathroom (vinyl flooring)
- Heating & cooling: Natural gas heating; Electric cooling
- Interior features: Living/dining combo; Full basement; Smoke detectors
- Laundry & utility: Laundry area in garage
Neighborhood map
What this means for you Summary
Snapshot
- This is a 3-bed/1.5-bath single-family listed at $170k.
Deal economics
- At list price, monthly cash flow is $75 ($896/yr) — positive.
- The deal already cash-flows at list — no discount required.
- To meet the 1% rule (rent ≥ 1% of price), the offer needs to be $158k (7.2% below list).
- Recommended offer: $158k (7.2% below list) — sets the bar for 1% rule.
- Cap rate 7.2% vs local median 5.0% in Grandview — top-decile yield for the area; either an underpriced asset or a hidden risk that comps aren't pricing in. Stress-test before assuming the spread holds.
Location & tenants
- Location reads 61/100 on livability (#454 in MO) — a middle-class / working-renter tenant base. Strengths: cost of living A+, housing A+; Watch: schools D, employment D, crime F.
- Hickman Mills C-1 (urban): math 8% / reading 18% proficiency, ranked #314 of 324 in MO (top 97%) — low school quality limits family demand, transient renter base, plan for 1-2y turnover; 78% free/reduced lunch — lower-income household profile, screen leases tightly.
- Market conditions: Rents rising fast (+6.1%/yr); 116 active listings in the ZIP; 36 comparable units currently listed for rent nearby; rentals at typical pace (median 24d on market — plan ~3-4 weeks tenant-placement turnaround); 4,002 units permitted in Jackson County in 2024 (2,271 in 5+ unit buildings).
- This rent runs 36% of the median local income ($53k/yr) — at the standard rent-burdened threshold; future hikes will face affordability resistance.
Forward outlook
- Local home prices are declining (-3.0%/yr); year-one equity from $1k of loan paydown is wiped out by about $5k of value loss. Plan a longer hold.
- Jackson County population projected at +4% by 2050 — modest demand growth; plan on rents tracking national, not racing it.
Negotiation context
- It's been on market 16 days — a 2% lower offer ($167k) is reasonable based on typical stale-listing flexibility.
Risks & watch-outs
- Watch-outs: flood insurance adds $56/mo.
- Climate carrying-cost: major flood risk — expect insurance premiums to compound above CPI over the hold.
Questions for the listing agent
- Built in 1967 — when were the roof, HVAC, electrical panel, plumbing, and water heater last replaced?
- What's the actual annual flood-insurance premium (NFIP or private), and is the property in a SFHA with mandatory coverage?
- Is there a deadline driving the sale (1031 exchange, divorce, estate, relocation)? That informs how much negotiation room exists.
- Schools are D-rated, which usually means shorter tenancies and higher turnover. Who's the typical renter profile here, and what's been the actual vacancy rate?
- Crime grade is F in this area — have there been break-ins, vandalism, or insurance claims at this property in the last 3 years? What carrier currently insures it and at what premium?
- What's the average days-on-market for RENTAL listings here right now (not sales)? A rising rental-DOM trend means longer vacancies and softer asking-rent achievability than the comps imply.
- What's the recent tenant-quality profile in this submarket — average credit score on applications, eviction rate, late-payment / NSF rate, and stable-employment percentage? A property-management company in the area should have these aggregated.
- How much new for-sale + rental construction is in the pipeline within 1–3 miles? Heavy new supply typically softens prices + rents 12–24 months out; constrained supply supports both.
Investment metrics
- 1% rule
- 0.93% ✗
- Cap rate
- 7.21%
- Cash-on-cash
- 3.28%
- DSCR
- 1.15
- GRM
- 9.0
CMA / ARV
- ARV (median comp)
- $217,864
- List price
- $170,000
- Delta
- -21.97%
- Verdict
- UNDERPRICED
- Comps
- 20 within 1.0 mi
Show comp detail 12 sales within ~0.75 mi
| Address | Dist | Beds/Ba | Sqft | Sold | Price | $/sf | Match |
|---|---|---|---|---|---|---|---|
| 11916 Armitage Dr | 0.00mi | 3/1.0 | 1,292 (0%) | 0mo | $170,000 | $132 | 98 |
| 11804 Fuller Ave | 0.23mi | 3/2.5 | 1,292 (0%) | 0mo | $200,000 | $155 | 85 |
| 6302 E 120th Ter | 0.10mi | 3/2.0 | 1,292 (0%) | 10mo | $225,000 | $174 | 85 |
| 12003 Belmont Ave | 0.09mi | 3/2.0 | 1,258 (-3%) | 9mo | $250,000 | $199 | 82 |
| 12005 Belmont Ave | 0.10mi | 3/1.0 | 1,196 (-7%) | 1mo | $225,000 | $188 | 80 |
| 6401 E 120th Ter | 0.13mi | 3/1.0 | 1,245 (-4%) | 7mo | $177,500 | $143 | 80 |
| 12011 Belmont Ave | 0.13mi | 3/1.0 | 1,196 (-7%) | 1mo | $198,000 | $166 | 79 |
| 11705 Belmont Ave | 0.26mi | 3/2.0 | 1,414 (+9%) | 1mo | $209,000 | $148 | 69 |
| 12018 Belmont Ave | 0.16mi | 3/2.0 | 1,104 (-15%) | 8mo | $139,950 | $127 | 59 |
| 11524 Sunnyslope Dr | 0.56mi | 3/2.0 | 1,208 (-6%) | 8mo | $219,500 | $182 | 55 |
| 11410 Sunnyslope Dr | 0.70mi | 3/1.0 | 1,336 (+3%) | 11mo | $215,000 | $161 | 51 |
| 6608 E 124th St | 0.59mi | 3/2.0 | 1,485 (+15%) | 1mo | $299,950 | $202 | 45 |
Match score weights: distance 35% · size 25% · config 20% · recency 20%. Top-matched comps best support the ARV.
Projected returns pro-forma
-3.0% appreciation · 6.1% rent growth · sell at horizon
- IRR
- -9.9%
- Equity multiple
- 0.63×
- Total profit
- $-17,693
- Equity at exit
- $25,348
- IRR
- 3.3%
- Equity multiple
- 1.27×
- Total profit
- $13,005
- Equity at exit
- $14,698
Cash invested: $47,600 (down + closing). Projections, not guarantees.
Landlord ↔ Tenant lean methodology
- Overall (STATE)
- 81 Strongly Landlord-Friendly
- State Missouri
- 81 Strongly Landlord-Friendly · R+10
- County
- — inherits STATE
- City
- — inherits STATE
ZIP-level market 64030
- Home prices YoY
- -30.7%
- Rents YoY
- 6.1%
- Active inventory
- 116
- Price-to-rent
- 9.0×
Monthly cashflow live
- Estimated rent
- $1,578 high interval (Pro) →
- Mortgage (P&I)
- −$891
- Tax from tax record
- −$154 /mo · $1,852/yr
- Insurance
- −$71
- Flood insurance flood zone
- −$56 /mo · $666/yr
- HOA
- −$0
- Vacancy / Maint / Mgmt
- −$331
- Net cashflow
- $75
Break-even live
UW: 25.0% down · 7.5% · 30yr · 1.5% tax · 5.0% vac · 8.0% maint · 8.0% mgmt
Financing live
Cash to close
- Down payment
- $42,500
- Closing costs
- $5,100
- Reserves months
- —
- Total cash needed
- —
Loan-product check · same deal, 3 products live
Conventional
25% down · 7.5% · 30yr
- Down + closing
- —
- Monthly P&I
- —
- Monthly cashflow
- —
- DSCR
- —
- Eligible?
- —
Personal DTI + credit; lowest rate.
DSCR
20% down · 8.5% · 30yr
- Down + closing
- —
- Monthly P&I
- —
- Monthly cashflow
- —
- DSCR
- —
- Eligible?
- —
No personal income docs; deal must DSCR.
Hard money
10% down · 12.0% · 12mo
- Down + closing
- —
- Monthly P&I
- —
- Monthly cashflow
- —
- DSCR
- —
- Eligible?
- —
Short-term bridge; refi at stabilization.
Rent comps 36 comps
| Address | Beds | Baths | Sqft | Rent | $/sqft | DOM | Units | Dist |
|---|---|---|---|---|---|---|---|---|
| 6731 E 119th St Grandview, MO | 1.0–2.0 | 1.0–2.0 | 762 | $1,150 | $1.51 | 1d | 14 | 0.23mi |
| 11720 Newton Ave Kansas City, MO | 2.0–3.0 | 1.5–3.0 | 1293 | $1,699 | $1.31 | 1d | 9 | 0.33mi |
| 11805 Lawndale Ave Kansas City, MO | 3.0 | 1.0 | 1152 | $1,565 | $1.36 | 23d | 1 | 0.46mi |
| 11803 Holiday Dr #5 Kansas City, MO | 1.0–3.0 | 1.0 | 1016 | $1,130 | $1.11 | 1d | 1 | 0.48mi |
| 6904 Longview Rd Kansas City, MO | 4.0 | 1.0 | 900 | $1,850 | $2.06 | 1d | 1 | 0.72mi |
| 7104 Longview Rd Kansas City, MO | 3.0 | 1.0 | 912 | $1,275 | $1.40 | 14d | 1 | 0.79mi |
| 11407 Winchester Ave Kansas City, MO | 3.0 | 1.0 | 936 | $1,360 | $1.45 | 3d | 1 | 0.80mi |
| 11923 Manchester Ave Grandview, MO | 3.0 | 2.0 | 1407 | $1,815 | $1.29 | 43d | 1 | 0.94mi |
| 11513 Richmond Ave Kansas City, MO | 3.0 | 1.5 | 1114 | $1,450 | $1.30 | 14d | 1 | 0.94mi |
| 6905 E 112th St Kansas City, MO | 3.0 | 1.0 | 972 | $1,550 | $1.59 | 43d | 1 | 0.96mi |
| 11934 Sycamore Ave Grandview, MO | 3.0 | 2.0 | 1414 | $1,806 | $1.28 | 43d | 1 | 0.97mi |
| 11127 Blue Ridge Blvd Kansas City, MO | 3.0 | 1.0 | 1000 | $1,599 | $1.60 | 43d | 1 | 1.01mi |
| 1325 Duck Rd Grandview, MO | 3.0 | 1.5 | 1480 | $1,600 | $1.08 | 43d | 1 | 1.03mi |
| 8006 E 118th Ter Kansas City, MO | 3.0 | 1.5 | 1132 | $1,450 | $1.28 | 20d | 1 | 1.07mi |
| 11421 Manchester Ave Kansas City, MO | 4.0 | 1.0 | 1176 | $1,550 | $1.32 | 4d | 1 | 1.09mi |
| 6201 E Red Bridge Rd Kansas City, MO | 3.0 | 2.0 | 1592 | $1,645 | $1.03 | 16d | 1 | 1.09mi |
| 7114 E 112th St Kansas City, MO | 4.0 | 1.0 | 936 | $1,850 | $1.98 | 23d | 1 | 1.11mi |
| 11410 Palmer Ave Kansas City, MO | 4.0 | 2.0 | 936 | $1,300 | $1.39 | 43d | 1 | 1.12mi |
| 7508 E 127th Pl Grandview, MO | 3.0 | 2.0 | 1396 | $1,945 | $1.39 | 1d | 1 | 1.15mi |
| 11206 Corrington Ave Kansas City, MO | 4.0 | 1.5 | 1176 | $1,595 | $1.36 | 23d | 1 | 1.15mi |
| 7119 E 111th Ter Kansas City, MO | 3.0 | 1.0 | 912 | $1,349 | $1.48 | 43d | 1 | 1.18mi |
| 11009 Ewing Ave Kansas City, MO | 4.0 | 1.0 | 1416 | $1,595 | $1.13 | 43d | 1 | 1.20mi |
| 11406 Sycamore Ter Kansas City, MO | 3.0 | 1.0 | 912 | $1,450 | $1.59 | 16d | 1 | 1.24mi |
| 11116 Bristol Ter Kansas City, MO | 3.0 | 1.0 | 956 | $1,390 | $1.45 | 23d | 1 | 1.25mi |
| 7305 E 111th Ter Kansas City, MO | 4.0 | 1.0 | 1100 | $1,345 | $1.22 | 14d | 1 | 1.28mi |
| 7610 E 113th St Kansas City, MO | 4.0 | 2.0 | 1176 | $1,700 | $1.45 | 43d | 1 | 1.29mi |
| 7405 E 112th St Kansas City, MO | 4.0 | 1.0 | 936 | $1,850 | $1.98 | 43d | 1 | 1.29mi |
| 11210 Manchester Ave Kansas City, MO | 4.0 | 1.0 | 1200 | $1,395 | $1.16 | 23d | 1 | 1.32mi |
| 11354 Sycamore Ter Kansas City, MO | 4.0 | 1.0 | 1176 | $1,850 | $1.57 | 1d | 1 | 1.33mi |
| 11206 Norby Rd Kansas City, MO | 3.0 | 1.0 | 1025 | $1,375 | $1.34 | 23d | 1 | 1.36mi |
| 12712 7th St Grandview, MO | 3.0 | 2.0 | 1050 | $1,545 | $1.47 | 12d | 1 | 1.39mi |
| 7801 E 113th St Kansas City, MO | 3.0 | 1.0 | 1341 | $1,450 | $1.08 | 16d | 1 | 1.40mi |
| 5705 E 109th Ter Kansas City, MO | 3.0 | 1.0 | 1545 | $1,395 | $0.90 | 43d | 1 | 1.40mi |
| 11316 Donnelly Ave Kansas City, MO | 3.0 | 1.0 | 1000 | $1,475 | $1.48 | 43d | 1 | 1.44mi |
| 7415 E 110th St Kansas City, MO | 3.0 | 1.0 | 1176 | $1,385 | $1.18 | 2d | 1 | 1.46mi |
| 11208 Marsh Ave Kansas City, MO | 3.0 | 1.0 | 912 | $1,395 | $1.53 | 3d | 1 | 1.49mi |
Listing history 4 events
-
2026-05-09status Pending 738-char remark
-
2026-04-23$170,000 Active 738-char remark
-
2005-12-19soldstatus
-
1982-12-01soldstatus
ⓘ Source: listings_history table (triggers on properties + properties_extension) + one-shot
backfill from property_details.listing_events for pre-trigger history.
Tax reassessment forecast MO · Resets to sale price
- Current annual tax
- $1,852 · $154/mo
- Projected year-2 tax
- $1,852 · $154/mo
- Expected delta
- $0/yr ($0/mo · 0.0%)
ⓘ Screening estimate from a state-policy table — verify with the county assessor before closing.
Climate risk First Street
- Flood 7/10 Severe FEMA zone X (unshaded) · 99% chance over 30 yrs
- Wildfire 2/10 Low
- Heat 4/10 Moderate 7 d/yr ≥106°F today · 17 d/yr by 30 yrs out
- Wind 2/10 Low
- Air quality 3/10 Moderate 3 unhealthy d/yr today · 3 by 30 yrs out
Nearby sold comps map
Loading sold comps map…
Walkable amenities ~0.75 mi
Loading nearby amenities…
Taxation est. · year 1
- Rental income
- $18,940
- − Mortgage interest
- −$9,523
- − Property taxes
- −$1,852
- − Insurance
- −$1,516
- − Repairs & maintenance
- −$1,515
- − Management
- −$1,515
- − Depreciation
- −$4,945
- Taxable loss
- −$1,927
- Est. tax savings @ 24.0%
- +$462
- After-tax cash flow
- $1,359/yr
For passive investors: Depreciation is non-cash, so a rental often shows a tax loss while cash-flowing — sheltering income. Rental losses are passive: they offset passive income freely, and up to $25,000/yr can offset ordinary (W-2) income if you actively participate and your MAGI is under $100k (phasing out to $0 by $150k); unused losses carry forward. On sale, claimed depreciation is recaptured at up to 25%, and gains may owe capital-gains tax (a 1031 exchange can defer both). Figures are a year-1 estimate at your 24.0% rate — not tax advice; consult a CPA.
Schools (NCES district)
- District
- Hickman Mills C-1
- NCES district ID
- 2914340
- Math proficiency
- 8% ▼ -8.00%
- Reading proficiency
- 18% ▼ -4.00%
- Median HH income
- $40,908
- Composite
- 11.2/100
- National rank
- #9725
- State rank
- #314 of 324 in MO
Livability — Grandview
- Score
- 61/100
- State rank
- #454
- US rank
- #18350
Category grades
Schools grade is shown separately in the Schools card above.
Census & demographics
- Census place
- Grandview, MO
- County
- Jackson County · 687,798 people
- City population
- 26,422
- Metro
- Kansas City, MO-KS
- Population (ZIP)
- 26,422
- Household income
- $53,216
- Rent vs Own
- Severe rent burden
- 1449.0
Population outlook (Jackson County) Hauer SSP2
- Today (2025)
- 719,589 people
- By 2030
- 731,456 · +1.6%
- By 2040
- 746,689 · +3.8%
- By 2050
- 749,289 · +4.1%
- By 2075
- 736,227 · +2.3%
- By 2100
- 668,210 · -7.1%
Race, ethnicity, and origin ACS 2023
- Neighborhood character
- Diverse neighborhood (Simpson 0.68)
- Race & ethnicity
- White 44% Black 33% Hispanic / Latino 14% Two or more races 7% Asian 3%
- Hispanic origin (detail)
- Mexican 8%
- Common ancestry
- Lithuanian 1% Romanian 1% Slovak 1%
- Foreign-born
- 9% · Canada, South Korea
- Languages at home
- 86% English-only · Spanish 11% Korean 1% Arabic 1%
Political lean MEDSL · Jackson
- 2024 margin
- D (+19.3) · D 58.9% · R 39.5% · Other 1.6%
- 2008→2024 swing
- -6.1pp toward R · 2008: 25.4pp · 2024: 19.3pp
- All cycles
- 2024: D+19.3 2020: D+22.0 2016: D+16.6 2012: D+19.0 2008: D+25.4
Not yet ingested
- Civics
- —
Market trends
- HPI YoY
- ▼ -142.24%
- Current HPI
- 321.6905
- Rent YoY
- ▲ 6.10%
- Metro
- Kansas City, MO-KS
- State GDP YoY
- ▲ 1.84%
- F500 in state
- 20
Industry mix (Fortune 500 HQ in MO)
| Industry | F500 HQs | Revenue |
|---|---|---|
| Healthcare | 1 | $163B |
|
||
| Insurance | 1 | $21B |
|
||
| Industrial Technology | 1 | $17B |
|
||
| Retail | 1 | $16B |
|
||
| Industrial Distribution | 1 | $10B |
|
||
| Utilities | 1 | $9B |
|
||
Price history
5 events — show timeline
- 2026-06-16 Sold (MLS) — Heartland MLS as Distributed by MLS Grid
- 2026-05-09 Pending — Heartland MLS as Distributed by MLS Grid
- 2026-04-23 Listed $170,000 Heartland MLS as Distributed by MLS Grid
- 2005-12-19 Sold (Public Records) — Public Records
- 1982-12-01 Sold (Public Records) — Public Records
Property tax history
+4.7%/yrLatest (2025): $1,852 · -28.7% YoY. Source: county tax records.
Cash-flow waterfall
monthlySold comps — $/sqft
last 12 mo · ≤1 miLoading sold comps…