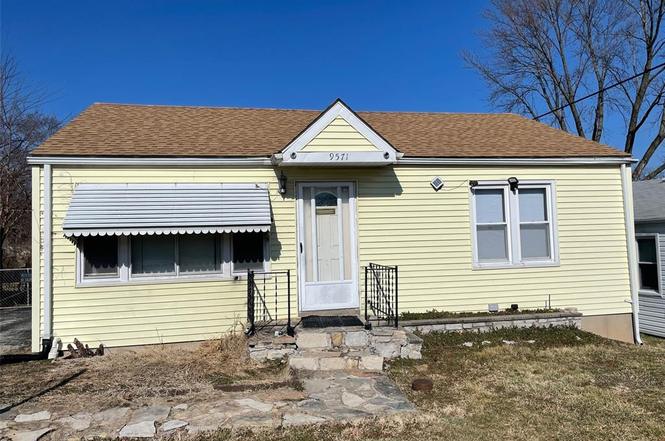
9571 Pagewood Ave · Overland, MO
Flood risk 6/10 · Moderate
- FEMA flood zone
- X (shaded)
- Chance of flooding over 30 yrs
- 0.68%
- Est. flood insurance / yr
- $473 – $860
Fire risk 1/10 · Minimal
- Est. fire insurance / yr
- $1,054 – $1,958
Heat risk 5/10 · Moderate
- Hot days now (above 107°F)
- 7 days/yr
- Hot days in 30 yrs
- 21 days/yr
Wind risk 2/10 · Minimal
- Chance of severe wind over 30 yrs
- 1.0%
Air-quality risk 2/10 · Minimal
- Unhealthy air days now
- 1 days/yr
- Unhealthy air days in 30 yrs
- 3 days/yr
Risk factors via First Street. Map © Google.
Why this score? — see what drove the B grade
The composite is a weighted blend of 9 inputs, each scored 0–100. Each bar is that input's sub-score; the figure is the points it added to the 100-point composite (weight × sub-score).
- Cash flow +27.8/30.0
- ARV discount +15.0/15.0
- DSCR +9.8/10.0
- 1% rule +7.3/10.0
- Livability +3.1/5.0
- Rent growth +3.0/5.0
- Condition / age +2.5/5.0
- Schools +1.7/10.0
- Appreciation +0.0/10.0
$115,000
🖨 Deal sheet 📄 Offer letter ✓ Due diligence
Listing remarks MLS
Why rent when you can own? This 3 bed, Ranch, is ready to take on it's next owner. The bathroom was just updated in 2021 and is just the tip of the iceberg on updates you can do to make it your own. The yard is flat and perfect for those last minute summer BBQ's before Fall!
Key facts
- 7,501 sq ft lot
- Built 1954
- Listed 3 days
Property features AI
Exterior
- Utilities: Public water; Public sewer; Electricity connected (Ameren); Natural gas connected
- Home design: Single-family residence; One story; Private ownership
- Construction: Frame construction with vinyl siding
- Exterior features: Patio; Back yard; Full chain-link fence
Interior
- Kitchen: Kitchen on the main level
- Bedrooms: 3 bedrooms on the main level
- Flooring: Carpet; Ceramic tile; Hardwood
- Bathrooms: 1 full bathroom on the main level
- Heating & cooling: Forced air heating; Central air conditioning
- Interior features: Full, unfinished basement; Living room
Neighborhood map
What this means for you Summary
Snapshot
- This is a 3-bed/1.0-bath single-family listed at $115k.
Deal economics
- At list price, monthly cash flow is $352 ($4k/yr) — positive.
- The deal already cash-flows at list — no discount required.
- Meets the 1% rule at list price ($1k rent vs $115k).
- Cap rate 10.0% vs local median 6.2% in Overland — top-decile yield for the area; either an underpriced asset or a hidden risk that comps aren't pricing in. Stress-test before assuming the spread holds.
Location & tenants
- Location reads 61/100 on livability (#436 in MO) — a middle-class / working-renter tenant base. Strengths: cost of living A+, housing A+; Watch: health & safety C-, crime F, amenities F.
- Ritenour (suburban): math 13% / reading 27% proficiency, ranked #304 of 324 in MO (top 94%) — low school quality limits family demand, transient renter base, plan for 1-2y turnover; 66% free/reduced lunch — lower-income household profile, screen leases tightly.
- Zoned schools: Wyland Elem. (math 13% / reading 25%, grade F, #958 of 1,115 statewide, top 86%, 490 students, 99% FRL); Ritenour Sr. High (math 9% / reading 36%, grade F, #455 of 521 statewide, top 88%, 1,873 students, 100% FRL) — zoned schools average 100% FRL vs 66% district-wide (34 pts higher); higher-poverty schools than district average — tighter screening recommended.
- Market conditions: Rents rising (+2.0%/yr); 118 active listings in the ZIP; 15 comparable units currently listed for rent nearby; rentals at typical pace (median 24d on market — plan ~3-4 weeks tenant-placement turnaround); 40% of comp listings sitting > 30 days — soft ceiling on asking rent; 920 units permitted in St. Louis County in 2024 (250 in 5+ unit buildings).
- This rent runs 30% of the median local income ($56k/yr) — at the standard rent-burdened threshold; future hikes will face affordability resistance.
Forward outlook
- Local home prices are declining (-3.0%/yr); year-one equity from $795 of loan paydown is wiped out by about $3k of value loss. Plan a longer hold.
- At projected returns (-3.0% appreciation + 2.0% rent growth), your $32k cash investment doubles in ~10 years — after that, you're playing with house money.
Negotiation context
- Only 3 days on market — expect competitive offers; lowballing is unlikely to land.
- 3 sale attempts since 5y ago with the ask held roughly flat each time — persistent listings suggest the price (not the market) is what's stuck; bring a comps-based counter.
- Current owner paid $97k; 19% above their basis — modest negotiation headroom, anchor on the comps not their cost.
Risks & watch-outs
- Watch-outs: built in 1954 — expect roof / HVAC / electrical / plumbing capex.
- Climate carrying-cost: major flood risk; extreme-heat days projected 7→21/yr by 2055 (HVAC capex compounding) — expect insurance premiums to compound above CPI over the hold.
Questions for the listing agent
- Built in 1954 — when were the roof, HVAC, electrical panel, plumbing, and water heater last replaced?
- Is there a deadline driving the sale (1031 exchange, divorce, estate, relocation)? That informs how much negotiation room exists.
- Schools are F-rated, which usually means shorter tenancies and higher turnover. Who's the typical renter profile here, and what's been the actual vacancy rate?
- Crime grade is F in this area — have there been break-ins, vandalism, or insurance claims at this property in the last 3 years? What carrier currently insures it and at what premium?
- What's the average days-on-market for RENTAL listings here right now (not sales)? A rising rental-DOM trend means longer vacancies and softer asking-rent achievability than the comps imply.
- What's the recent tenant-quality profile in this submarket — average credit score on applications, eviction rate, late-payment / NSF rate, and stable-employment percentage? A property-management company in the area should have these aggregated.
- How much new for-sale + rental construction is in the pipeline within 1–3 miles? Heavy new supply typically softens prices + rents 12–24 months out; constrained supply supports both.
Investment metrics
- 1% rule
- 1.23% ✓
- Cap rate
- 9.97%
- Cash-on-cash
- 13.12%
- DSCR
- 1.58
- GRM
- 6.8
CMA / ARV
- ARV (on-the-fly)
- $180,180
- Comps found
- 12
Show comp detail 12 sales within ~0.75 mi
| Address | Dist | Beds/Ba | Sqft | Sold | Price | $/sf | Match |
|---|---|---|---|---|---|---|---|
| 9608 Miriam Ave | 0.24mi | 3/1.0 | 888 (-4%) | 2mo | $189,900 | $214 | 80 |
| 9546 Theodosia Ave | 0.30mi | 3/1.0 | 884 (-4%) | 1mo | $185,000 | $209 | 78 |
| 2000 Wismer Ave | 0.40mi | 2/1.0 (-1) | 976 (+6%) | 1mo | $135,000 | $138 | 66 |
| 9518 Cote Brilliante Ave | 0.34mi | 2/1.0 (-1) | 864 (-6%) | 4mo | $142,500 | $165 | 65 |
| 2206 Wengler Ave | 0.46mi | 2/1.0 (-1) | 864 (-6%) | 2mo | $125,000 | $145 | 61 |
| 9509 Trescott Ave | 0.62mi | 2/2.0 (-1) | 912 (-1%) | 1mo | $140,000 | $154 | 59 |
| 9233 Meadowbrook Ln | 0.56mi | 2/1.0 (-1) | 864 (-6%) | 0mo | $159,900 | $185 | 58 |
| 9921 Iveland Dr | 0.67mi | 2/1.0 (-1) | 936 (+1%) | 5mo | $159,000 | $170 | 57 |
| 1914 Overland Dr | 0.45mi | 2/1.0 (-1) | 816 (-12%) | 3mo | $165,000 | $202 | 53 |
| 9750 Flora Ave | 0.52mi | 2/2.0 (-1) | 816 (-12%) | 3mo | $199,900 | $245 | 44 |
| 9816 Lullaby Ln | 0.58mi | 2/1.0 (-1) | 816 (-12%) | 6mo | $159,900 | $196 | 43 |
| 1940 Stedman Ct | 0.74mi | 2/1.0 (-1) | 816 (-12%) | 3mo | $159,000 | $195 | 39 |
Match score weights: distance 35% · size 25% · config 20% · recency 20%. Top-matched comps best support the ARV.
Projected returns pro-forma
-3.0% appreciation · 2.04% rent growth · sell at horizon
- IRR
- 2.0%
- Equity multiple
- 1.08×
- Total profit
- $2,441
- Equity at exit
- $17,147
- IRR
- 10.6%
- Equity multiple
- 1.79×
- Total profit
- $25,565
- Equity at exit
- $9,943
Cash invested: $32,200 (down + closing). Projections, not guarantees.
Landlord ↔ Tenant lean methodology
- Overall (STATE)
- 81 Strongly Landlord-Friendly
- State Missouri
- 81 Strongly Landlord-Friendly · R+10
- County
- — inherits STATE
- City
- — inherits STATE
ZIP-level market 63114
- Rents YoY
- 2.0%
- Active inventory
- 118
- Price-to-rent
- 6.8×
Monthly cashflow live
- Estimated rent
- $1,418 high interval (Pro) →
- Mortgage (P&I)
- −$603
- Tax from tax record
- −$117 /mo · $1,407/yr
- Insurance
- −$48
- HOA
- −$0
- Vacancy / Maint / Mgmt
- −$298
- Net cashflow
- $352
Break-even live
UW: 25.0% down · 7.5% · 30yr · 1.5% tax · 5.0% vac · 8.0% maint · 8.0% mgmt
Financing live
Cash to close
- Down payment
- $28,750
- Closing costs
- $3,450
- Reserves months
- —
- Total cash needed
- —
Loan-product check · same deal, 3 products live
Conventional
25% down · 7.5% · 30yr
- Down + closing
- —
- Monthly P&I
- —
- Monthly cashflow
- —
- DSCR
- —
- Eligible?
- —
Personal DTI + credit; lowest rate.
DSCR
20% down · 8.5% · 30yr
- Down + closing
- —
- Monthly P&I
- —
- Monthly cashflow
- —
- DSCR
- —
- Eligible?
- —
No personal income docs; deal must DSCR.
Hard money
10% down · 12.0% · 12mo
- Down + closing
- —
- Monthly P&I
- —
- Monthly cashflow
- —
- DSCR
- —
- Eligible?
- —
Short-term bridge; refi at stabilization.
Rent comps 15 comps
| Address | Beds | Baths | Sqft | Rent | $/sqft | DOM | Units | Dist |
|---|---|---|---|---|---|---|---|---|
| 2201 Gaebler Ave Unit A Overland, MO | 2.0 | 1.0 | 710 | $1,250 | $1.76 | 23d | 1 | 0.46mi |
| 9905 Iveland Dr Saint Louis, MO | 2.0 | 1.0 | 816 | $1,370 | $1.68 | 3d | 1 | 0.60mi |
| 1150 N Price Rd St. Louis, MO | 1.0–3.0 | 1.0–2.0 | 999 | $3,731 | $3.73 | 2d | 151 | 0.91mi |
| 9150 Olive Xing St. Louis, MO | 1.0–2.0 | 1.0–2.0 | 1084 | $3,575 | $3.30 | 2d | 3 | 1.12mi |
| 9472 Olive Blvd Olivette, MO | 1.0–2.0 | 1.0–2.0 | 701 | $1,210 | $1.73 | 3d | 3 | 1.17mi |
| 8246 Montreal Dr Saint Louis, MO | 2.0 | 1.0 | 850 | $1,450 | $1.71 | 44d | 1 | 1.19mi |
| 8303 Braddock Dr Saint Louis, MO | 2.0 | 1.0 | 720 | $1,075 | $1.49 | 23d | 1 | 1.33mi |
| 2732 Annapolis Ave Saint Louis, MO | 2.0 | 1.0 | 768 | $1,250 | $1.63 | 44d | 1 | 1.40mi |
| 9814 Greenery Ln Saint Louis, MO | 2.0 | 1.0 | 900 | $1,475 | $1.64 | 44d | 1 | 1.43mi |
| 9882 Greenery Ln Saint Louis, MO | 2.0 | 1.0 | 900 | $1,400 | $1.56 | 44d | 1 | 1.43mi |
| 9826 Greenery Ln Saint Louis, MO | 2.0 | 1.0 | 900 | $1,275 | $1.42 | 44d | 1 | 1.43mi |
| 9814 Greenery Ln Unit D Saint Louis, MO | 2.0 | 1.0 | 875 | $1,250 | $1.43 | 23d | 1 | 1.43mi |
| 2452 Ashland Ave Saint Louis, MO | 2.0 | 1.0 | 1028 | $1,350 | $1.31 | 44d | 1 | 1.45mi |
| 8669 Old Towne Dr St. Louis, MO | 1.0–3.0 | 1.0–2.0 | 1335 | $2,151 | $1.61 | 2d | 9 | 1.47mi |
| 9535 Baltimore Ave Saint Louis, MO | 2.0 | 1.0 | 800 | $1,145 | $1.43 | 23d | 1 | 1.49mi |
Listing history 4 events
-
2026-06-18days on market $115,000 Active 3 DOM
-
2026-06-17days on market $115,000 Active 2 DOM
-
2026-06-15remarks 362-char remark
-
2026-06-15$115,000 Active 1 DOM
ⓘ Source: listings_history table (triggers on properties + properties_extension) + one-shot
backfill from property_details.listing_events for pre-trigger history.
Tax reassessment forecast MO · Resets to sale price
- Current annual tax
- $1,407 · $117/mo
- Projected year-2 tax
- $1,407 · $117/mo
- Expected delta
- $0/yr ($0/mo · 0.0%)
ⓘ Screening estimate from a state-policy table — verify with the county assessor before closing.
Climate risk First Street
- Flood 6/10 Major FEMA zone X (shaded) · 68% chance over 30 yrs
- Wildfire 1/10 Low
- Heat 5/10 Major 7 d/yr ≥107°F today · 21 d/yr by 30 yrs out
- Wind 2/10 Low 100% chance of damaging wind over 30 yrs
- Air quality 2/10 Low 1 unhealthy d/yr today · 3 by 30 yrs out
Nearby sold comps map
Loading sold comps map…
Walkable amenities ~0.75 mi
Loading nearby amenities…
Taxation est. · year 1
- Rental income
- $17,019
- − Mortgage interest
- −$6,442
- − Property taxes
- −$1,407
- − Insurance
- −$575
- − Repairs & maintenance
- −$1,362
- − Management
- −$1,362
- − Depreciation
- −$3,345
- Taxable income
- $2,526
- Est. tax owed @ 24.0%
- −$606
- After-tax cash flow
- $3,619/yr
For passive investors: Depreciation is non-cash, so a rental often shows a tax loss while cash-flowing — sheltering income. Rental losses are passive: they offset passive income freely, and up to $25,000/yr can offset ordinary (W-2) income if you actively participate and your MAGI is under $100k (phasing out to $0 by $150k); unused losses carry forward. On sale, claimed depreciation is recaptured at up to 25%, and gains may owe capital-gains tax (a 1031 exchange can defer both). Figures are a year-1 estimate at your 24.0% rate — not tax advice; consult a CPA.
Schools (NCES district)
- District
- Ritenour
- NCES district ID
- 2926640
- Math proficiency
- 13% ▼ -14.00%
- Reading proficiency
- 27% ▼ -7.00%
- Median HH income
- $41,410
- Composite
- 17.04/100
- National rank
- #9125
- State rank
- #304 of 324 in MO
Livability — Overland
- Score
- 61/100
- State rank
- #436
- US rank
- #17870
Category grades
Schools grade is shown separately in the Schools card above.
Census & demographics
- Census place
- Overland, MO
- County
- Saint Louis County · 888,823 people
- City population
- 33,969
- Metro
- St. Louis, MO-IL
- Population (ZIP)
- 33,969
- Household income
- $55,870
- Rent vs Own
- Severe rent burden
- 1595.0
Population outlook (St. Louis County) Hauer SSP2
- Today (2025)
- 1,025,227 people
- By 2030
- 1,028,023 · +0.3%
- By 2040
- 1,020,940 · -0.4%
- By 2050
- 1,007,280 · -1.8%
- By 2075
- 987,277 · -3.7%
- By 2100
- 921,984 · -10.1%
Race, ethnicity, and origin ACS 2023
- Neighborhood character
- Diverse neighborhood (Simpson 0.64)
- Race & ethnicity
- White 50% Black 30% Hispanic / Latino 11% Two or more races 6% Asian 2%
- Hispanic origin (detail)
- Mexican 7%
- Common ancestry
- Lithuanian 3% Italian 2% Romanian 1%
- Foreign-born
- 9% · Canada, Vietnam
- Languages at home
- 84% English-only · Spanish 10% French/Haitian/Cajun 2% Tagalog/Filipino 1%
Political lean MEDSL · St. Louis
- 2024 margin
- Strong D (+23.4) · D 60.8% · R 37.4% · Other 1.7%
- 2008→2024 swing
- +3.5pp toward D · 2008: 19.9pp · 2024: 23.4pp
- All cycles
- 2024: D+23.4 2020: D+24.0 2016: D+16.2 2012: D+13.7 2008: D+19.9
Not yet ingested
- Civics
- —
Market trends
- HPI YoY
- ▼ -276.62%
- Current HPI
- 223.9305
- Rent YoY
- ▲ 2.04%
- Metro
- St. Louis, MO-IL
- State GDP YoY
- ▲ 1.84%
- F500 in state
- 20
Industry mix (Fortune 500 HQ in MO)
| Industry | F500 HQs | Revenue |
|---|---|---|
| Healthcare | 1 | $163B |
|
||
| Insurance | 1 | $21B |
|
||
| Industrial Technology | 1 | $17B |
|
||
| Retail | 1 | $16B |
|
||
| Industrial Distribution | 1 | $10B |
|
||
| Utilities | 1 | $9B |
|
||
Price history
+4.5% since first listed13 events — show timeline
- 2026-06-15 Listed $115,000 MARIS as Distributed by MLS Grid
- 2021-11-09 Sold (Public Records) $97,000 Public Records
- 2021-10-27 Sold (MLS) — MARIS as Distributed by MLS Grid
- 2021-09-21 Pending — MARIS as Distributed by MLS Grid
- 2021-09-16 Price Changed $100,000 MARIS as Distributed by MLS Grid
- 2021-08-26 Listed $106,000 MARIS as Distributed by MLS Grid
- 2021-05-21 Sold (Public Records) $95,000 Public Records
- 2021-05-17 Sold (MLS) — MARIS as Distributed by MLS Grid
- 2021-04-16 Pending — MARIS as Distributed by MLS Grid
- 2021-04-06 Price Changed $95,000 MARIS as Distributed by MLS Grid
- 2021-03-29 Price Changed $100,000 MARIS as Distributed by MLS Grid
- 2021-03-25 Listed $110,000 MARIS as Distributed by MLS Grid
- 2004-05-11 Sold (Public Records) — Public Records
Property tax history
+0.7%/yrLatest (2022): $1,407 · +0.0% YoY. Source: county tax records.
Cash-flow waterfall
monthlySold comps — $/sqft
last 12 mo · ≤1 miLoading sold comps…