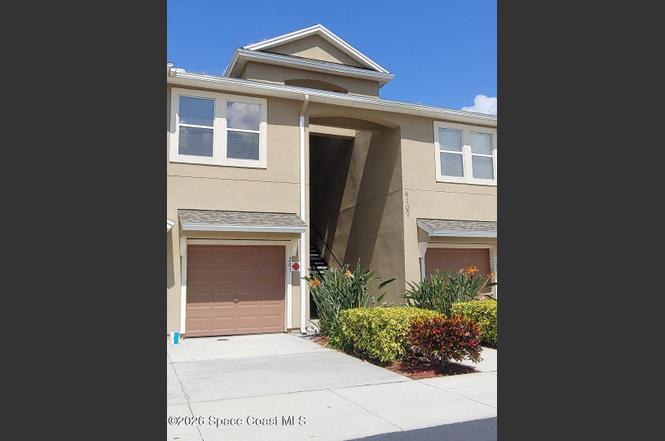
4107 Meander Pl #203 · Rockledge, FL
Flood risk No data
- FEMA flood zone
- —
- Chance of flooding over 30 yrs
- —
- Est. flood insurance / yr
- —
Fire risk No data
- Est. fire insurance / yr
- —
Heat risk No data
- Hot days now (above threshold)
- —
- Hot days in 30 yrs
- —
Wind risk No data
- Chance of severe wind over 30 yrs
- —
Air-quality risk No data
- Unhealthy air days now
- —
- Unhealthy air days in 30 yrs
- —
Risk factors via First Street. Map © Google.
Why this score? — see what drove the D- grade
The composite is a weighted blend of 9 inputs, each scored 0–100. Each bar is that input's sub-score; the figure is the points it added to the 100-point composite (weight × sub-score).
- Cash flow +10.0/30.0
- ARV discount +7.5/15.0
- 1% rule +4.8/10.0
- Schools +4.7/10.0
- Livability +4.0/5.0
- DSCR +2.9/10.0
- Rent growth +2.5/5.0
- Condition / age +2.5/5.0
- Appreciation +0.0/10.0
$205,000
🖨 Deal sheet (PDF) 📄 Offer letter ✓ Due diligence
Listing remarks MLS
Check out this beautifully maintained condo centrally located in the gated community of Jameson Place off of Murrell Rd in the Viera/Rockledge area. This 2 bedroom/2 bath condo has a split floor plan with one car garage entry and laundry room with full sized washer/dryer located on the first floor and stairs to second floor to the great room, kitchen, beds and baths . The spacious and contemporary kitchen has plenty of cabinet and work space as well as a breakfast bar. Very nicely appointed engineered hardwood floors throughout. This condo is move in ready! Amenities include heated swimming pool and playground. Conveniently located to schools, shopping, restaurants and I-95. You won't want to miss this one!
Key facts
- Gated community
- Laundry room
- Split floor plan
Tags
Neighborhood map
What this means for you Summary
Snapshot
- This is a 2-bed/2.0-bath condo listed at $205k.
Deal economics
- At list price, monthly cash flow is $-123 ($-1k/yr) — negative.
- To cash-flow at today's rent, offer at most $183k (10.6% below list).
- To meet the 1% rule (rent ≥ 1% of price), the offer needs to be $200k (2.4% below list).
- Recommended offer: $183k (10.6% below list) — sets the bar for cash-flow.
Location & tenants
- Location reads 81/100 on livability (#81 in FL, #1,315 nationally) — a professional / high-income tenant draw. Strengths: housing A+, health & safety A, commute A-; Watch: amenities F.
- Brevard (suburban): math 53% / reading 57% proficiency, ranked #19 of 73 in FL (top 26%) — acceptable for families but not a draw, mixed tenant base, ~2y average lease.
- Zoned schools: Manatee Elementary School (math 85% / reading 84%, grade A+, #43 of 2,144 statewide, top 2%, 897 students, 19% FRL); John F. Kennedy Middle School (math 67% / reading 59%, grade B+, #111 of 571 statewide, top 20%, 673 students, 41% FRL); Rockledge Senior High School (math 27% / reading 49%, grade F, #328 of 667 statewide, top 50%, 1,558 students, 50% FRL).
- Market conditions: Rents flat; 317 active listings in the ZIP; 9 comparable units currently listed for rent nearby; rentals at typical pace (median 22d on market — plan ~3-4 weeks tenant-placement turnaround); solid renter incomes; 4,602 units permitted in Brevard County in 2024 (702 in 5+ unit buildings).
Forward outlook
- Local home prices are declining (-3.0%/yr); year-one equity from $1k of loan paydown is wiped out by about $6k of value loss. Plan a longer hold.
- Brevard County population projected at +15% by 2050 — modest demand growth; plan on rents tracking national, not racing it.
Negotiation context
- Only 8 days on market — expect competitive offers; lowballing is unlikely to land.
- 2 sale attempts since 10y ago with the ask held roughly flat each time — persistent listings suggest the price (not the market) is what's stuck; bring a comps-based counter.
- Current owner paid $128k; list at $205k implies a 60% gain — meaningful room to come down on a strong offer.
Questions for the listing agent
- What do current leases actually rent for vs. the listed asking? Can we see a recent rent roll and the last 12 months of T-12 income?
- What does the HOA fee cover, when was the last increase, and are there any pending special assessments or reserve-fund shortfalls?
- Any open or pending special assessments — roof, HVAC, plumbing, elevator, façade? What's the per-unit balance and payoff schedule, and is the seller paying it off at close or rolling it to the buyer?
- Is there a deadline driving the sale (1031 exchange, divorce, estate, relocation)? That informs how much negotiation room exists.
- Schools are B-rated — typically a magnet for longer-tenancy family renters. What's the average tenant stay here, and is there a school-zone premium baked into asking?
- The area grade is low — what's the realistic commute time and amenity access for the typical tenant pool here? Any planned neighborhood developments (good or bad) we should know about?
- What's the average days-on-market for RENTAL listings here right now (not sales)? A rising rental-DOM trend means longer vacancies and softer asking-rent achievability than the comps imply.
- What's the recent tenant-quality profile in this submarket — average credit score on applications, eviction rate, late-payment / NSF rate, and stable-employment percentage? A property-management company in the area should have these aggregated.
- How much new apartment / multifamily construction is in the pipeline within 1–3 miles? Heavy new supply (>2% of stock underway) typically softens rents 12–24 months out; light construction supports rent growth.
Investment metrics
- 1% rule
- 0.98% ✗
- Cap rate
- 5.57%
- Cash-on-cash
- -2.57%
- DSCR
- 0.89
- GRM
- 8.5
CMA / ARV
No comps found within radius.
Projected returns pro-forma
-3.0% appreciation · 0.12% rent growth · sell at horizon
- IRR
- -24.5%
- Equity multiple
- 0.19×
- Total profit
- $-46,473
- Equity at exit
- $30,566
- IRR
- -35.1%
- Equity multiple
- -0.25×
- Total profit
- $-71,538
- Equity at exit
- $17,725
Cash invested: $57,400 (down + closing). Projections, not guarantees.
Landlord ↔ Tenant lean methodology
- Overall (STATE)
- 87 Strongly Landlord-Friendly
- State Florida
- 87 Strongly Landlord-Friendly · R+3
- County
- — inherits STATE
- City
- — inherits STATE
ZIP-level market 32955
- Home prices YoY
- -20.7%
- Rents YoY
- 0.1%
- Active inventory
- 317
- Price-to-rent
- 8.5×
Monthly cashflow live
- Estimated rent
- $2,001 high interval (Pro) →
- Mortgage (P&I)
- −$1,075
- Tax from tax record
- −$217 /mo · $2,607/yr
- Insurance
- −$85
- HOA
- −$326
- Vacancy / Maint / Mgmt
- −$420
- Net cashflow
- $-123
Break-even live
Sensitivity live
| Price | -10% $-7 | -5% $-65 | +0% $-123 | +5% $-181 | +10% $-239 |
|---|---|---|---|---|---|
| Rent | -10% $-281 | -5% $-202 | +0% $-123 | +5% $-44 | +10% $35 |
| Rate | -1.0pp $-20 | -0.5pp $-71 | base $-123 | +0.5pp $-176 | +1.0pp $-230 |
UW: 25.0% down · 7.5% · 30yr · 1.5% tax · 5.0% vac · 8.0% maint · 8.0% mgmt
Financing live
Cash to close
- Down payment
- $51,250
- Closing costs
- $6,150
- Reserves months
- —
- Total cash needed
- —
Loan-product check · same deal, 3 products live
Conventional
25% down · 7.5% · 30yr
- Down + closing
- —
- Monthly P&I
- —
- Monthly cashflow
- —
- DSCR
- —
- Eligible?
- —
Personal DTI + credit; lowest rate.
DSCR
20% down · 8.5% · 30yr
- Down + closing
- —
- Monthly P&I
- —
- Monthly cashflow
- —
- DSCR
- —
- Eligible?
- —
No personal income docs; deal must DSCR.
Hard money
10% down · 12.0% · 12mo
- Down + closing
- —
- Monthly P&I
- —
- Monthly cashflow
- —
- DSCR
- —
- Eligible?
- —
Short-term bridge; refi at stabilization.
Rent comps 9 comps
| Address | Beds | Baths | Sqft | Rent | $/sqft | DOM | Units | Dist |
|---|---|---|---|---|---|---|---|---|
| 4106 Meander Pl #104 Rockledge, FL | 3.0 | 2.0 | 1354 | $2,025 | $1.50 | 24d | 1 | 0.03mi |
| 4047 Meander Pl #104 Rockledge, FL | 3.0 | 2.0 | 1354 | $1,925 | $1.42 | 14d | 1 | 0.19mi |
| 1626 Peregrine Cir #408 Rockledge, FL | 3.0 | 2.0 | 1247 | $2,000 | $1.60 | 14d | 1 | 0.46mi |
| 1626 Peregrine Cir Rockledge, FL | 3.0 | 2.0 | 1329 | $1,850 | $1.39 | 21d | 2 | 0.46mi |
| 3868 Lexmark Ln #409 Rockledge, FL | 3.0 | 2.0 | 1447 | $2,200 | $1.52 | 19d | 1 | 0.51mi |
| 3848 Lexmark Ln Unit 401 Rockledge, FL | 3.0 | 2.0 | 1247 | $1,850 | $1.48 | 21d | 1 | 0.54mi |
| 3843 DeQuattro Dr Rockledge, FL | 1.0–2.0 | 1.0–2.0 | 1073 | $2,409 | $2.24 | 14d | 17 | 1.07mi |
| 1019 Fusion Ln Rockledge, FL | 1.0–3.0 | 1.0–2.0 | 1149 | $2,322 | $2.02 | 21d | 36 | 1.24mi |
| 1851 Long Iron Dr #901 Rockledge, FL | 2.0 | 2.0 | 1118 | $1,700 | $1.52 | 24d | 1 | 1.43mi |
HOA detail condo
- Monthly dues
- $326 · $3,912/yr
- Likely covers
- poolsecurity
- Assessments
- None detected in remarks — confirm with the listing agent.
Listing history 6 events
-
2026-06-18days on market $205,000 Coming Soon 8 DOM
-
2026-06-17days on market $205,000 Coming Soon 7 DOM
-
2026-06-16days on market $205,000 Coming Soon 6 DOM
-
2026-06-15days on market $205,000 Coming Soon 5 DOM
-
2026-06-14remarks 699-char remark
-
2026-06-14$205,000 Coming Soon 3 DOM
ⓘ Source: listings_history table (triggers on properties + properties_extension) + one-shot
backfill from property_details.listing_events for pre-trigger history.
Tax reassessment forecast FL · Resets to sale price
- Current annual tax
- $2,607 · $217/mo
- Projected year-2 tax
- $2,607 · $217/mo
- Expected delta
- $0/yr ($0/mo · 0.0%)
ⓘ Screening estimate from a state-policy table — verify with the county assessor before closing.
Nearby sold comps map
Loading sold comps map…
Walkable amenities ~0.75 mi
Loading nearby amenities…
Taxation est. · year 1
- Rental income
- $24,013
- − Mortgage interest
- −$11,483
- − Property taxes
- −$2,607
- − Insurance
- −$1,025
- − Repairs & maintenance
- −$1,921
- − Management
- −$1,921
- − HOA
- −$3,912
- − Depreciation
- −$5,964
- Taxable loss
- −$4,820
- Est. tax savings @ 24.0%
- +$1,157
- After-tax cash flow
- $-317/yr
For passive investors: Depreciation is non-cash, so a rental often shows a tax loss while cash-flowing — sheltering income. Rental losses are passive: they offset passive income freely, and up to $25,000/yr can offset ordinary (W-2) income if you actively participate and your MAGI is under $100k (phasing out to $0 by $150k); unused losses carry forward. On sale, claimed depreciation is recaptured at up to 25%, and gains may owe capital-gains tax (a 1031 exchange can defer both). Figures are a year-1 estimate at your 24.0% rate — not tax advice; consult a CPA.
Schools (NCES district)
- District
- Brevard
- NCES district ID
- 1200150
- Math proficiency
- 53% ▼ -9.00%
- Reading proficiency
- 57% ▼ -4.00%
- Median HH income
- $49,426
- Composite
- 46.86/100
- National rank
- #2370
- State rank
- #19 of 73 in FL
Livability — Rockledge
- Score
- 81/100
- State rank
- #81
- US rank
- #1315
Category grades
Schools grade is shown separately in the Schools card above.
Census & demographics
- Census place
- Rockledge, FL
- County
- Brevard County · 602,871 people
- City population
- 41,008
- Metro
- Palm Bay-Melbourne-Titusville, FL
- Population (ZIP)
- 41,008
- Household income
- $86,457
- Rent vs Own
- Severe rent burden
- 1273.0
Population outlook (Brevard County) Hauer SSP2
- Today (2025)
- 623,254 people
- By 2030
- 648,420 · +4.0%
- By 2040
- 690,009 · +10.7%
- By 2050
- 715,669 · +14.8%
- By 2075
- 775,744 · +24.5%
- By 2100
- 776,687 · +24.6%
Race, ethnicity, and origin ACS 2023
- Neighborhood character
- Predominantly White (69%)
- Race & ethnicity
- White 69% Black 14% Hispanic / Latino 9% Two or more races 8% Asian 2%
- Hispanic origin (detail)
- Mexican 1% Puerto Rican 3%
- Common ancestry
- Slovak 3% Romanian 2% Serbian 2%
- Foreign-born
- 7% · Canada, Jamaica, Mexico
- Languages at home
- 91% English-only · Spanish 5% Other Indo-European 2%
Political lean MEDSL · Brevard
- 2024 margin
- Strong R (+20.8) · D 39.1% · R 59.9% · Other 1.0%
- 2008→2024 swing
- -10.4pp toward R · 2008: -10.4pp · 2024: -20.8pp
- All cycles
- 2024: R+20.8 2020: R+16.4 2016: R+19.8 2012: R+12.7 2008: R+10.4
Not yet ingested
- Civics
- —
Market trends
- HPI YoY
- ▼ -81.70%
- Current HPI
- 312.7435
- Rent YoY
- ▲ 0.12%
- Metro
- Palm Bay-Melbourne-Titusville, FL
- State GDP YoY
- ▲ 3.28%
- F500 in state
- 36
Industry mix (Fortune 500 HQ in FL)
| Industry | F500 HQs | Revenue |
|---|---|---|
| Industrial Technology | 2 | $29B |
|
||
| Insurance | 2 | $17B |
|
||
| Retail | 1 | $60B |
|
||
| Technology Distribution | 1 | $58B |
|
||
| Homebuilding | 1 | $35B |
|
||
| Technology Manufacturing | 1 | $35B |
|
||
Price history
+55.4% since first listed7 events — show timeline
- 2026-06-10 Coming Soon $205,000 SCMLS
- 2021-07-05 Listing Removed — SCMLS
- 2021-06-04 Listed $200,000 SCMLS
- 2021-05-23 Coming Soon $200,000 SCMLS
- 2016-12-08 Sold (Public Records) $128,500 Public Records
- 2016-12-07 Sold (MLS) $128,500 SCMLS
- 2016-10-06 Listed $131,900 SCMLS
Property tax history
+14.0%/yrLatest (2025): $2,607 · -11.9% YoY. Source: county tax records.
Cash-flow waterfall
monthlySold comps — $/sqft
last 12 mo · ≤1 miLoading sold comps…