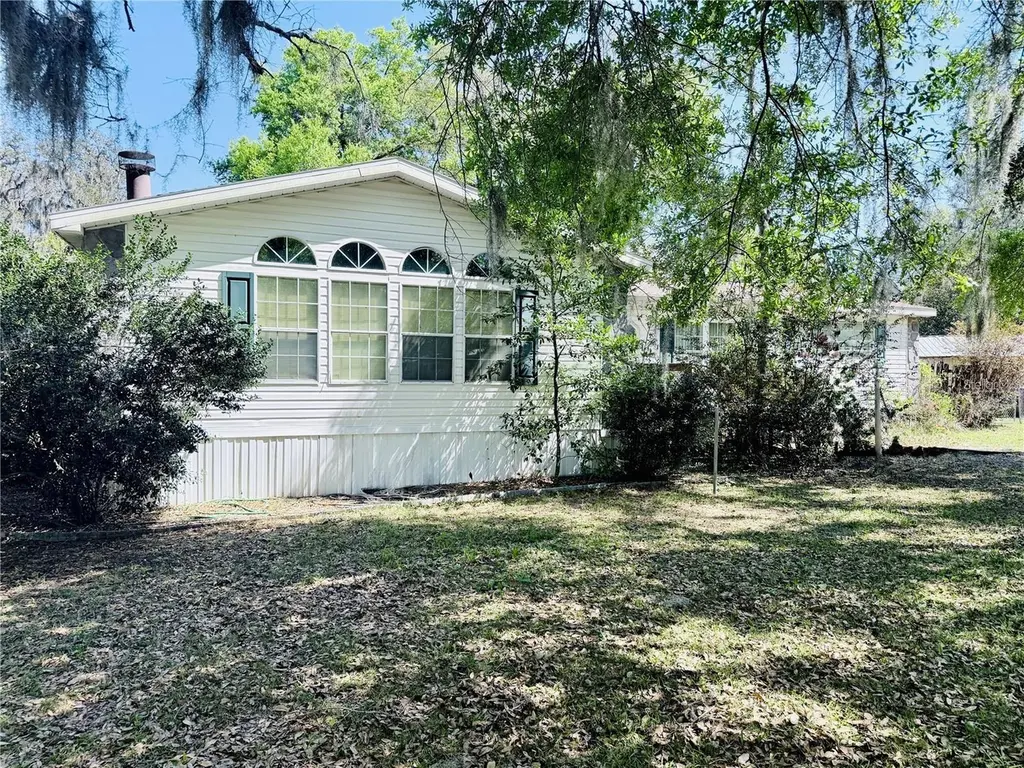
16955 SE 249th Ter · Umatilla, FL
Flood risk 1/10 · Minimal
- FEMA flood zone
- X (unshaded)
- Chance of flooding over 30 yrs
- 0.0%
- Est. flood insurance / yr
- $507 – $1,088
Fire risk 6/10 · Moderate
- Est. fire insurance / yr
- $947 – $1,759
Heat risk 8/10 · Major
- Hot days now (above 108°F)
- 7 days/yr
- Hot days in 30 yrs
- 20 days/yr
Wind risk 9/10 · Severe
- Chance of severe wind over 30 yrs
- 99.0%
Air-quality risk 2/10 · Minimal
- Unhealthy air days now
- 1 days/yr
- Unhealthy air days in 30 yrs
- 2 days/yr
Risk factors via First Street. Map © Google.
Why this score? — see what drove the C- grade
The composite is a weighted blend of 9 inputs, each scored 0–100. Each bar is that input's sub-score; the figure is the points it added to the 100-point composite (weight × sub-score).
- Cash flow +22.8/30.0
- DSCR +7.3/10.0
- ARV discount +5.1/15.0
- 1% rule +5.0/10.0
- Livability +3.7/5.0
- Schools +3.6/10.0
- Rent growth +2.5/5.0
- Condition / age +2.5/5.0
- Appreciation +0.0/10.0
$169,900
🖨 Deal sheet 📄 Offer letter ✓ Due diligence
Listing remarks MLS
This is a splendid, clean, split-plan 3/2. It has an island kitchen, separate family room with WBFP, inside utility room and two charming decks. The back yard is completely fenced. The lot itself is well landscaped. The entire property is truly clean andmove-in ready. Short sale. Schools: Stanton Wiersdale Elementary, Lake Weir Middle, Lake Weir High.
Key facts
- Large deck
- Comfortable layout
- Stone fireplace
Tags
Property features AI
Finance
- Other: Partially furnished; Listed as residential property; Property subtype: Manufactured Home; Zoned R4
- Financial info: Homestead exempt; No lease restrictions
- HOA & community: No association; Pets allowed
Exterior
- Parking: Detached parking information not provided
- Utilities: Public and well water available; Septic tank sewer; Electricity connected; High-speed internet/BB available; Water connected
- Home design: Manufactured double-wide home; Single-story (one level); Faces southeast; Crawlspace foundation
- Construction: Vinyl siding; Shingle roof
- Exterior features: Paved road access; Lot roughly 100 x 140 (approximately 0.38 acre); No waterfront
Interior
- Kitchen: Dishwasher; Disposal; Microwave; Refrigerator; Electric water heater
- Bedrooms: 3 bedrooms
- Flooring: Carpet; Laminate
- Bathrooms: 2 full bathrooms
- Heating & cooling: Central heating; Central air conditioning
- Interior features: Vaulted ceilings; Walk-in closets; Window treatments; Stone fireplace; Family room; Total of 10 rooms
- Laundry & utility: Washer hookup; Electric dryer hookup; Laundry room
Neighborhood map
What this means for you Summary
Snapshot
- This is a 3-bed/2.0-bath manufactured listed at $170k.
Deal economics
- At list price, monthly cash flow is $295 ($4k/yr) — positive.
- The deal already cash-flows at list — no discount required.
- To meet the 1% rule (rent ≥ 1% of price), the offer needs to be $169k (0.4% below list).
- Recommended offer: $169k (0.4% below list) — sets the bar for 1% rule.
- Cap rate 8.4% vs local median 2.9% in Umatilla — top-decile yield for the area; either an underpriced asset or a hidden risk that comps aren't pricing in. Stress-test before assuming the spread holds.
Location & tenants
- Location reads 73/100 on livability (#300 in FL) — a middle-class / working-renter tenant base. Strengths: crime A+, cost of living A+, health & safety A+; Watch: employment C-, amenities F, commute F.
- Marion (rural): math 42% / reading 43% proficiency, ranked #61 of 73 in FL (top 84%) — families likely to look elsewhere, expect single-tenant / working-renter base with shorter leases; 61% free/reduced lunch — lower-income household profile, screen leases tightly.
- Market conditions: 223 active listings in the ZIP; 7,071 units permitted in Marion County in 2024 (534 in 5+ unit buildings).
Forward outlook
- Local home prices are declining (-3.0%/yr); year-one equity from $1k of loan paydown is wiped out by about $5k of value loss. Plan a longer hold.
- Marion County population projected at +13% by 2050 — modest demand growth; plan on rents tracking national, not racing it.
Negotiation context
- Only 6 days on market — expect competitive offers; lowballing is unlikely to land.
- 8 sale attempts since 21y ago with the ask held roughly flat each time — persistent listings suggest the price (not the market) is what's stuck; bring a comps-based counter.
- Current owner paid $64k; list at $170k implies a 165% gain — meaningful room to come down on a strong offer.
Risks & watch-outs
- Climate carrying-cost: severe wind risk, 99% chance of damaging wind over 30y; major wildfire risk; extreme-heat days projected 7→20/yr by 2055 (HVAC capex compounding) — expect insurance premiums to compound above CPI over the hold.
Questions for the listing agent
- Is there a deadline driving the sale (1031 exchange, divorce, estate, relocation)? That informs how much negotiation room exists.
- What's the average days-on-market for RENTAL listings here right now (not sales)? A rising rental-DOM trend means longer vacancies and softer asking-rent achievability than the comps imply.
- What's the recent tenant-quality profile in this submarket — average credit score on applications, eviction rate, late-payment / NSF rate, and stable-employment percentage? A property-management company in the area should have these aggregated.
- How much new for-sale + rental construction is in the pipeline within 1–3 miles? Heavy new supply typically softens prices + rents 12–24 months out; constrained supply supports both.
Investment metrics
- 1% rule
- 1.00% ✗
- Cap rate
- 8.37%
- Cash-on-cash
- 7.43%
- DSCR
- 1.33
- GRM
- 8.4
CMA / ARV
- ARV (on-the-fly)
- $161,130
- Comps found
- 1
Show comp detail 1 sale within ~0.75 mi
| Address | Dist | Beds/Ba | Sqft | Sold | Price | $/sf | Match |
|---|---|---|---|---|---|---|---|
| 17080 SE 251st Ter | 0.22mi | 3/2.0 | 1,700 (-14%) | 8mo | $140,000 | $82 | 61 |
Match score weights: distance 35% · size 25% · config 20% · recency 20%. Top-matched comps best support the ARV.
Projected returns pro-forma
-3.0% appreciation · 3.0% rent growth · sell at horizon
- IRR
- -5.0%
- Equity multiple
- 0.81×
- Total profit
- $-8,826
- Equity at exit
- $25,333
- IRR
- 4.7%
- Equity multiple
- 1.34×
- Total profit
- $16,247
- Equity at exit
- $14,690
Cash invested: $47,572 (down + closing). Projections, not guarantees.
Landlord ↔ Tenant lean methodology
- Overall (STATE)
- 87 Strongly Landlord-Friendly
- State Florida
- 87 Strongly Landlord-Friendly · R+3
- County
- — inherits STATE
- City
- — inherits STATE
ZIP-level market 32784
- Home prices YoY
- -8.5%
- Active inventory
- 223
- Price-to-rent
- 8.4×
Monthly cashflow live
- Estimated rent
- $1,692 medium interval (Pro) →
- Mortgage (P&I)
- −$891
- Tax from tax record
- −$80 /mo · $965/yr
- Insurance
- −$71
- HOA
- −$0
- Vacancy / Maint / Mgmt
- −$355
- Net cashflow
- $295
Break-even live
UW: 25.0% down · 7.5% · 30yr · 1.5% tax · 5.0% vac · 8.0% maint · 8.0% mgmt
Financing live
Cash to close
- Down payment
- $42,475
- Closing costs
- $5,097
- Reserves months
- —
- Total cash needed
- —
Loan-product check · same deal, 3 products live
Conventional
25% down · 7.5% · 30yr
- Down + closing
- —
- Monthly P&I
- —
- Monthly cashflow
- —
- DSCR
- —
- Eligible?
- —
Personal DTI + credit; lowest rate.
DSCR
20% down · 8.5% · 30yr
- Down + closing
- —
- Monthly P&I
- —
- Monthly cashflow
- —
- DSCR
- —
- Eligible?
- —
No personal income docs; deal must DSCR.
Hard money
10% down · 12.0% · 12mo
- Down + closing
- —
- Monthly P&I
- —
- Monthly cashflow
- —
- DSCR
- —
- Eligible?
- —
Short-term bridge; refi at stabilization.
Listing history 6 events
-
2026-06-18days on market $169,900 Active 6 DOM
-
2026-06-17days on market $169,900 Active 5 DOM
-
2026-06-16days on market $169,900 Active 4 DOM
-
2026-06-15days on market $169,900 Active 3 DOM
-
2026-06-13remarks 693-char remark
-
2026-06-13$169,900 Active 1 DOM
ⓘ Source: listings_history table (triggers on properties + properties_extension) + one-shot
backfill from property_details.listing_events for pre-trigger history.
Tax reassessment forecast FL · Resets to sale price
- Current annual tax
- $965 · $80/mo
- Projected year-2 tax
- $1,410 · $118/mo
- Expected delta
- +$445/yr (+$37/mo · 46.1%)
ⓘ Screening estimate from a state-policy table — verify with the county assessor before closing.
Climate risk First Street
- Flood 1/10 Low FEMA zone X (unshaded) · 0% chance over 30 yrs
- Wildfire 6/10 Major
- Heat 8/10 Severe 7 d/yr ≥108°F today · 20 d/yr by 30 yrs out
- Wind 9/10 Extreme 99% chance of damaging wind over 30 yrs
- Air quality 2/10 Low 1 unhealthy d/yr today · 2 by 30 yrs out
Nearby sold comps map
Loading sold comps map…
Walkable amenities ~0.75 mi
Loading nearby amenities…
Taxation est. · year 1
- Rental income
- $20,305
- − Mortgage interest
- −$9,517
- − Property taxes
- −$965
- − Insurance
- −$850
- − Repairs & maintenance
- −$1,624
- − Management
- −$1,624
- − Depreciation
- −$4,943
- Taxable income
- $782
- Est. tax owed @ 24.0%
- −$188
- After-tax cash flow
- $3,347/yr
For passive investors: Depreciation is non-cash, so a rental often shows a tax loss while cash-flowing — sheltering income. Rental losses are passive: they offset passive income freely, and up to $25,000/yr can offset ordinary (W-2) income if you actively participate and your MAGI is under $100k (phasing out to $0 by $150k); unused losses carry forward. On sale, claimed depreciation is recaptured at up to 25%, and gains may owe capital-gains tax (a 1031 exchange can defer both). Figures are a year-1 estimate at your 24.0% rate — not tax advice; consult a CPA.
Schools (NCES district)
- District
- Marion
- NCES district ID
- 1201260
- Math proficiency
- 42% ▼ -7.00%
- Reading proficiency
- 43% ▼ -4.00%
- Median HH income
- $40,015
- Composite
- 35.61/100
- National rank
- #4890
- State rank
- #61 of 73 in FL
Livability — Umatilla
- Score
- 73/100
- State rank
- #300
- US rank
- #5132
Category grades
Schools grade is shown separately in the Schools card above.
Census & demographics
- Population (ZIP)
- 9,859
Population outlook (Marion County) Hauer SSP2
- Today (2025)
- 365,905 people
- By 2030
- 376,768 · +3.0%
- By 2040
- 396,555 · +8.4%
- By 2050
- 412,723 · +12.8%
- By 2075
- 446,090 · +21.9%
- By 2100
- 436,193 · +19.2%
Race, ethnicity, and origin ACS 2023
- Neighborhood character
- Predominantly White (84%)
- Race & ethnicity
- White 84% Hispanic / Latino 12% Two or more races 9% Black 2%
- Hispanic origin (detail)
- Mexican 10% Puerto Rican 1%
- Common ancestry
- Portuguese 2% Slovak 2% Lithuanian 2%
- Foreign-born
- 4% · Canada
- Languages at home
- 91% English-only · Spanish 8% German/W. Germanic 1%
Political lean MEDSL · Marion
- 2024 margin
- Solid R (+31.6) · D 33.8% · R 65.5%
- 2008→2024 swing
- -20.0pp toward R · 2008: -11.6pp · 2024: -31.6pp
- All cycles
- 2024: R+31.6 2020: R+25.9 2016: R+26.2 2012: R+16.2 2008: R+11.6
Not yet ingested
- Civics
- —
Market trends
- HPI YoY
- ▼ -32.66%
- Current HPI
- 352.4197
- Rent YoY
- —
- Metro
- —
- State GDP YoY
- ▲ 3.28%
- F500 in state
- 36
Industry mix (Fortune 500 HQ in FL)
| Industry | F500 HQs | Revenue |
|---|---|---|
| Industrial Technology | 2 | $29B |
|
||
| Insurance | 2 | $17B |
|
||
| Retail | 1 | $60B |
|
||
| Technology Distribution | 1 | $58B |
|
||
| Homebuilding | 1 | $35B |
|
||
| Technology Manufacturing | 1 | $35B |
|
||
Price history
+1599.0% since first listed19 events — show timeline
- 2026-06-12 Listed $169,900 Stellar MLS as Distributed by MLS Grid
- 2026-04-09 Relisted — Stellar MLS as Distributed by MLS Grid
- 2026-04-09 Listing Removed — Stellar MLS as Distributed by MLS Grid
- 2026-04-05 Pending — Stellar MLS as Distributed by MLS Grid
- 2026-03-25 Listed $169,000 Stellar MLS as Distributed by MLS Grid
- 2010-05-25 Sold (Public Records) $64,000 Public Records
- 2010-04-15 Sold (MLS) $64,000 Stellar MLS as Distributed by MLS Grid
- 2009-07-06 Listed $64,000 Stellar MLS as Distributed by MLS Grid
- 2009-06-30 Listing Removed — Stellar MLS as Distributed by MLS Grid
- 2008-10-06 Listed $69,000 Stellar MLS as Distributed by MLS Grid
- 2008-09-25 Listing Removed — Stellar MLS as Distributed by MLS Grid
- 2008-03-20 Listed $99,900 Stellar MLS as Distributed by MLS Grid
- 2006-12-27 Sold (Public Records) $110,000 Public Records
- 2006-12-14 Sold (MLS) $110,000 Stellar MLS as Distributed by MLS Grid
- 2006-06-21 Listed $110,000 Stellar MLS as Distributed by MLS Grid
- 2005-09-19 Sold (Public Records) $110,000 Public Records
- 2005-09-09 Sold (MLS) $110,000 Stellar MLS as Distributed by MLS Grid
- 2005-07-07 Listed $113,900 Stellar MLS as Distributed by MLS Grid
- 1997-07-08 Sold (Public Records) $10,000 Public Records
Property tax history
+3.7%/yrLatest (2025): $965 · +28.8% YoY. Source: county tax records.
Cash-flow waterfall
monthlySold comps — $/sqft
last 12 mo · ≤1 miLoading sold comps…