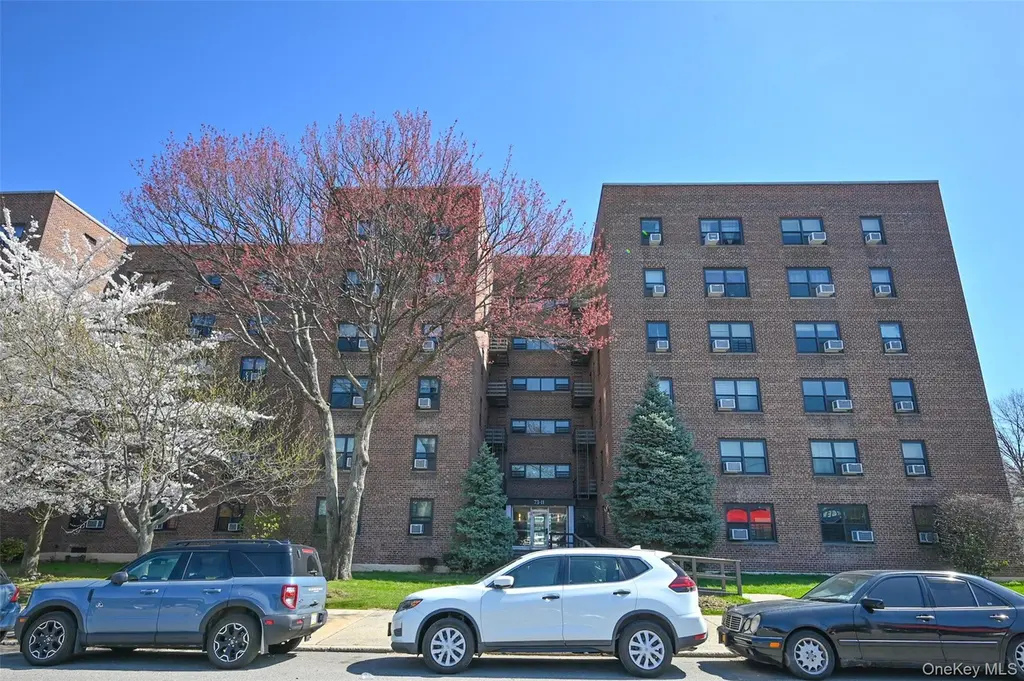
73-11 Bell Blvd Unit 1F · New York, NY
Flood risk 1/10 · Minimal
- FEMA flood zone
- X (unshaded)
- Chance of flooding over 30 yrs
- 0.0%
- Est. flood insurance / yr
- $507 – $1,088
Fire risk 1/10 · Minimal
- Est. fire insurance / yr
- $691 – $1,283
Heat risk 6/10 · Moderate
- Hot days now (above 97°F)
- 7 days/yr
- Hot days in 30 yrs
- 15 days/yr
Wind risk 6/10 · Moderate
- Chance of severe wind over 30 yrs
- 27.0%
Air-quality risk 4/10 · Minor
- Unhealthy air days now
- 6 days/yr
- Unhealthy air days in 30 yrs
- 6 days/yr
Risk factors via First Street. Map © Google.
Why this score? — see what drove the F grade
The composite is a weighted blend of 9 inputs, each scored 0–100. Each bar is that input's sub-score; the figure is the points it added to the 100-point composite (weight × sub-score).
- ARV discount +7.5/15.0
- Schools +5.0/10.0
- Rent growth +4.6/5.0
- Livability +3.8/5.0
- 1% rule +3.2/10.0
- Cash flow +2.8/30.0
- Condition / age +2.5/5.0
- DSCR +0.0/10.0
- Appreciation +0.0/10.0
$338,000
🖨 Deal sheet (PDF) 📄 Offer letter ✓ Due diligence
Listing remarks
Welcome to Windsor Park! This move-in-ready 2-bedroom, 1-bath co-op offers a bright and spacious layout featuring a sun-filled living room with dual exposure, upgraded kitchen and bathroom, and two generously sized bedrooms with ample closet space. Maintenance included everything except electricity and cooking gas. Enjoy a quiet, suburban setting with the convenience of an easy commute to Manhattan and proximity to the LIRR, shops, and local amenities. Set within beautifully maintained grounds, Windsor Park offers exceptional amenities, including a brand-new fitness center, seasonal pool, tennis, pickleball, and basketball courts, playgrounds, a community room, and laundry facilities in eve
Key facts
- Upgraded bathroom
- Pickleball
- Upgraded kitchen
Tags
Property features AI
Finance
- Other: Entry level: 1
- HOA & community: Association: Windsor Park
Exterior
- Parking: Parking lot; 1 parking space; 1 garage space; Parking fee applies
- Utilities: Public sewer; Electricity available; Natural gas available
- Home design: Stock cooperative property
- Construction: Brick construction materials
- Exterior features: Brick construction; Not waterfront
Interior
- Kitchen: Dishwasher; Gas cooktop; Gas oven; Refrigerator
- Bedrooms: 6 rooms total (includes bedrooms and living spaces)
- Bathrooms: 1 full bathroom
- Heating & cooling: Natural gas heating; Other heating; Wall/window air conditioning units
- Interior features: Other interior features
- Laundry & utility: Laundry room; Basement level laundry not present (laundry located in basement listed but basement: none); Outside laundry access
Neighborhood map
What this means for you Summary
Snapshot
- This is a 2-bed/1.0-bath condo listed at $338k.
Deal economics
- At list price, monthly cash flow is $-1k ($-14k/yr) — negative.
- To cash-flow at today's rent, offer at most $317k (6.2% below list).
- To meet the 1% rule (rent ≥ 1% of price), the offer needs to be $277k (18.0% below list).
- Recommended offer: $277k (18.0% below list) — sets the bar for 1% rule.
Location & tenants
- Location reads 75/100 on livability (#268 in NY, #4,188 nationally) — a middle-class / working-renter tenant base. Strengths: amenities A+, commute A+, health & safety A; Watch: crime F, cost of living F.
- Market conditions: Rents rising fast (+8.5%/yr); 249 active listings in the ZIP; 11 comparable units currently listed for rent nearby; rentals at typical pace (median 26d on market — plan ~3-4 weeks tenant-placement turnaround); solid renter incomes; 5,302 units permitted in Queens County in 2024 (4,918 in 5+ unit buildings).
- This rent runs 34% of the median local income ($98k/yr) — at the standard rent-burdened threshold; future hikes will face affordability resistance.
Forward outlook
- Local home prices are declining (-3.0%/yr); year-one equity from $2k of loan paydown is wiped out by about $10k of value loss. Plan a longer hold.
- Queens County population projected at +16% by 2050 — long-run rental-demand tailwind backs the buy-and-hold thesis.
Negotiation context
- It's been on market 17 days — a 2% lower offer ($333k) is reasonable based on typical stale-listing flexibility.
Risks & watch-outs
- Watch-outs: HOA is 35% of rent; built in 1952 — expect roof / HVAC / electrical / plumbing capex.
- Climate carrying-cost: major wind risk, 27% chance of damaging wind over 30y; extreme-heat days projected 7→15/yr by 2055 (HVAC capex compounding) — expect insurance premiums to compound above CPI over the hold.
Questions for the listing agent
- What do current leases actually rent for vs. the listed asking? Can we see a recent rent roll and the last 12 months of T-12 income?
- Built in 1952 — when were the roof, HVAC, electrical panel, plumbing, and water heater last replaced?
- What does the HOA fee cover, when was the last increase, and are there any pending special assessments or reserve-fund shortfalls?
- Any open or pending special assessments — roof, HVAC, plumbing, elevator, façade? What's the per-unit balance and payoff schedule, and is the seller paying it off at close or rolling it to the buyer?
- Is there a deadline driving the sale (1031 exchange, divorce, estate, relocation)? That informs how much negotiation room exists.
- Schools are B-rated — typically a magnet for longer-tenancy family renters. What's the average tenant stay here, and is there a school-zone premium baked into asking?
- Crime grade is F in this area — have there been break-ins, vandalism, or insurance claims at this property in the last 3 years? What carrier currently insures it and at what premium?
- The area grade is low — what's the realistic commute time and amenity access for the typical tenant pool here? Any planned neighborhood developments (good or bad) we should know about?
- What's the average days-on-market for RENTAL listings here right now (not sales)? A rising rental-DOM trend means longer vacancies and softer asking-rent achievability than the comps imply.
- What's the recent tenant-quality profile in this submarket — average credit score on applications, eviction rate, late-payment / NSF rate, and stable-employment percentage? A property-management company in the area should have these aggregated.
- How much new apartment / multifamily construction is in the pipeline within 1–3 miles? Heavy new supply (>2% of stock underway) typically softens rents 12–24 months out; light construction supports rent growth.
Investment metrics
- 1% rule
- 0.82% ✗
- Cap rate
- 2.29%
- Cash-on-cash
- -14.29%
- DSCR
- 0.36
- GRM
- 10.2
CMA / ARV
No comps found within radius.
Projected returns pro-forma
-3.0% appreciation · 8.0% rent growth · sell at horizon
- IRR
- -34.4%
- Equity multiple
- -0.18×
- Total profit
- $-111,250
- Equity at exit
- $50,397
- IRR
- -17.9%
- Equity multiple
- -0.27×
- Total profit
- $-119,977
- Equity at exit
- $29,224
Cash invested: $94,640 (down + closing). Projections, not guarantees.
Landlord ↔ Tenant lean methodology
- Overall (CITY)
- 0 Strongly Tenant-Friendly
- State New York
- 15 Strongly Tenant-Friendly · D+10
- County
- — inherits STATE
- City New York
- 0 Strongly Tenant-Friendly · D+34
ZIP-level market 11364
- Rents YoY
- 8.5%
- Active inventory
- 249
- Price-to-rent
- 10.2×
Monthly cashflow live
- Estimated rent
- $2,773 high interval (Pro) →
- Mortgage (P&I)
- −$1,773
- Tax est. 1.5%
- −$422 /mo · $5,070/yr
- Insurance
- −$141
- HOA est. from 1 same-building comp
- −$982
- Vacancy / Maint / Mgmt
- −$582
- Net cashflow
- $-1,127
Break-even live
Sensitivity live
| Price | -10% $-893 | -5% $-1,010 | +0% $-1,127 | +5% $-1,244 | +10% $-1,361 |
|---|---|---|---|---|---|
| Rent | -10% $-1,346 | -5% $-1,237 | +0% $-1,127 | +5% $-1,017 | +10% $-908 |
| Rate | -1.0pp $-957 | -0.5pp $-1,041 | base $-1,127 | +0.5pp $-1,215 | +1.0pp $-1,304 |
UW: 25.0% down · 7.5% · 30yr · 1.5% tax · 5.0% vac · 8.0% maint · 8.0% mgmt
Financing live
Cash to close
- Down payment
- $84,500
- Closing costs
- $10,140
- Reserves months
- —
- Total cash needed
- —
Loan-product check · same deal, 3 products live
Conventional
25% down · 7.5% · 30yr
- Down + closing
- —
- Monthly P&I
- —
- Monthly cashflow
- —
- DSCR
- —
- Eligible?
- —
Personal DTI + credit; lowest rate.
DSCR
20% down · 8.5% · 30yr
- Down + closing
- —
- Monthly P&I
- —
- Monthly cashflow
- —
- DSCR
- —
- Eligible?
- —
No personal income docs; deal must DSCR.
Hard money
10% down · 12.0% · 12mo
- Down + closing
- —
- Monthly P&I
- —
- Monthly cashflow
- —
- DSCR
- —
- Eligible?
- —
Short-term bridge; refi at stabilization.
Rent comps 11 comps
| Address | Beds | Baths | Sqft | Rent | $/sqft | DOM | Units | Dist |
|---|---|---|---|---|---|---|---|---|
| 6747 222nd St Oakland Gardens, NY | 3.0 | 1.0 | 924 | $2,700 | $2.92 | 3d | 1 | 0.39mi |
| 232-15 67th Ave Unit 1FL Flushing, NY | 2.0 | 2.0 | 900 | $2,900 | $3.22 | 5d | 1 | 0.91mi |
| 56-25 226th St Unit 3 Bayside, NY | 3.0 | 1.5 | 977 | $3,250 | $3.33 | 25d | 1 | 0.99mi |
| 7364 196th St Fresh Meadows, NY | 3.0 | 2.5 | 1000 | $5,500 | $5.50 | 25d | 1 | 1.07mi |
| 203-06 53rd Ave Unit 2 Flushing, NY | 1.0 | 1.0 | 850 | $2,200 | $2.59 | 25d | 1 | 1.11mi |
| 5839 196th Pl Fresh Meadows, NY | 2.0 | 1.0 | 750 | $2,750 | $3.67 | 25d | 1 | 1.17mi |
| 01 194th St Unit Main Fresh Meadows, NY | 1.0 | 1.0 | 895 | $2,400 | $2.68 | 16d | 1 | 1.26mi |
| 8827 208th St Queens Village, NY | 1.0 | 1.0 | 640 | $1,900 | $2.97 | 25d | 1 | 1.28mi |
| 240-53 68th Ave Unit 1st Floor Douglaston, NY | 2.0 | 1.0 | 900 | $2,500 | $2.78 | 25d | 1 | 1.34mi |
| 73-49 188th St Unit 2 Flushing, NY | 1.0 | 1.0 | 650 | $2,000 | $3.08 | 25d | 1 | 1.38mi |
| 8737 Marengo St #1 Hollis, NY | 1.0 | 1.0 | 720 | $1,950 | $2.71 | 12d | 1 | 1.40mi |
HOA detail condo
- Monthly dues
- $0 · $0/yr
- Likely covers
- gaselectriclandscapingpoolgym
- Assessments
- None detected in remarks — confirm with the listing agent.
Listing history 2 events
-
2026-04-30status Pending
-
2026-04-13$338,000 Active
ⓘ Source: listings_history table (triggers on properties + properties_extension) + one-shot
backfill from property_details.listing_events for pre-trigger history.
Climate risk First Street
- Flood 1/10 Low FEMA zone X (unshaded) · 0% chance over 30 yrs
- Wildfire 1/10 Low
- Heat 6/10 Major 7 d/yr ≥97°F today · 15 d/yr by 30 yrs out
- Wind 6/10 Major 27% chance of damaging wind over 30 yrs
- Air quality 4/10 Moderate 6 unhealthy d/yr today · 6 by 30 yrs out
Nearby sold comps map
Loading sold comps map…
Walkable amenities ~0.75 mi
Loading nearby amenities…
Taxation est. · year 1
- Rental income
- $33,278
- − Mortgage interest
- −$18,933
- − Property taxes
- −$5,070
- − Insurance
- −$1,690
- − Repairs & maintenance
- −$2,662
- − Management
- −$2,662
- − HOA
- −$11,784
- − Depreciation
- −$9,833
- Taxable loss
- −$19,356
- Est. tax savings @ 24.0%
- +$4,645
- After-tax cash flow
- $-8,879/yr
For passive investors: Depreciation is non-cash, so a rental often shows a tax loss while cash-flowing — sheltering income. Rental losses are passive: they offset passive income freely, and up to $25,000/yr can offset ordinary (W-2) income if you actively participate and your MAGI is under $100k (phasing out to $0 by $150k); unused losses carry forward. On sale, claimed depreciation is recaptured at up to 25%, and gains may owe capital-gains tax (a 1031 exchange can defer both). Figures are a year-1 estimate at your 24.0% rate — not tax advice; consult a CPA.
Schools (NCES district)
No district data.
Livability — New York
- Score
- 75/100
- State rank
- #268
- US rank
- #4188
Category grades
Schools grade is shown separately in the Schools card above.
Census & demographics
- Census place
- New York, NY
- County
- Queens County · 1,914,869 people
- City population
- 7,731,280
- Metro
- New York-Newark-Jersey City, NY-NJ-PA
- Population (ZIP)
- 35,276
- Household income
- $98,359
- Rent vs Own
- Severe rent burden
- 1288.0
Population outlook (Queens County) Hauer SSP2
- Today (2025)
- 2,546,320 people
- By 2030
- 2,643,059 · +3.8%
- By 2040
- 2,815,563 · +10.6%
- By 2050
- 2,944,423 · +15.6%
- By 2075
- 3,123,338 · +22.7%
- By 2100
- 3,098,688 · +21.7%
Race, ethnicity, and origin ACS 2023
- Neighborhood character
- Diverse neighborhood (Simpson 0.64)
- Race & ethnicity
- Asian 50% White 29% Hispanic / Latino 15% Two or more races 7% Black 2%
- Hispanic origin (detail)
- Puerto Rican 3% Dominican 2%
- Common ancestry
- Romanian 2% Scotch-Irish 2% Lithuanian 1%
- Foreign-born
- 44% · China, South Korea, Canada
- Languages at home
- 41% English-only · Chinese 30% Spanish 9% Korean 8%
Political lean MEDSL · Queens
- 2024 margin
- Strong D (+24.6) · D 62.3% · R 37.7%
- 2008→2024 swing
- -26.2pp toward R · 2008: 50.8pp · 2024: 24.6pp
- All cycles
- 2024: D+24.6 2020: D+45.2 2016: D+53.4 2012: D+58.5 2008: D+50.8
Not yet ingested
- Civics
- —
Market trends
- HPI YoY
- ▼ -179.50%
- Current HPI
- 242.5386
- Rent YoY
- ▲ 8.47%
- Metro
- New York-Newark-Jersey City, NY-NJ-PA
- State GDP YoY
- ▲ 2.60%
- F500 in state
- 92
Industry mix (Fortune 500 HQ in NY)
| Industry | F500 HQs | Revenue |
|---|---|---|
| Financial Services | 10 | $950B |
|
||
| Consumer Goods | 9 | $162B |
|
||
| Insurance | 4 | $225B |
|
||
| Telecommunications | 2 | $144B |
|
||
| Pharmaceuticals | 2 | $112B |
|
||
| Media / Entertainment | 2 | $69B |
|
||
Price history
2 events — show timeline
- 2026-04-30 Pending — OneKey® MLS as Distributed by MLS Grid
- 2026-04-13 Listed $338,000 OneKey® MLS as Distributed by MLS Grid
Cash-flow waterfall
monthlySold comps — $/sqft
last 12 mo · ≤1 miLoading sold comps…