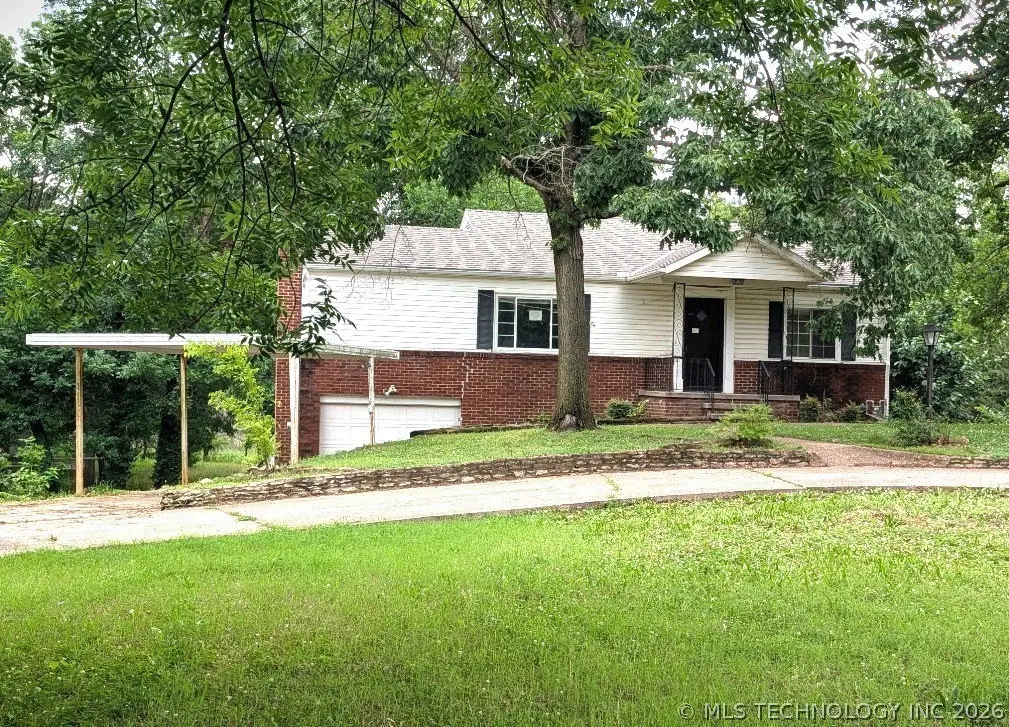
2076 Southview Ave · Bartlesville, OK
Flood risk 5/10 · Moderate
- FEMA flood zone
- X (shaded)
- Chance of flooding over 30 yrs
- 0.24%
- Est. flood insurance / yr
- $507 – $1,088
Fire risk 6/10 · Moderate
- Est. fire insurance / yr
- $2,463 – $4,575
Heat risk 6/10 · Moderate
- Hot days now (above 113°F)
- 7 days/yr
- Hot days in 30 yrs
- 17 days/yr
Wind risk 2/10 · Minimal
- Chance of severe wind over 30 yrs
- 2.0%
Air-quality risk 2/10 · Minimal
- Unhealthy air days now
- 1 days/yr
- Unhealthy air days in 30 yrs
- 3 days/yr
Risk factors via First Street. Map © Google.
Why this score? — see what drove the C- grade
The composite is a weighted blend of 9 inputs, each scored 0–100. Each bar is that input's sub-score; the figure is the points it added to the 100-point composite (weight × sub-score).
- ARV discount +15.0/15.0
- Cash flow +11.0/30.0
- Appreciation +10.0/10.0
- 1% rule +3.3/10.0
- DSCR +3.2/10.0
- Livability +3.2/5.0
- Schools +2.6/10.0
- Rent growth +2.5/5.0
- Condition / age +2.5/5.0
$145,000
🖨 Deal sheet 📄 Offer letter ✓ Due diligence
Listing remarks
Nestled on approximately 3.93 wooded acres near Bartlesville, this unique property offers the rare combination of privacy, seclusion, and convenient access to town amenities. The horse-friendly acreage provides plenty of room to enjoy the outdoors while maintaining the comfort of in-town living. The home features a versatile split-style floor plan with 4 bedrooms, 3 bathrooms, multiple living areas, a finished basement, bonus room, and ample space for family gatherings and entertaining. Mature trees surround the property, creating a peaceful setting with abundant wildlife and natural beauty. While the home could benefit from repairs, updates, and personal touches, it offers tremendous poten
Key facts
- Bonus room
- Wooded acres
- Finished basement
Tags
Property features AI
Finance
- Financial info: Annual tax amount available (not included per instructions)
- HOA & community: Gutters noted as community/maintenance feature
Exterior
- Parking: Attached garage with 1 garage space; Carport; Boat and RV parking access; Workshop and storage in garage; Circular driveway
- Security: No safety shelter
- Utilities: Public water; Public sewer; Electricity available; Natural gas available; Cable available; Phone available
- Home design: Faces west; Basement foundation
- Construction: Brick, vinyl siding and wood-frame construction; Asphalt fiberglass roof
- Exterior features: Concrete driveway; Rain gutters; Deck, patio and porch; Chain link and partial cross fencing; Mature trees and wooded lot; Horses allowed
Interior
- Kitchen: Oven; Kitchen with laminate counters
- Bedrooms: Master bedroom on the first floor with separate closets; Multiple basement bedrooms with private baths; Additional first-floor bedroom
- Flooring: Carpet; Hardwood; Laminate; Tile
- Bathrooms: Two full bathrooms and one half bathroom; Basement master full bath; Hall full bath on the first floor; Bedrooms with private bathrooms
- Heating & cooling: Central heating (gas); Central air conditioning; Gas water heater
- Interior features: Aluminum-framed windows; Storm doors; Laminate counters; Cable TV ready; Ceiling fans; Electric oven and range connections
- Laundry & utility: Washer hookup; Electric dryer hookup; Gas dryer hookup; Interior utility room (inside)
Neighborhood map
What this means for you Summary
Snapshot
- This is a 3-bed/1.5-bath single-family listed at $145k.
Deal economics
- At list price, monthly cash flow is $-61 ($-727/yr) — negative.
- To cash-flow at today's rent, offer at most $134k (7.4% below list).
- To meet the 1% rule (rent ≥ 1% of price), the offer needs to be $120k (17.1% below list).
- Recommended offer: $120k (17.1% below list) — sets the bar for 1% rule.
- Cap rate 5.8% vs local median 4.7% in Bartlesville — meaningfully above typical; check what's discounted (condition, days-on-market, listing class) to confirm the premium yield is real.
Location & tenants
- Location reads 64/100 on livability (#175 in OK) — a middle-class / working-renter tenant base. Strengths: cost of living A+, housing A+; Watch: employment C-, schools D+, crime D+.
- Bartlesville (town): math 30% / reading 29% proficiency, ranked #59 of 270 in OK (top 22%) — low school quality limits family demand, transient renter base, plan for 1-2y turnover.
- Market conditions: 137 active listings in the ZIP; 46 units permitted in Washington County in 2024 (0 in 5+ unit buildings).
- This rent runs 31% of the median local income ($47k/yr) — at the standard rent-burdened threshold; future hikes will face affordability resistance.
Forward outlook
- In year one you build about $16k of equity ($1k loan paydown + $14k appreciation (10.0% local appreciation)).
- Washington County population projected at +12% by 2050 — modest demand growth; plan on rents tracking national, not racing it.
- At projected returns (10.0% appreciation + 3.0% rent growth), your $41k cash investment doubles in ~3 years — after that, you're playing with house money.
- By year 3, paydown + projected appreciation supports a ~$39k cash-out refi (75% LTV) — recoverable capital for the next deal without selling this one.
Negotiation context
- Only 9 days on market — expect competitive offers; lowballing is unlikely to land.
- 5 sale attempts since 21y ago with the ask held roughly flat each time — persistent listings suggest the price (not the market) is what's stuck; bring a comps-based counter.
Risks & watch-outs
- Watch-outs: built in 1950 — expect roof / HVAC / electrical / plumbing capex.
- Climate carrying-cost: moderate flood risk; major wildfire risk; extreme-heat days projected 7→17/yr by 2055 (HVAC capex compounding) — expect insurance premiums to compound above CPI over the hold.
Questions for the listing agent
- What do current leases actually rent for vs. the listed asking? Can we see a recent rent roll and the last 12 months of T-12 income?
- Built in 1950 — when were the roof, HVAC, electrical panel, plumbing, and water heater last replaced?
- Is there a deadline driving the sale (1031 exchange, divorce, estate, relocation)? That informs how much negotiation room exists.
- Schools are D-rated, which usually means shorter tenancies and higher turnover. Who's the typical renter profile here, and what's been the actual vacancy rate?
- Crime grade is D in this area — have there been break-ins, vandalism, or insurance claims at this property in the last 3 years? What carrier currently insures it and at what premium?
- What's the average days-on-market for RENTAL listings here right now (not sales)? A rising rental-DOM trend means longer vacancies and softer asking-rent achievability than the comps imply.
- What's the recent tenant-quality profile in this submarket — average credit score on applications, eviction rate, late-payment / NSF rate, and stable-employment percentage? A property-management company in the area should have these aggregated.
- How much new for-sale + rental construction is in the pipeline within 1–3 miles? Heavy new supply typically softens prices + rents 12–24 months out; constrained supply supports both.
Investment metrics
- 1% rule
- 0.83% ✗
- Cap rate
- 5.79%
- Cash-on-cash
- -1.79%
- DSCR
- 0.92
- GRM
- 10.1
CMA / ARV
- ARV (on-the-fly)
- $216,800
- Comps found
- 12
Show comp detail 12 sales within ~0.75 mi
| Address | Dist | Beds/Ba | Sqft | Sold | Price | $/sf | Match |
|---|---|---|---|---|---|---|---|
| 2074 S Osage Ave | 0.07mi | 3/2.5 | 2,060 (-5%) | 11mo | $180,000 | $87 | 76 |
| 2095 S Osage Ave | 0.11mi | 4/2.0 (+1) | 2,327 (+7%) | 6mo | $179,900 | $77 | 70 |
| 1732 S Dewey | 0.48mi | 3/2.5 | 2,110 (-3%) | 2mo | $245,000 | $116 | 68 |
| 1829 S Dewey Ave | 0.38mi | 3/2.0 | 2,090 (-4%) | 12mo | $209,000 | $100 | 64 |
| 2081 Osage Ave | 0.10mi | 3/2.5 | 1,843 (-15%) | 4mo | $204,000 | $111 | 62 |
| 2045 S Osage Ave | 0.13mi | 3/2.0 | 1,923 (-11%) | 18mo | $195,000 | $101 | 59 |
| 1604 S Johnstone Ave | 0.66mi | 3/3.0 | 2,134 (-2%) | 18mo | $215,000 | $101 | 45 |
| 1616 S Dewey Ave | 0.62mi | 4/2.0 (+1) | 2,203 (+2%) | 21mo | $131,000 | $59 | 44 |
| 1625 Cherokee Pl | 0.61mi | 3/2.5 | 2,398 (+11%) | 8mo | $130,969 | $55 | 43 |
| 1601 Cherokee Pl | 0.67mi | 3/2.0 | 1,990 (-8%) | 14mo | $175,000 | $88 | 41 |
| 1524 S Johnstone Ave | 0.75mi | 3/2.0 | 1,894 (-13%) | 3mo | $208,300 | $110 | 40 |
| 512 W 20th St | 0.57mi | 4/2.5 (+1) | 2,467 (+14%) | 4mo | $179,000 | $73 | 38 |
Match score weights: distance 35% · size 25% · config 20% · recency 20%. Top-matched comps best support the ARV.
Projected returns pro-forma
10.0% appreciation · 3.0% rent growth · sell at horizon
- IRR
- 23.0%
- Equity multiple
- 2.85×
- Total profit
- $75,137
- Equity at exit
- $130,627
- IRR
- 20.5%
- Equity multiple
- 6.53×
- Total profit
- $224,346
- Equity at exit
- $281,703
Cash invested: $40,600 (down + closing). Projections, not guarantees.
Landlord ↔ Tenant lean methodology
- Overall (STATE)
- 83 Strongly Landlord-Friendly
- State Oklahoma
- 83 Strongly Landlord-Friendly · R+20
- County
- — inherits STATE
- City
- — inherits STATE
ZIP-level market 74003
- Home prices YoY
- 5.0%
- Active inventory
- 137
- Price-to-rent
- 10.1×
Monthly cashflow live
- Estimated rent
- $1,202 medium interval (Pro) →
- Mortgage (P&I)
- −$760
- Tax from tax record
- −$189 /mo · $2,272/yr
- Insurance
- −$60
- HOA
- −$0
- Vacancy / Maint / Mgmt
- −$252
- Net cashflow
- $-61
Break-even live
UW: 25.0% down · 7.5% · 30yr · 1.5% tax · 5.0% vac · 8.0% maint · 8.0% mgmt
Financing live
Cash to close
- Down payment
- $36,250
- Closing costs
- $4,350
- Reserves months
- —
- Total cash needed
- —
Loan-product check · same deal, 3 products live
Conventional
25% down · 7.5% · 30yr
- Down + closing
- —
- Monthly P&I
- —
- Monthly cashflow
- —
- DSCR
- —
- Eligible?
- —
Personal DTI + credit; lowest rate.
DSCR
20% down · 8.5% · 30yr
- Down + closing
- —
- Monthly P&I
- —
- Monthly cashflow
- —
- DSCR
- —
- Eligible?
- —
No personal income docs; deal must DSCR.
Hard money
10% down · 12.0% · 12mo
- Down + closing
- —
- Monthly P&I
- —
- Monthly cashflow
- —
- DSCR
- —
- Eligible?
- —
Short-term bridge; refi at stabilization.
Listing history 8 events
-
2026-06-19days on market $145,000 Active 9 DOM
-
2026-06-18days on market $145,000 Active 8 DOM
-
2026-06-17days on market $145,000 Active 7 DOM
-
2026-06-16days on market $145,000 Active 6 DOM
-
2026-06-15days on market $145,000 Active 5 DOM
-
2026-06-14days on market $145,000 Active 3 DOM
-
2026-06-12remarks 699-char remark
-
2026-06-12$145,000 Active 2 DOM
ⓘ Source: listings_history table (triggers on properties + properties_extension) + one-shot
backfill from property_details.listing_events for pre-trigger history.
Tax reassessment forecast OK · Resets to sale price
- Current annual tax
- $2,272 · $189/mo
- Projected year-2 tax
- $2,272 · $189/mo
- Expected delta
- $0/yr ($0/mo · 0.0%)
ⓘ Screening estimate from a state-policy table — verify with the county assessor before closing.
Climate risk First Street
- Flood 5/10 Major FEMA zone X (shaded) · 24% chance over 30 yrs
- Wildfire 6/10 Major
- Heat 6/10 Major 7 d/yr ≥113°F today · 17 d/yr by 30 yrs out
- Wind 2/10 Low 2% chance of damaging wind over 30 yrs
- Air quality 2/10 Low 1 unhealthy d/yr today · 3 by 30 yrs out
Nearby sold comps map
Loading sold comps map…
Walkable amenities ~0.75 mi
Loading nearby amenities…
Taxation est. · year 1
- Rental income
- $14,424
- − Mortgage interest
- −$8,122
- − Property taxes
- −$2,272
- − Insurance
- −$725
- − Repairs & maintenance
- −$1,154
- − Management
- −$1,154
- − Depreciation
- −$4,218
- Taxable loss
- −$3,221
- Est. tax savings @ 24.0%
- +$773
- After-tax cash flow
- $46/yr
For passive investors: Depreciation is non-cash, so a rental often shows a tax loss while cash-flowing — sheltering income. Rental losses are passive: they offset passive income freely, and up to $25,000/yr can offset ordinary (W-2) income if you actively participate and your MAGI is under $100k (phasing out to $0 by $150k); unused losses carry forward. On sale, claimed depreciation is recaptured at up to 25%, and gains may owe capital-gains tax (a 1031 exchange can defer both). Figures are a year-1 estimate at your 24.0% rate — not tax advice; consult a CPA.
Schools (NCES district)
- District
- Bartlesville
- NCES district ID
- 4003630
- Math proficiency
- 30% ▼ -13.00%
- Reading proficiency
- 29% ▼ -10.00%
- Median HH income
- $48,889
- Composite
- 25.69/100
- National rank
- #7389
- State rank
- #59 of 270 in OK
Livability — Bartlesville
- Score
- 64/100
- State rank
- #175
- US rank
- #13940
Category grades
Schools grade is shown separately in the Schools card above.
Census & demographics
- Census place
- Bartlesville, OK
- County
- Washington County · 41,935 people
- City population
- 41,935
- Metro
- Bartlesville, OK
- Population (ZIP)
- 14,024
- Household income
- $47,168
- Rent vs Own
- Severe rent burden
- 395.0
Population outlook (Washington County) Hauer SSP2
- Today (2025)
- 54,946 people
- By 2030
- 56,249 · +2.4%
- By 2040
- 58,867 · +7.1%
- By 2050
- 61,600 · +12.1%
- By 2075
- 69,355 · +26.2%
- By 2100
- 73,067 · +33.0%
Race, ethnicity, and origin ACS 2023
- Neighborhood character
- Predominantly White (69%)
- Race & ethnicity
- White 69% Two or more races 14% Hispanic / Latino 7% Native American 7% Black 4%
- Hispanic origin (detail)
- Mexican 6%
- Common ancestry
- Slovak 2% Lithuanian 2% Italian 2%
- Foreign-born
- 2% · Canada
- Languages at home
- 96% English-only · Spanish 4%
Political lean MEDSL · Washington
- 2024 margin
- Solid R (+47.6) · D 25.0% · R 72.7% · Other 2.4%
- 2008→2024 swing
- -3.1pp toward R · 2008: -44.6pp · 2024: -47.6pp
- All cycles
- 2024: R+47.6 2020: R+48.0 2016: R+48.5 2012: R+47.8 2008: R+44.6
Not yet ingested
- Civics
- —
Market trends
- HPI YoY
- ▲ 14.78%
- Current HPI
- 309.9534
- Rent YoY
- —
- Metro
- Bartlesville, OK
- State GDP YoY
- ▲ 1.55%
- F500 in state
- 6
Industry mix (Fortune 500 HQ in OK)
| Industry | F500 HQs | Revenue |
|---|---|---|
| Energy | 3 | $48B |
|
||
Price history
+9.8% since first listed18 events — show timeline
- 2026-06-08 Listed $145,000 MLS Technology, Inc.
- 2025-10-14 Relisted — MLS Technology, Inc.
- 2025-09-07 Listing Removed — MLS Technology, Inc.
- 2025-07-08 Pending — MLS Technology, Inc.
- 2025-06-20 Price Changed $150,000 MLS Technology, Inc.
- 2025-05-15 Price Changed $199,000 MLS Technology, Inc.
- 2025-04-23 Price Changed $220,000 MLS Technology, Inc.
- 2025-03-07 Listed $240,000 MLS Technology, Inc.
- 2019-04-15 Listing Removed — MLS Technology, Inc.
- 2019-01-10 Price Changed $179,900 MLS Technology, Inc.
- 2018-12-05 Price Changed $159,900 MLS Technology, Inc.
- 2018-11-20 Price Changed $169,900 MLS Technology, Inc.
- 2018-10-15 Listed $179,900 MLS Technology, Inc.
- 2007-10-25 Sold (Public Records) $157,000 Public Records
- 2005-06-30 Sold (Public Records) $132,000 Public Records
- 2005-06-23 Sold (MLS) $132,000 MLS Technology, Inc.
- 2005-05-18 Listing Removed — MLS Technology, Inc.
- 2005-05-17 Listed $132,000 MLS Technology, Inc.
Property tax history
-0.1%/yrLatest (2025): $2,272 · +0.0% YoY. Source: county tax records.
Cash-flow waterfall
monthlySold comps — $/sqft
last 12 mo · ≤1 miLoading sold comps…