 Multi-family
361 N Quartz St · Florence, AZ
Flood risk 1/10 · Minimal
- FEMA flood zone
- X (unshaded)
- Chance of flooding over 30 yrs
- 0.0%
- Est. flood insurance / yr
- $507 – $1,088
Fire risk 6/10 · Moderate
- Est. fire insurance / yr
- $610 – $1,132
Heat risk 9/10 · Severe
- Hot days now (above 112°F)
- 7 days/yr
- Hot days in 30 yrs
- 17 days/yr
Wind risk 1/10 · Minimal
- Chance of severe wind over 30 yrs
- —
Air-quality risk 2/10 · Minimal
- Unhealthy air days now
- 0 days/yr
- Unhealthy air days in 30 yrs
- 1 days/yr
Risk factors via First Street. Map © Google.
Why this score? — see what drove the B- grade
The composite is a weighted blend of 9 inputs, each scored 0–100. Each bar is that input's sub-score; the figure is the points it added to the 100-point composite (weight × sub-score).
- Cash flow +30.0/30.0
- DSCR +10.0/10.0
- 1% rule +9.3/10.0
- ARV discount +7.5/15.0
- Livability +3.0/5.0
- Rent growth +2.8/5.0
- Condition / age +2.5/5.0
- Schools +1.8/10.0
- Appreciation +0.0/10.0
$125,000
🖨 Deal sheet 📄 Offer letter ✓ Due diligence
Multi-family units
County records classify this as Multi-Family (2-4 Unit). Listing-text estimate: 1 unit. estimate disagrees with records
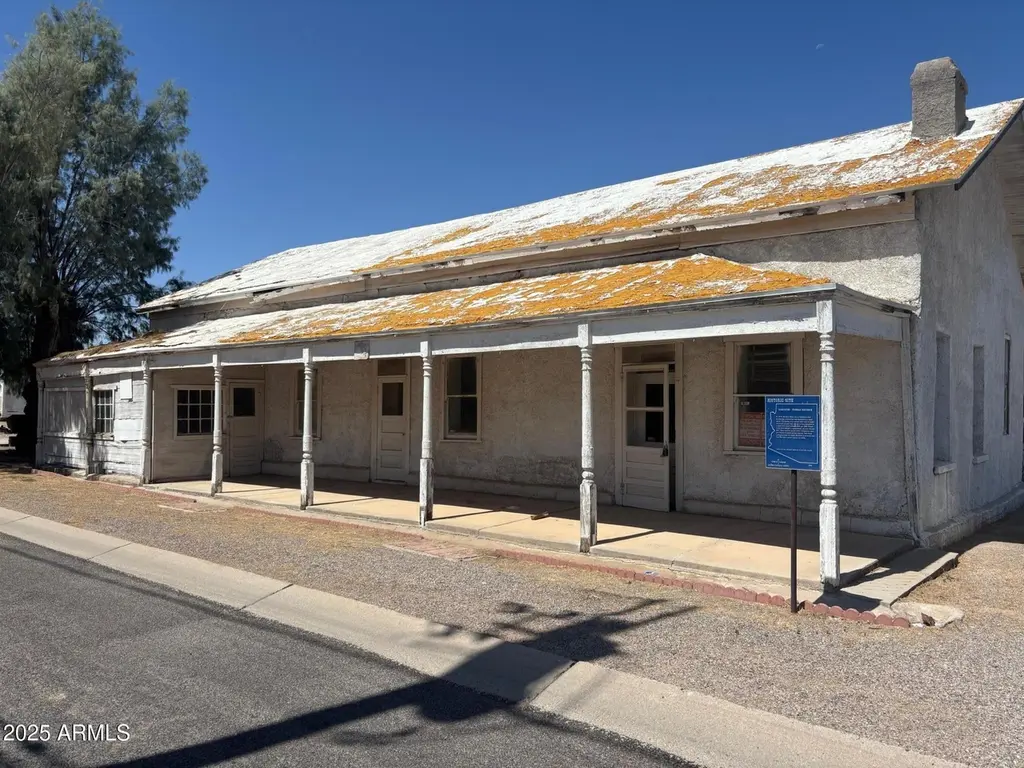
Listing remarks MLS
Rare opportunity to restore a circa-1900 historic triplex located on Quartz Street within Florence's nationally recognized historic district. Built during Florence's early territorial growth period following the Silver King mining boom, this property sits just blocks from some of the town's oldest preserved structures and civic landmarks. The building is currently not livable and requires full rehabilitation, but offers exceptional upside for investors seeking a character multi-unit restoration project in one of Arizona's oldest communities. Potential uses include long-term rental, short-term rental, or adaptive reuse consistent with the surrounding historic neighborhood. Cash or hard money only. Sold as-is.
Key facts
- 0.31 acre lot
- 5 parking spots
- Built 1900
Neighborhood map
What this means for you Summary
Snapshot
- This is a multifamily listed at $125k.
Deal economics
- At list price, monthly cash flow is $677 ($8k/yr) — positive.
- The deal already cash-flows at list — no discount required.
- Meets the 1% rule at list price ($2k rent vs $125k).
- Recommended offer: $114k (9.0% below list) — sets the bar for market timing.
- Cap rate 12.8% vs local median 4.2% in Florence — top-decile yield for the area; either an underpriced asset or a hidden risk that comps aren't pricing in. Stress-test before assuming the spread holds.
Location & tenants
- Location reads 60/100 on livability (#187 in AZ) — a middle-class / working-renter tenant base. Strengths: crime A+, cost of living A+, housing A+; Watch: schools F, amenities F, commute F.
- Florence Unified School District (4437) (rural): math 16% / reading 24% proficiency, ranked #178 of 249 in AZ (top 72%) — low school quality limits family demand, transient renter base, plan for 1-2y turnover.
- Market conditions: Rents rising (+1.3%/yr); 714 active listings in the ZIP; solid renter incomes; 9,504 units permitted in Pinal County in 2024 (776 in 5+ unit buildings).
Forward outlook
- Local home prices are declining (-3.0%/yr); year-one equity from $864 of loan paydown is wiped out by about $4k of value loss. Plan a longer hold.
- At projected returns (-3.0% appreciation + 1.3% rent growth), your $35k cash investment doubles in ~6 years — after that, you're playing with house money.
Negotiation context
- It's been on market 97 days — a 9% lower offer ($114k) is reasonable based on typical stale-listing flexibility.
- 7 sale attempts since 8y ago with the ask held roughly flat each time — persistent listings suggest the price (not the market) is what's stuck; bring a comps-based counter.
- Current owner paid $100k; 25% above their basis — modest negotiation headroom, anchor on the comps not their cost.
Risks & watch-outs
- Watch-outs: built in 1900 — expect roof / HVAC / electrical / plumbing capex.
- Climate carrying-cost: major wildfire risk; extreme-heat days projected 7→17/yr by 2055 (HVAC capex compounding) — expect insurance premiums to compound above CPI over the hold.
Questions for the listing agent
- It's been on market 97 days. Have you received any prior offers? Is the seller open to a 9% concession, seller financing, or rate buy-down credit?
- Built in 1900 — when were the roof, HVAC, electrical panel, plumbing, and water heater last replaced?
- Why hasn't it sold? Are there any deal-killer items the seller is aware of (foundation, flood, title, zoning, code violations)?
- Is there a deadline driving the sale (1031 exchange, divorce, estate, relocation)? That informs how much negotiation room exists.
- Schools are F-rated, which usually means shorter tenancies and higher turnover. Who's the typical renter profile here, and what's been the actual vacancy rate?
- What's the average days-on-market for RENTAL listings here right now (not sales)? A rising rental-DOM trend means longer vacancies and softer asking-rent achievability than the comps imply.
- What's the recent tenant-quality profile in this submarket — average credit score on applications, eviction rate, late-payment / NSF rate, and stable-employment percentage? A property-management company in the area should have these aggregated.
- How much new apartment / multifamily construction is in the pipeline within 1–3 miles? Heavy new supply (>2% of stock underway) typically softens rents 12–24 months out; light construction supports rent growth.
Investment metrics
- 1% rule
- 1.43% ✓
- Cap rate
- 12.79%
- Cash-on-cash
- 23.21%
- DSCR
- 2.03
- GRM
- 5.8
CMA / ARV
No comps found within radius.
Projected returns pro-forma
-3.0% appreciation · 1.27% rent growth · sell at horizon
- IRR
- 14.4%
- Equity multiple
- 1.56×
- Total profit
- $19,746
- Equity at exit
- $18,638
- IRR
- 21.9%
- Equity multiple
- 2.72×
- Total profit
- $60,358
- Equity at exit
- $10,808
Cash invested: $35,000 (down + closing). Projections, not guarantees.
Landlord ↔ Tenant lean methodology
- Overall (STATE)
- 87 Strongly Landlord-Friendly
- State Arizona
- 87 Strongly Landlord-Friendly · R+3
- County
- — inherits STATE
- City
- — inherits STATE
ZIP-level market 85132
- Home prices YoY
- -5.2%
- Rents YoY
- 1.3%
- Active inventory
- 714
- Price-to-rent
- 5.8×
Monthly cashflow live
- Estimated rent
- $1,792 medium interval (Pro) →
- Mortgage (P&I)
- −$656
- Tax from tax record
- −$31 /mo · $375/yr
- Insurance
- −$52
- HOA
- −$0
- Vacancy / Maint / Mgmt
- −$376
- Net cashflow
- $677
Break-even live
UW: 25.0% down · 7.5% · 30yr · 1.5% tax · 5.0% vac · 8.0% maint · 8.0% mgmt
Financing live
Cash to close
- Down payment
- $31,250
- Closing costs
- $3,750
- Reserves months
- —
- Total cash needed
- —
Loan-product check · same deal, 3 products live
Conventional
25% down · 7.5% · 30yr
- Down + closing
- —
- Monthly P&I
- —
- Monthly cashflow
- —
- DSCR
- —
- Eligible?
- —
Personal DTI + credit; lowest rate.
DSCR
20% down · 8.5% · 30yr
- Down + closing
- —
- Monthly P&I
- —
- Monthly cashflow
- —
- DSCR
- —
- Eligible?
- —
No personal income docs; deal must DSCR.
Hard money
10% down · 12.0% · 12mo
- Down + closing
- —
- Monthly P&I
- —
- Monthly cashflow
- —
- DSCR
- —
- Eligible?
- —
Short-term bridge; refi at stabilization.
Listing history 36 events
-
2026-06-18days on market $125,000 Active 97 DOM
-
2026-06-17days on market $125,000 Active 96 DOM
-
2026-06-16days on market $125,000 Active 95 DOM
-
2026-06-15days on market $125,000 Active 94 DOM
-
2026-06-13days on market $125,000 Active 92 DOM
-
2026-06-13days on market $125,000 Active 91 DOM
-
2026-06-09days on market $125,000 Active 88 DOM
-
2026-06-08days on market $125,000 Active 87 DOM
-
2026-06-07days on market $125,000 Active 86 DOM
-
2026-06-04days on market $125,000 Active 83 DOM
-
2026-06-03days on market $125,000 Active 82 DOM
-
2026-06-02days on market $125,000 Active 81 DOM
-
2026-06-01days on market $125,000 Active 80 DOM
-
2026-05-31days on market $125,000 Active 79 DOM
-
2026-03-13$125,000 Active 717-char remark
Show marketing remark (717 chars)
Rare opportunity to restore a circa-1900 historic triplex located on Quartz Street within Florence's nationally recognized historic district. Built during Florence's early territorial growth period following the Silver King mining boom, this property sits just blocks from some of the town's oldest preserved structures and civic landmarks. The building is currently not livable and requires full rehabilitation, but offers exceptional upside for investors seeking a character multi-unit restoration project in one of Arizona's oldest communities. Potential uses include long-term rental, short-term rental, or adaptive reuse consistent with the surrounding historic neighborhood. Cash or hard money only. Sold as-is.
-
2025-09-09price $159,900
-
2025-07-21status Active
-
2025-07-18historical Under Contract Accepting Backups
-
2025-07-11historical
-
2025-07-11historical
-
2025-06-26historical Under Contract Accepting Backups
-
2025-06-19$169,000 Active
-
2024-02-09soldstatus $100,000
-
2024-02-08soldstatus $88,000 Closed
-
2024-02-02status Pending
-
2024-01-26historical Under Contract Accepting Backups
-
2024-01-25$91,000 Active
-
2019-03-22soldstatus $63,000
-
2019-03-15soldstatus $63,000 Closed
-
2019-02-20historical Under Contract Accepting Backups
-
2019-02-20status Active
-
2019-02-06historical Under Contract Accepting Backups
-
2019-01-09$65,000 Active
-
2018-12-20soldstatus $63,000 Closed
-
2018-11-16historical Under Contract Accepting Backups
-
2018-10-31$65,000 Active
ⓘ Source: listings_history table (triggers on properties + properties_extension) + one-shot
backfill from property_details.listing_events for pre-trigger history.
Tax reassessment forecast AZ · Resets to sale price
- Current annual tax
- $375 · $31/mo
- Projected year-2 tax
- $825 · $69/mo
- Expected delta
- +$450/yr (+$37/mo · 119.9%)
ⓘ Screening estimate from a state-policy table — verify with the county assessor before closing.
Climate risk First Street
- Flood 1/10 Low FEMA zone X (unshaded) · 0% chance over 30 yrs
- Wildfire 6/10 Major
- Heat 9/10 Extreme 7 d/yr ≥112°F today · 17 d/yr by 30 yrs out
- Wind 1/10 Low
- Air quality 2/10 Low 0 unhealthy d/yr today · 1 by 30 yrs out
Nearby sold comps map
Loading sold comps map…
Walkable amenities ~0.75 mi
Loading nearby amenities…
Taxation est. · year 1
- Rental income
- $21,507
- − Mortgage interest
- −$7,002
- − Property taxes
- −$375
- − Insurance
- −$625
- − Repairs & maintenance
- −$1,721
- − Management
- −$1,721
- − Depreciation
- −$3,636
- Taxable income
- $6,427
- Est. tax owed @ 24.0%
- −$1,542
- After-tax cash flow
- $6,581/yr
For passive investors: Depreciation is non-cash, so a rental often shows a tax loss while cash-flowing — sheltering income. Rental losses are passive: they offset passive income freely, and up to $25,000/yr can offset ordinary (W-2) income if you actively participate and your MAGI is under $100k (phasing out to $0 by $150k); unused losses carry forward. On sale, claimed depreciation is recaptured at up to 25%, and gains may owe capital-gains tax (a 1031 exchange can defer both). Figures are a year-1 estimate at your 24.0% rate — not tax advice; consult a CPA.
Schools (NCES district)
- District
- Florence Unified School District (4437)
- NCES district ID
- 0402920
- Math proficiency
- 16% ▼ -11.00%
- Reading proficiency
- 24% ▼ -7.00%
- Median HH income
- $54,426
- Composite
- 18.31/100
- National rank
- #8950
- State rank
- #178 of 249 in AZ
Livability — Florence
- Score
- 60/100
- State rank
- #187
- US rank
- #19483
Category grades
Schools grade is shown separately in the Schools card above.
Census & demographics
- Census place
- Florence, AZ
- County
- Pinal County · 399,947 people
- City population
- 38,671
- Metro
- Phoenix-Mesa-Chandler, AZ
- Population (ZIP)
- 38,671
- Household income
- $79,000
- Rent vs Own
- Severe rent burden
- 102.0
Population outlook (Pinal County) Hauer SSP2
- Today (2025)
- 437,574 people
- By 2030
- 446,903 · +2.1%
- By 2040
- 452,589 · +3.4%
- By 2050
- 444,126 · +1.5%
- By 2075
- 430,300 · -1.7%
- By 2100
- 393,536 · -10.1%
Race, ethnicity, and origin ACS 2023
- Neighborhood character
- Diverse neighborhood (Simpson 0.56)
- Race & ethnicity
- White 59% Hispanic / Latino 28% Two or more races 9% Black 7% Native American 3%
- Hispanic origin (detail)
- Mexican 23%
- Common ancestry
- Italian 5% Portuguese 2% Romanian 2%
- Foreign-born
- 9% · Canada
- Languages at home
- 79% English-only · Spanish 17% German/W. Germanic 1% Russian/Polish/Slavic 1%
Political lean MEDSL · Pinal
- 2024 margin
- Strong R (+22.1) · D 38.5% · R 60.6%
- 2008→2024 swing
- -7.6pp toward R · 2008: -14.5pp · 2024: -22.1pp
- All cycles
- 2024: R+22.1 2020: R+17.3 2016: R+19.3 2012: R+17.1 2008: R+14.5
Not yet ingested
- Civics
- —
Market trends
- HPI YoY
- ▼ -12.75%
- Current HPI
- 233.6644
- Rent YoY
- ▲ 1.27%
- Metro
- Phoenix-Mesa-Chandler, AZ
- State GDP YoY
- ▲ 4.54%
- F500 in state
- 20
Industry mix (Fortune 500 HQ in AZ)
| Industry | F500 HQs | Revenue |
|---|---|---|
| Technology | 2 | $13B |
|
||
| Mining / Metals | 1 | $23B |
|
||
| Environmental Services | 1 | $16B |
|
||
| Metals / Steel | 1 | $14B |
|
||
| Technology Distribution | 1 | $9B |
|
||
| Homebuilding | 1 | $8B |
|
||
Price history
+92.3% since first listed22 events — show timeline
- 2026-03-13 Listed $125,000 ARMLS
- 2025-09-09 Price Changed $159,900 ARMLS
- 2025-07-21 Relisted — ARMLS
- 2025-07-18 Contingent — ARMLS
- 2025-07-11 Listing Removed — ARMLS
- 2025-07-11 Listing Removed — ARMLS
- 2025-06-26 Contingent — ARMLS
- 2025-06-19 Listed $169,000 ARMLS
- 2024-02-09 Sold (Public Records) $100,000 Public Records
- 2024-02-08 Sold (MLS) $88,000 ARMLS
- 2024-02-02 Pending — ARMLS
- 2024-01-26 Contingent — ARMLS
- 2024-01-25 Listed $91,000 ARMLS
- 2019-03-22 Sold (Public Records) $63,000 Public Records
- 2019-03-15 Sold (MLS) $63,000 ARMLS
- 2019-02-20 Contingent — ARMLS
- 2019-02-20 Relisted — ARMLS
- 2019-02-06 Contingent — ARMLS
- 2019-01-09 Listed $65,000 ARMLS
- 2018-12-20 Sold (MLS) $63,000 ARMLS
- 2018-11-16 Contingent — ARMLS
- 2018-10-31 Listed $65,000 ARMLS
Property tax history
-6.2%/yrLatest (2025): $375 · +2.8% YoY. Source: county tax records.
Cash-flow waterfall
monthlySold comps — $/sqft
last 12 mo · ≤1 miLoading sold comps…