 Multi-family
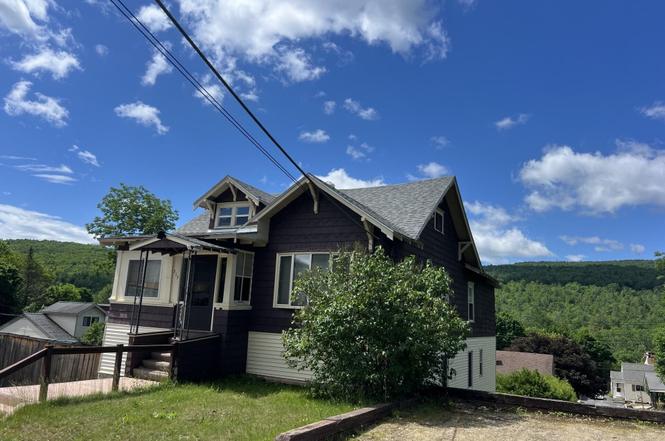
315 Pine St · Rumford, ME
Flood risk 1/10 · Minimal
- FEMA flood zone
- X (unshaded)
- Chance of flooding over 30 yrs
- 0.0%
- Est. flood insurance / yr
- $507 – $1,088
Fire risk 1/10 · Minimal
- Est. fire insurance / yr
- $669 – $1,243
Heat risk 2/10 · Minimal
- Hot days now (above 90°F)
- 7 days/yr
- Hot days in 30 yrs
- 17 days/yr
Wind risk 3/10 · Minor
- Chance of severe wind over 30 yrs
- 7.0%
Air-quality risk 2/10 · Minimal
- Unhealthy air days now
- 1 days/yr
- Unhealthy air days in 30 yrs
- 1 days/yr
Risk factors via First Street. Map © Google.
Why this score? — see what drove the A+ grade
The composite is a weighted blend of 9 inputs, each scored 0–100. Each bar is that input's sub-score; the figure is the points it added to the 100-point composite (weight × sub-score).
- Cash flow +30.0/30.0
- ARV discount +15.0/15.0
- 1% rule +10.0/10.0
- DSCR +10.0/10.0
- Appreciation +10.0/10.0
- Schools +6.3/10.0
- Livability +3.8/5.0
- Rent growth +2.5/5.0
- Condition / age +2.5/5.0
$154,900
🖨 Deal sheet 📄 Offer letter ✓ Due diligence
Multi-family units
County records classify this as Multi-Family (2-4 Unit). Listing-text estimate: 1 unit. estimate disagrees with records
Listing remarks
This two-unit building offers excellent investment or owner-occupancy potential. Each unit features three bedrooms, a living room, dining room, and kitchen, providing spacious accommodations for tenants or extended family. Some of the rooms has builtins and feature beautiful woodwork. Ample parking is available, as the sale includes the adjacent vacant lot. The property has been updated over the years, including improvements to the roof and electrical systems. The street-level unit features a welcoming porch and a generously sized bathroom. Exterior stairs at the rear of the building provide convenient access to all levels, including the full basement. Whether you choose to live in one unit
Key facts
- Ample parking
- Beautiful woodwork
- Updated roof
Tags
Property features AI
Finance
- Financial info: Two total units; Both units are 3-bedroom units; Reported gross income: $9,600; Reported operating expense: $999,999; Unit 1 actual rent: $800
Exterior
- Parking: Gravel and paved parking with 1–4 spaces
- Utilities: Public water; Public sewer; Water heater tied to heating system
- Home design: Two-unit multifamily property; Built in 1903; Wood frame with wood siding; Shingle roof
- Construction: Wood frame construction; Wood siding; Shingle roof; Full basement
- Exterior features: Neighborhood lot setting; Paved road access
Interior
- Kitchen: Unit 1 has a refrigerator; Unit 2 does not include a refrigerator
- Bedrooms: Two 3-bedroom units (one unit on first level, one unit in basement)
- Flooring: Carpet; Hardwood
- Bathrooms: Two full bathrooms (one in each unit)
- Heating & cooling: Baseboard and hot water heating; Circuit breaker electrical system
- Interior features: Carpet and hardwood flooring; Full basement entry
- Laundry & utility: Dedicated electric meter for each unit; No dedicated gas meters; No dedicated water heaters in either unit
Neighborhood map
What this means for you Summary
Snapshot
- This is a 6-bed/2.0-bath multifamily listed at $155k.
Deal economics
- At list price, monthly cash flow is $1k ($15k/yr) — positive.
- The deal already cash-flows at list — no discount required.
- Meets the 1% rule at list price ($3k rent vs $155k).
- Cap rate 16.3% vs local median 5.5% in Rumford — top-decile yield for the area; either an underpriced asset or a hidden risk that comps aren't pricing in. Stress-test before assuming the spread holds.
Location & tenants
- Location reads 75/100 on livability (#39 in ME, #4,030 nationally) — a middle-class / working-renter tenant base. Strengths: cost of living A+, housing A+, health & safety A+; Watch: commute D, schools F, amenities F.
- RSU 10 (rural): math 72% / reading 79% proficiency, ranked #107 of 112 in ME (top 96%) — strong family-tenant draw, lease renewals of 3-5y typical.
- Market conditions: 82 active listings in the ZIP; 329 units permitted in Oxford County in 2024 (0 in 5+ unit buildings).
Forward outlook
- In year one you build about $17k of equity ($1k loan paydown + $15k appreciation (10.0% local appreciation)).
- Oxford County population projected at -21% by 2050 — secular population decline; favor cash flow + early exit over multi-decade hold.
- At projected returns (10.0% appreciation + 3.0% rent growth), your $43k cash investment doubles in ~2 years — after that, you're playing with house money.
- By year 3, paydown + projected appreciation supports a ~$42k cash-out refi (75% LTV) — recoverable capital for the next deal without selling this one.
Negotiation context
- Only 3 days on market — expect competitive offers; lowballing is unlikely to land.
Risks & watch-outs
- Watch-outs: built in 1903 — expect roof / HVAC / electrical / plumbing capex.
Questions for the listing agent
- Built in 1903 — when were the roof, HVAC, electrical panel, plumbing, and water heater last replaced?
- Is there a deadline driving the sale (1031 exchange, divorce, estate, relocation)? That informs how much negotiation room exists.
- Schools are F-rated, which usually means shorter tenancies and higher turnover. Who's the typical renter profile here, and what's been the actual vacancy rate?
- What's the average days-on-market for RENTAL listings here right now (not sales)? A rising rental-DOM trend means longer vacancies and softer asking-rent achievability than the comps imply.
- What's the recent tenant-quality profile in this submarket — average credit score on applications, eviction rate, late-payment / NSF rate, and stable-employment percentage? A property-management company in the area should have these aggregated.
- How much new apartment / multifamily construction is in the pipeline within 1–3 miles? Heavy new supply (>2% of stock underway) typically softens rents 12–24 months out; light construction supports rent growth.
Investment metrics
- 1% rule
- 1.93% ✓
- Cap rate
- 16.29%
- Cash-on-cash
- 35.72%
- DSCR
- 2.59
- GRM
- 4.3
CMA / ARV
- ARV (on-the-fly)
- $191,488
- Comps found
- 3
Show comp detail 3 sales within ~0.75 mi
| Address | Dist | Beds/Ba | Sqft | Sold | Price | $/sf | Match |
|---|---|---|---|---|---|---|---|
| 205 Spruce St | 0.24mi | 5/3.0 (-1) | 2,152 (-1%) | 19mo | $190,000 | $88 | 62 |
| 412 Knox St | 0.16mi | 6/3.0 | 2,496 (+15%) | 16mo | $225,000 | $90 | 51 |
| 319 Knox St | 0.06mi | 5/3.0 (-1) | 2,470 (+14%) | 21mo | $200,000 | $81 | 48 |
Match score weights: distance 35% · size 25% · config 20% · recency 20%. Top-matched comps best support the ARV.
Projected returns pro-forma
10.0% appreciation · 3.0% rent growth · sell at horizon
- IRR
- 51.7%
- Equity multiple
- 4.84×
- Total profit
- $166,638
- Equity at exit
- $139,546
- IRR
- 45.3%
- Equity multiple
- 10.83×
- Total profit
- $426,146
- Equity at exit
- $300,937
Cash invested: $43,372 (down + closing). Projections, not guarantees.
Landlord ↔ Tenant lean methodology
- Overall (STATE)
- 41 Moderately Tenant-Leaning
- State Maine
- 41 Moderately Tenant-Leaning · D+2
- County
- — inherits STATE
- City
- — inherits STATE
ZIP-level market 04276
- Home prices YoY
- 4.4%
- Active inventory
- 82
- Price-to-rent
- 8.6×
Monthly cashflow live
- Estimated rent
- $2,990 medium interval (Pro) →
- Mortgage (P&I)
- −$812
- Tax from tax record
- −$194 /mo · $2,330/yr
- Insurance
- −$65
- HOA
- −$0
- Vacancy / Maint / Mgmt
- −$628
- Net cashflow
- $1,291
Break-even live
2-unit breakdown (identical units grouped — click to expand)
| Units | Beds | Baths | Est. rent |
|---|---|---|---|
| 2× units | 3 | 1.5 | $2,990 |
| #1 | 3 | 1.5 | $1,495 |
| #2 | 3 | 1.5 | $1,495 |
| Total (2 units) | $2,990 | ||
UW: 25.0% down · 7.5% · 30yr · 1.5% tax · 5.0% vac · 8.0% maint · 8.0% mgmt
Financing live
Cash to close
- Down payment
- $38,725
- Closing costs
- $4,647
- Reserves months
- —
- Total cash needed
- —
Loan-product check · same deal, 3 products live
Conventional
25% down · 7.5% · 30yr
- Down + closing
- —
- Monthly P&I
- —
- Monthly cashflow
- —
- DSCR
- —
- Eligible?
- —
Personal DTI + credit; lowest rate.
DSCR
20% down · 8.5% · 30yr
- Down + closing
- —
- Monthly P&I
- —
- Monthly cashflow
- —
- DSCR
- —
- Eligible?
- —
No personal income docs; deal must DSCR.
Hard money
10% down · 12.0% · 12mo
- Down + closing
- —
- Monthly P&I
- —
- Monthly cashflow
- —
- DSCR
- —
- Eligible?
- —
Short-term bridge; refi at stabilization.
Listing history 4 events
-
2026-06-18days on market $154,900 Active 3 DOM
-
2026-06-17days on market $154,900 Active 2 DOM
-
2026-06-16remarks 699-char remark
-
2026-06-16$154,900 Active 1 DOM
ⓘ Source: listings_history table (triggers on properties + properties_extension) + one-shot
backfill from property_details.listing_events for pre-trigger history.
Tax reassessment forecast ME · Partial reset (capped growth)
- Current annual tax
- $2,330 · $194/mo
- Projected year-2 tax
- $2,330 · $194/mo
- Expected delta
- $0/yr ($0/mo · 0.0%)
ⓘ Screening estimate from a state-policy table — verify with the county assessor before closing.
Climate risk First Street
- Flood 1/10 Low FEMA zone X (unshaded) · 0% chance over 30 yrs
- Wildfire 1/10 Low
- Heat 2/10 Low 7 d/yr ≥90°F today · 17 d/yr by 30 yrs out
- Wind 3/10 Moderate 7% chance of damaging wind over 30 yrs
- Air quality 2/10 Low 1 unhealthy d/yr today · 1 by 30 yrs out
Nearby sold comps map
Loading sold comps map…
Walkable amenities ~0.75 mi
Loading nearby amenities…
Taxation est. · year 1
- Rental income
- $35,880
- − Mortgage interest
- −$8,677
- − Property taxes
- −$2,330
- − Insurance
- −$774
- − Repairs & maintenance
- −$2,870
- − Management
- −$2,870
- − Depreciation
- −$4,506
- Taxable income
- $13,852
- Est. tax owed @ 24.0%
- −$3,324
- After-tax cash flow
- $12,169/yr
For passive investors: Depreciation is non-cash, so a rental often shows a tax loss while cash-flowing — sheltering income. Rental losses are passive: they offset passive income freely, and up to $25,000/yr can offset ordinary (W-2) income if you actively participate and your MAGI is under $100k (phasing out to $0 by $150k); unused losses carry forward. On sale, claimed depreciation is recaptured at up to 25%, and gains may owe capital-gains tax (a 1031 exchange can defer both). Figures are a year-1 estimate at your 24.0% rate — not tax advice; consult a CPA.
Schools (NCES district)
- District
- RSU 10
- NCES district ID
- 2314795
- Math proficiency
- 72% ▲ 50.00%
- Reading proficiency
- 79% ▲ 34.00%
- Median HH income
- $37,647
- Composite
- 62.72/100
- National rank
- #671
- State rank
- #107 of 112 in ME
Livability — Rumford
- Score
- 75/100
- State rank
- #39
- US rank
- #4030
Category grades
Schools grade is shown separately in the Schools card above.
Census & demographics
- Census place
- Rumford, ME
- Population (ZIP)
- 5,918
Population outlook (Oxford County) Hauer SSP2
- Today (2025)
- 55,853 people
- By 2030
- 54,190 · -3.0%
- By 2040
- 49,484 · -11.4%
- By 2050
- 43,958 · -21.3%
- By 2075
- 32,308 · -42.2%
- By 2100
- 21,858 · -60.9%
Race, ethnicity, and origin ACS 2023
- Neighborhood character
- Predominantly White (94%)
- Race & ethnicity
- White 94% Two or more races 4%
- Common ancestry
- Lithuanian 27% Slovak 5% German 2%
- Foreign-born
- 1% · Canada
- Languages at home
- 98% English-only · French/Haitian/Cajun 1% Tagalog/Filipino 1%
Political lean MEDSL · Oxford
- 2024 margin
- R (+12.9) · D 42.7% · R 55.6% · Other 1.7%
- 2008→2024 swing
- -28.9pp toward R · 2008: 16.0pp · 2024: -12.9pp
- All cycles
- 2024: R+12.9 2020: R+8.8 2016: R+13.0 2012: D+14.9 2008: D+16.0
Not yet ingested
- Civics
- —
Market trends
- HPI YoY
- ▲ 12.73%
- Current HPI
- 301.2786
- Rent YoY
- —
- Metro
- —
- State GDP YoY
- —
- F500 in state
- 0
Price history
1 event — show timeline
- 2026-06-15 Listed $154,900 MREIS
Property tax history
+1.8%/yrLatest (2025): $2,330 · +12.7% YoY. Source: county tax records.
Cash-flow waterfall
monthlySold comps — $/sqft
last 12 mo · ≤1 miLoading sold comps…