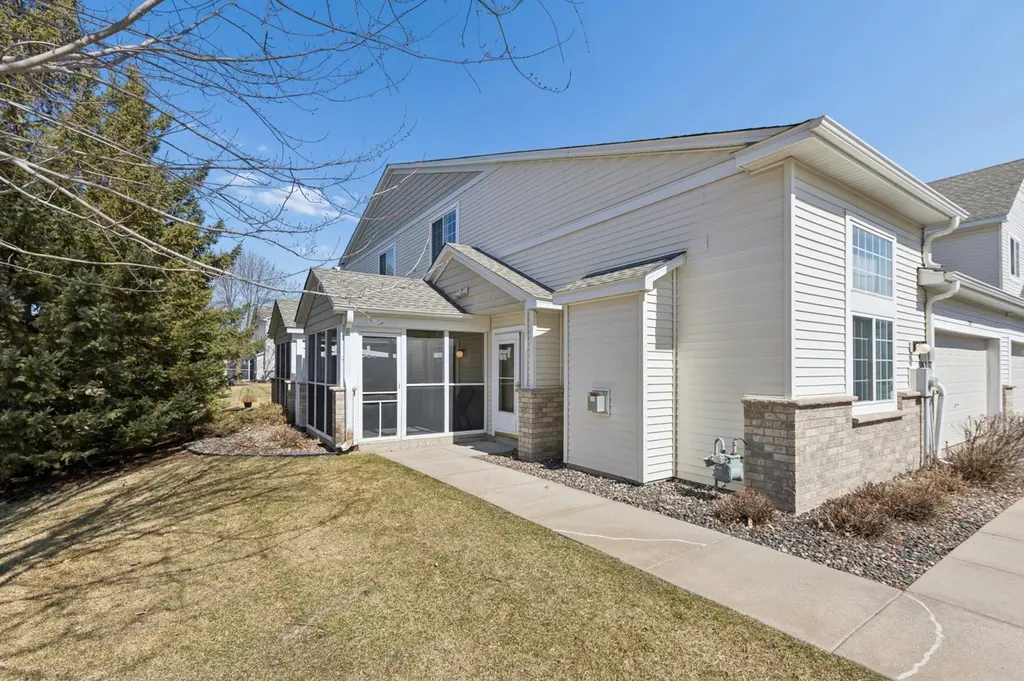
7635 Lachman Ave NE · Otsego, MN
Flood risk 1/10 · Minimal
- FEMA flood zone
- X
- Chance of flooding over 30 yrs
- 0.0%
- Est. flood insurance / yr
- $507 – $1,088
Fire risk 1/10 · Minimal
- Est. fire insurance / yr
- $888 – $1,650
Heat risk 2/10 · Minimal
- Hot days now (above 99°F)
- 7 days/yr
- Hot days in 30 yrs
- 14 days/yr
Wind risk 2/10 · Minimal
- Chance of severe wind over 30 yrs
- —
Air-quality risk 2/10 · Minimal
- Unhealthy air days now
- 1 days/yr
- Unhealthy air days in 30 yrs
- 2 days/yr
Risk factors via First Street. Map © Google.
Why this score? — see what drove the D grade
The composite is a weighted blend of 9 inputs, each scored 0–100. Each bar is that input's sub-score; the figure is the points it added to the 100-point composite (weight × sub-score).
- Cash flow +11.9/30.0
- ARV discount +7.5/15.0
- Schools +5.2/10.0
- 1% rule +4.4/10.0
- DSCR +3.5/10.0
- Livability +3.5/5.0
- Rent growth +2.5/5.0
- Condition / age +2.5/5.0
- Appreciation +0.0/10.0
$256,400
🖨 Deal sheet (PDF) 📄 Offer letter ✓ Due diligence
Listing remarks MLS
Really cute townhouse quad/end unit that overlooks cute grassy treed area. Great screened in porch/sun room, perfect for bug-free outside dining in summer. Large kitchen/dining area, main floor 1/2 bath, large vaulted living room w/gas fireplace. Upper level has 2 bedrooms, including master with large walk-in closet, and cute lofted area too! One year home warranty included. See this home today!
Key facts
- $328 HOA
- 2 garage spots
- Built 2004
Property features AI
Finance
- HOA & community: HOA: First Residential; Monthly association fee of $328; HOA covers hazard insurance, lawn care, grounds maintenance, professional management, snow removal and water
Exterior
- Parking: Attached garage; 2-car garage; 16' garage door
- Utilities: City water (connected); City sewer (connected); Natural gas
- Home design: Residential attached property; Two levels
- Construction: Asphalt roof; Foundation area of 1,080
- Exterior features: Irregular lot; City street frontage; Porch; Sun room
Interior
- Kitchen: Range; Microwave; Dishwasher; Refrigerator; Exhaust fan
- Bedrooms: 2 bedrooms (two bedrooms located on upper level); Loft on upper level
- Bathrooms: 1 full bathroom (upper level); 1 half bathroom (main level)
- Heating & cooling: Forced air heating; Central air conditioning
- Interior features: Main floor half bath and upper-level full bath; Main floor laundry; Three-season porch; Porch / sun room; Gas fireplace in living room
- Laundry & utility: Washer; Dryer; Main floor laundry
Neighborhood map
What this means for you Summary
Snapshot
- This is a 2-bed/1.0-bath townhouse listed at $256k.
Deal economics
- At list price, monthly cash flow is $-66 ($-791/yr) — negative.
- To cash-flow at today's rent, offer at most $245k (4.5% below list).
- To meet the 1% rule (rent ≥ 1% of price), the offer needs to be $242k (5.6% below list).
- Recommended offer: $242k (5.6% below list) — sets the bar for 1% rule.
- Cap rate 6.0% vs local median 4.0% in Otsego — top-decile yield for the area; either an underpriced asset or a hidden risk that comps aren't pricing in. Stress-test before assuming the spread holds.
Location & tenants
- Location reads 69/100 on livability (#367 in MN) — a middle-class / working-renter tenant base. Strengths: employment A+, housing A+, crime A-; Watch: cost of living C-, amenities F, commute F.
- Independent School District 728 (suburban): math 56% / reading 60% proficiency, ranked #37 of 301 in MN (top 12%) — acceptable for families but not a draw, mixed tenant base, ~2y average lease; only 14% free/reduced lunch — higher-income household profile.
- Zoned schools: Otsego Elementary (math 64% / reading 64%, grade B, #157 of 857 statewide, top 19%, 563 students, 21% FRL); Rogers Middle School (math 61% / reading 63%, grade B+, #19 of 258 statewide, top 8%, 979 students, 16% FRL); Rogers Senior High (math 66% / reading 64%, grade B, #28 of 471 statewide, top 6%, 1,740 students, 18% FRL) — zoned schools at 18% FRL track the district average.
- Market conditions: 143 active listings in the ZIP; 2 comparable units currently listed for rent nearby; high-income renter base; 1,260 units permitted in Wright County in 2024 (180 in 5+ unit buildings).
Forward outlook
- Local home prices are declining (-3.0%/yr); year-one equity from $2k of loan paydown is wiped out by about $8k of value loss. Plan a longer hold.
- Wright County population projected at +9% by 2050 — modest demand growth; plan on rents tracking national, not racing it.
Negotiation context
- It's been on market 16 days — a 2% lower offer ($253k) is reasonable based on typical stale-listing flexibility.
- 3 sale attempts since 22y ago with the ask held roughly flat each time — persistent listings suggest the price (not the market) is what's stuck; bring a comps-based counter.
- Current owner paid $165k; list at $256k implies a 55% gain — meaningful room to come down on a strong offer.
Questions for the listing agent
- What do current leases actually rent for vs. the listed asking? Can we see a recent rent roll and the last 12 months of T-12 income?
- What does the HOA fee cover, when was the last increase, and are there any pending special assessments or reserve-fund shortfalls?
- Is there a deadline driving the sale (1031 exchange, divorce, estate, relocation)? That informs how much negotiation room exists.
- Schools are B-rated — typically a magnet for longer-tenancy family renters. What's the average tenant stay here, and is there a school-zone premium baked into asking?
- The area grade is low — what's the realistic commute time and amenity access for the typical tenant pool here? Any planned neighborhood developments (good or bad) we should know about?
- What's the average days-on-market for RENTAL listings here right now (not sales)? A rising rental-DOM trend means longer vacancies and softer asking-rent achievability than the comps imply.
- What's the recent tenant-quality profile in this submarket — average credit score on applications, eviction rate, late-payment / NSF rate, and stable-employment percentage? A property-management company in the area should have these aggregated.
- How much new for-sale + rental construction is in the pipeline within 1–3 miles? Heavy new supply typically softens prices + rents 12–24 months out; constrained supply supports both.
Investment metrics
- 1% rule
- 0.94% ✗
- Cap rate
- 5.98%
- Cash-on-cash
- -1.10%
- DSCR
- 0.95
- GRM
- 8.8
CMA / ARV
No comps found within radius.
Projected returns pro-forma
-3.0% appreciation · 3.0% rent growth · sell at horizon
- IRR
- -18.0%
- Equity multiple
- 0.37×
- Total profit
- $-45,582
- Equity at exit
- $38,230
- IRR
- -10.1%
- Equity multiple
- 0.38×
- Total profit
- $-44,433
- Equity at exit
- $22,169
Cash invested: $71,792 (down + closing). Projections, not guarantees.
Landlord ↔ Tenant lean methodology
- Overall (STATE)
- 46 Balanced
- State Minnesota
- 46 Balanced · D+2
- County
- — inherits STATE
- City
- — inherits STATE
ZIP-level market 55301
- Home prices YoY
- -14.2%
- Active inventory
- 143
- Price-to-rent
- 8.8×
Monthly cashflow live
- Estimated rent
- $2,421 medium interval (Pro) →
- Mortgage (P&I)
- −$1,345
- Tax from tax record
- −$199 /mo · $2,386/yr
- Insurance
- −$107
- HOA
- −$328
- Vacancy / Maint / Mgmt
- −$508
- Net cashflow
- $-66
Break-even live
Sensitivity live
| Price | -10% $79 | -5% $7 | +0% $-66 | +5% $-138 | +10% $-211 |
|---|---|---|---|---|---|
| Rent | -10% $-257 | -5% $-162 | +0% $-66 | +5% $30 | +10% $125 |
| Rate | -1.0pp $63 | -0.5pp $-1 | base $-66 | +0.5pp $-132 | +1.0pp $-200 |
UW: 25.0% down · 7.5% · 30yr · 1.5% tax · 5.0% vac · 8.0% maint · 8.0% mgmt
Financing live
Cash to close
- Down payment
- $64,100
- Closing costs
- $7,692
- Reserves months
- —
- Total cash needed
- —
Loan-product check · same deal, 3 products live
Conventional
25% down · 7.5% · 30yr
- Down + closing
- —
- Monthly P&I
- —
- Monthly cashflow
- —
- DSCR
- —
- Eligible?
- —
Personal DTI + credit; lowest rate.
DSCR
20% down · 8.5% · 30yr
- Down + closing
- —
- Monthly P&I
- —
- Monthly cashflow
- —
- DSCR
- —
- Eligible?
- —
No personal income docs; deal must DSCR.
Hard money
10% down · 12.0% · 12mo
- Down + closing
- —
- Monthly P&I
- —
- Monthly cashflow
- —
- DSCR
- —
- Eligible?
- —
Short-term bridge; refi at stabilization.
Rent comps 2 comps
| Address | Beds | Baths | Sqft | Rent | $/sqft | DOM | Units | Dist |
|---|---|---|---|---|---|---|---|---|
| 7712 Lachman Ave NE Albertville, MN | 3.0 | 2.0 | 1525 | $2,259 | $1.48 | 0d | 1 | 0.07mi |
| 10740 County Road 37 NE Albertville, MN | 2.0–3.0 | 1.0–2.0 | 1092 | $1,525 | $1.40 | 0d | 4 | 1.43mi |
HOA detail
- Monthly dues
- $328 · $3,936/yr
- Likely covers
- gas
Listing history 11 events
-
2026-05-14status Pending
-
2026-04-18historical Contingent - Subject to Statutory Rescission
-
2026-04-11$256,400 Active
-
2026-04-01historical $256,400
-
2017-07-26soldstatus $165,000
-
2017-07-24soldstatus $165,000 Sold 398-char remark
Show marketing remark (398 chars)
Really cute townhouse quad/end unit that overlooks cute grassy treed area. Great screened in porch/sun room, perfect for bug-free outside dining in summer. Large kitchen/dining area, main floor 1/2 bath, large vaulted living room w/gas fireplace. Upper level has 2 bedrooms, including master with large walk-in closet, and cute lofted area too! One year home warranty included. See this home today!
-
2017-06-16status Pending 398-char remark
Show marketing remark (398 chars)
Really cute townhouse quad/end unit that overlooks cute grassy treed area. Great screened in porch/sun room, perfect for bug-free outside dining in summer. Large kitchen/dining area, main floor 1/2 bath, large vaulted living room w/gas fireplace. Upper level has 2 bedrooms, including master with large walk-in closet, and cute lofted area too! One year home warranty included. See this home today!
-
2017-06-15historical Contingent - Inspection 398-char remark
Show marketing remark (398 chars)
Really cute townhouse quad/end unit that overlooks cute grassy treed area. Great screened in porch/sun room, perfect for bug-free outside dining in summer. Large kitchen/dining area, main floor 1/2 bath, large vaulted living room w/gas fireplace. Upper level has 2 bedrooms, including master with large walk-in closet, and cute lofted area too! One year home warranty included. See this home today!
-
2017-05-31$170,000 Active 398-char remark
Show marketing remark (398 chars)
Really cute townhouse quad/end unit that overlooks cute grassy treed area. Great screened in porch/sun room, perfect for bug-free outside dining in summer. Large kitchen/dining area, main floor 1/2 bath, large vaulted living room w/gas fireplace. Upper level has 2 bedrooms, including master with large walk-in closet, and cute lofted area too! One year home warranty included. See this home today!
-
2004-12-03historical
-
2004-07-16$189,205
ⓘ Source: listings_history table (triggers on properties + properties_extension) + one-shot
backfill from property_details.listing_events for pre-trigger history.
Tax reassessment forecast MN · Partial reset (capped growth)
- Current annual tax
- $2,386 · $199/mo
- Projected year-2 tax
- $2,629 · $219/mo
- Expected delta
- +$243/yr (+$20/mo · 10.2%)
ⓘ Screening estimate from a state-policy table — verify with the county assessor before closing.
Climate risk First Street
- Flood 1/10 Low FEMA zone X · 0% chance over 30 yrs
- Wildfire 1/10 Low
- Heat 2/10 Low 7 d/yr ≥99°F today · 14 d/yr by 30 yrs out
- Wind 2/10 Low
- Air quality 2/10 Low 1 unhealthy d/yr today · 2 by 30 yrs out
Nearby sold comps map
Loading sold comps map…
Walkable amenities ~0.75 mi
Loading nearby amenities…
Taxation est. · year 1
- Rental income
- $29,048
- − Mortgage interest
- −$14,362
- − Property taxes
- −$2,386
- − Insurance
- −$1,282
- − Repairs & maintenance
- −$2,324
- − Management
- −$2,324
- − HOA
- −$3,936
- − Depreciation
- −$7,459
- Taxable loss
- −$5,025
- Est. tax savings @ 24.0%
- +$1,206
- After-tax cash flow
- $415/yr
For passive investors: Depreciation is non-cash, so a rental often shows a tax loss while cash-flowing — sheltering income. Rental losses are passive: they offset passive income freely, and up to $25,000/yr can offset ordinary (W-2) income if you actively participate and your MAGI is under $100k (phasing out to $0 by $150k); unused losses carry forward. On sale, claimed depreciation is recaptured at up to 25%, and gains may owe capital-gains tax (a 1031 exchange can defer both). Figures are a year-1 estimate at your 24.0% rate — not tax advice; consult a CPA.
Schools (NCES district)
- District
- Independent School District 728
- NCES district ID
- 2711370
- Math proficiency
- 56% ▼ -15.00%
- Reading proficiency
- 60% ▼ -10.00%
- Median HH income
- $82,336
- Composite
- 52.5/100
- National rank
- #1567
- State rank
- #37 of 301 in MN
Livability — Otsego
- Score
- 69/100
- State rank
- #367
- US rank
- #8641
Category grades
Schools grade is shown separately in the Schools card above.
Census & demographics
- Census place
- Otsego, MN
- County
- Wright County · 79,164 people
- Metro
- Minneapolis-St. Paul-Bloomington, MN-WI
- Population (ZIP)
- 13,482
- Household income
- $129,232
- Rent vs Own
- Severe rent burden
- 50.0
Population outlook (Wright County) Hauer SSP2
- Today (2025)
- 142,526 people
- By 2030
- 146,915 · +3.1%
- By 2040
- 153,625 · +7.8%
- By 2050
- 155,416 · +9.0%
- By 2075
- 150,352 · +5.5%
- By 2100
- 130,631 · -8.3%
Race, ethnicity, and origin ACS 2023
- Neighborhood character
- Predominantly White (85%)
- Race & ethnicity
- White 85% Black 7% Two or more races 5% Asian 2%
- Common ancestry
- Portuguese 10% Romanian 5% Lithuanian 4%
- Foreign-born
- 7% · South Korea, China, Canada
Political lean MEDSL · Wright
- 2024 margin
- Strong R (+29.4) · D 34.4% · R 63.8% · Other 1.8%
- 2008→2024 swing
- -11.9pp toward R · 2008: -17.4pp · 2024: -29.4pp
- All cycles
- 2024: R+29.4 2020: R+28.6 2016: R+33.2 2012: R+21.4 2008: R+17.4
Not yet ingested
- Civics
- —
Market trends
- HPI YoY
- ▼ -38.52%
- Current HPI
- 233.6299
- Rent YoY
- —
- Metro
- Minneapolis-St. Paul-Bloomington, MN-WI
- State GDP YoY
- ▲ 2.41%
- F500 in state
- 34
Industry mix (Fortune 500 HQ in MN)
| Industry | F500 HQs | Revenue |
|---|---|---|
| Healthcare | 2 | $407B |
|
||
| Retail | 2 | $150B |
|
||
| Consumer Goods | 2 | $32B |
|
||
| Industrial Machinery | 2 | $6B |
|
||
| Agriculture | 1 | $40B |
|
||
| Healthcare / Medical Devices | 1 | $32B |
|
||
Price history
+35.5% since first listed11 events — show timeline
- 2026-05-14 Pending — NORTHSTARMLS as Distributed by MLS Grid
- 2026-04-18 Contingent — NORTHSTARMLS as Distributed by MLS Grid
- 2026-04-11 Listed $256,400 NORTHSTARMLS as Distributed by MLS Grid
- 2026-04-01 Coming Soon $256,400 NORTHSTARMLS as Distributed by MLS Grid
- 2017-07-26 Sold (Public Records) $165,000 Public Records
- 2017-07-24 Sold (MLS) $165,000 NORTHSTARMLS as Distributed by MLS Grid
- 2017-06-16 Pending — NORTHSTARMLS as Distributed by MLS Grid
- 2017-06-15 Contingent — NORTHSTARMLS as Distributed by MLS Grid
- 2017-05-31 Listed $170,000 NORTHSTARMLS as Distributed by MLS Grid
- 2004-12-03 Listing Removed — NORTHSTARMLS as Distributed by MLS Grid
- 2004-07-16 Listed $189,205 NORTHSTARMLS as Distributed by MLS Grid
Property tax history
+2.7%/yrLatest (2025): $2,386 · -6.6% YoY. Source: county tax records.
Cash-flow waterfall
monthlySold comps — $/sqft
last 12 mo · ≤1 miLoading sold comps…