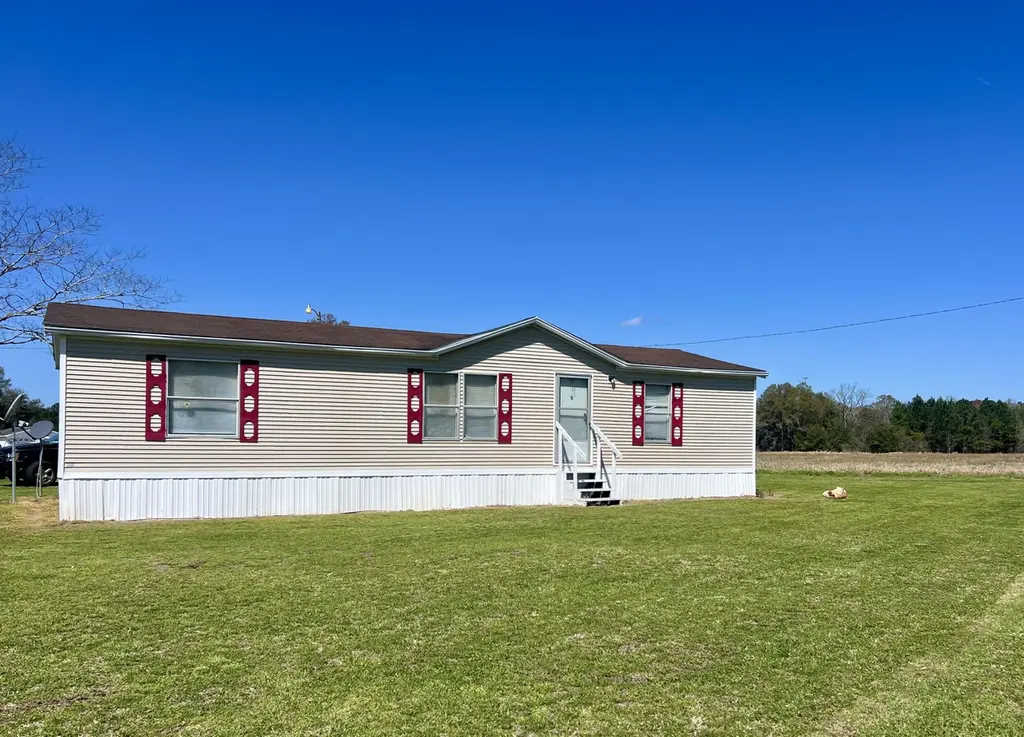
134 Richardson St · Eutawville, SC
Flood risk 1/10 · Minimal
- FEMA flood zone
- X (unshaded)
- Chance of flooding over 30 yrs
- 0.0%
- Est. flood insurance / yr
- $507 – $1,088
Fire risk 8/10 · Major
- Est. fire insurance / yr
- $783 – $1,453
Heat risk 8/10 · Major
- Hot days now (above 109°F)
- 7 days/yr
- Hot days in 30 yrs
- 18 days/yr
Wind risk 8/10 · Major
- Chance of severe wind over 30 yrs
- 80.0%
Air-quality risk 3/10 · Minor
- Unhealthy air days now
- 3 days/yr
- Unhealthy air days in 30 yrs
- 3 days/yr
Risk factors via First Street. Map © Google.
Why this score? — see what drove the B- grade
The composite is a weighted blend of 9 inputs, each scored 0–100. Each bar is that input's sub-score; the figure is the points it added to the 100-point composite (weight × sub-score).
- Cash flow +25.7/30.0
- DSCR +8.6/10.0
- ARV discount +7.5/15.0
- Appreciation +6.8/10.0
- 1% rule +5.5/10.0
- Schools +5.0/10.0
- Rent growth +2.5/5.0
- Livability +2.5/5.0
- Condition / age +2.5/5.0
$159,000
🖨 Deal sheet 📄 Offer letter ✓ Due diligence
Listing remarks
Amazing opportunity in Cross, SC! This 0.98-acre property, just minutes from the lakes, offers ample space, privacy, and endless possibilities. Ideal for a first home or a peaceful retirement spot, it's the perfect place to relax, grow, invest, or create your dream retreat. Whether you're an investor or simply looking for promising land, this gem in a thriving area won't last long--act fast!
Key facts
- 0.98 acre lot
- Built 1996
- Listed 83 days
Property features AI
Finance
- Other: No other financial details provided
Exterior
- Parking: Off-street parking
- Security: No security features listed
- Utilities: Septic tank; Electric service by Berkeley Electric Co-Op
- Home design: Manufactured/Mobile home (double wide); Single-story (one level); Fee simple ownership
- Construction: Asphalt roof; Aluminum skirting
- Exterior features: Level lot; Approximately 0.5–1 acre
Interior
- Kitchen: Electric range; Refrigerator
- Bedrooms: 3 bedrooms (master bedroom on lower level)
- Flooring: Carpet; Laminate
- Bathrooms: 2 bathrooms
- Heating & cooling: Central heating (electric); Central air conditioning
- Interior features: Blown ceiling insulation
- Laundry & utility: No additional laundry details provided
Neighborhood map
What this means for you Summary
Snapshot
- This is a 3-bed/2.0-bath manufactured listed at $159k.
Deal economics
- At list price, monthly cash flow is $382 ($5k/yr) — positive.
- The deal already cash-flows at list — no discount required.
- Meets the 1% rule at list price ($2k rent vs $159k).
- Recommended offer: $149k (6.0% below list) — sets the bar for market timing.
- Cap rate 9.2% vs local median 1.9% in Eutawville — top-decile yield for the area; either an underpriced asset or a hidden risk that comps aren't pricing in. Stress-test before assuming the spread holds.
Location & tenants
- Location reads 49/100 on livability (#369 in SC) — a working-class tenant base; expect higher turnover. Strengths: cost of living A+, health & safety A+, crime A; Watch: amenities F, commute F, employment F.
- Market conditions: 62 active listings in the ZIP; 87 units permitted in Orangeburg County in 2024 (0 in 5+ unit buildings).
Forward outlook
- In year one you build about $7k of equity ($1k loan paydown + $6k appreciation (3.6% local appreciation)).
- Orangeburg County population projected at -27% by 2050 — secular population decline; favor cash flow + early exit over multi-decade hold.
- At projected returns (3.6% appreciation + 3.0% rent growth), your $45k cash investment doubles in ~4 years — after that, you're playing with house money.
- By year 6, paydown + projected appreciation supports a ~$36k cash-out refi (75% LTV) — recoverable capital for the next deal without selling this one.
Negotiation context
- It's been on market 84 days — a 6% lower offer ($149k) is reasonable based on typical stale-listing flexibility.
Risks & watch-outs
- Climate carrying-cost: severe wind risk, 80% chance of damaging wind over 30y; severe wildfire risk; extreme-heat days projected 7→18/yr by 2055 (HVAC capex compounding) — expect insurance premiums to compound above CPI over the hold.
Questions for the listing agent
- It's been on market 84 days. Have you received any prior offers? Is the seller open to a 6% concession, seller financing, or rate buy-down credit?
- Why hasn't it sold? Are there any deal-killer items the seller is aware of (foundation, flood, title, zoning, code violations)?
- Is there a deadline driving the sale (1031 exchange, divorce, estate, relocation)? That informs how much negotiation room exists.
- Schools are F-rated, which usually means shorter tenancies and higher turnover. Who's the typical renter profile here, and what's been the actual vacancy rate?
- What's the average days-on-market for RENTAL listings here right now (not sales)? A rising rental-DOM trend means longer vacancies and softer asking-rent achievability than the comps imply.
- What's the recent tenant-quality profile in this submarket — average credit score on applications, eviction rate, late-payment / NSF rate, and stable-employment percentage? A property-management company in the area should have these aggregated.
- How much new for-sale + rental construction is in the pipeline within 1–3 miles? Heavy new supply typically softens prices + rents 12–24 months out; constrained supply supports both.
Investment metrics
- 1% rule
- 1.05% ✓
- Cap rate
- 9.17%
- Cash-on-cash
- 10.29%
- DSCR
- 1.46
- GRM
- 7.9
CMA / ARV
No comps found within radius.
Projected returns pro-forma
3.61% appreciation · 3.0% rent growth · sell at horizon
- IRR
- 18.6%
- Equity multiple
- 2.09×
- Total profit
- $48,601
- Equity at exit
- $77,044
- IRR
- 19.4%
- Equity multiple
- 3.98×
- Total profit
- $132,582
- Equity at exit
- $123,243
Cash invested: $44,520 (down + closing). Projections, not guarantees.
Landlord ↔ Tenant lean methodology
- Overall (STATE)
- 90 Strongly Landlord-Friendly
- State South Carolina
- 90 Strongly Landlord-Friendly · R+6
- County
- — inherits STATE
- City
- — inherits STATE
ZIP-level market 29436
- Home prices YoY
- 1.5%
- Active inventory
- 62
- Price-to-rent
- 7.9×
Monthly cashflow live
- Estimated rent
- $1,669 medium interval (Pro) →
- Mortgage (P&I)
- −$834
- Tax from tax record
- −$37 /mo · $440/yr
- Insurance
- −$66
- HOA
- −$0
- Vacancy / Maint / Mgmt
- −$350
- Net cashflow
- $382
Break-even live
UW: 25.0% down · 7.5% · 30yr · 1.5% tax · 5.0% vac · 8.0% maint · 8.0% mgmt
Financing live
Cash to close
- Down payment
- $39,750
- Closing costs
- $4,770
- Reserves months
- —
- Total cash needed
- —
Loan-product check · same deal, 3 products live
Conventional
25% down · 7.5% · 30yr
- Down + closing
- —
- Monthly P&I
- —
- Monthly cashflow
- —
- DSCR
- —
- Eligible?
- —
Personal DTI + credit; lowest rate.
DSCR
20% down · 8.5% · 30yr
- Down + closing
- —
- Monthly P&I
- —
- Monthly cashflow
- —
- DSCR
- —
- Eligible?
- —
No personal income docs; deal must DSCR.
Hard money
10% down · 12.0% · 12mo
- Down + closing
- —
- Monthly P&I
- —
- Monthly cashflow
- —
- DSCR
- —
- Eligible?
- —
Short-term bridge; refi at stabilization.
Listing history 18 events
-
2026-06-19days on market $159,000 Active 84 DOM
-
2026-06-18days on market $159,000 Active 83 DOM
-
2026-06-17days on market $159,000 Active 82 DOM
-
2026-06-16days on market $159,000 Active 81 DOM
-
2026-06-15days on market $159,000 Active 80 DOM
-
2026-06-14days on market $159,000 Active 78 DOM
-
2026-06-13price $159,000 Active 77 DOM
-
2026-06-12days on market $165,000 Active 77 DOM
-
2026-06-09days on market $165,000 Active 74 DOM
-
2026-06-08days on market $165,000 Active 73 DOM
-
2026-06-07days on market $165,000 Active 72 DOM
-
2026-06-07days on market $165,000 Active 71 DOM
-
2026-06-04days on market $165,000 Active 68 DOM
-
2026-06-02days on market $165,000 Active 67 DOM
-
2026-06-01days on market $165,000 Active 66 DOM
-
2026-05-31days on market $165,000 Active 65 DOM
-
2026-05-31days on market $165,000 Active 64 DOM
-
2026-03-27$165,000 Active
ⓘ Source: listings_history table (triggers on properties + properties_extension) + one-shot
backfill from property_details.listing_events for pre-trigger history.
Tax reassessment forecast SC · Resets to sale price
- Current annual tax
- $440 · $37/mo
- Projected year-2 tax
- $906 · $76/mo
- Expected delta
- +$466/yr (+$39/mo · 105.9%)
ⓘ Screening estimate from a state-policy table — verify with the county assessor before closing.
Climate risk First Street
- Flood 1/10 Low FEMA zone X (unshaded) · 0% chance over 30 yrs
- Wildfire 8/10 Severe
- Heat 8/10 Severe 7 d/yr ≥109°F today · 18 d/yr by 30 yrs out
- Wind 8/10 Severe 80% chance of damaging wind over 30 yrs
- Air quality 3/10 Moderate 3 unhealthy d/yr today · 3 by 30 yrs out
Nearby sold comps map
Loading sold comps map…
Walkable amenities ~0.75 mi
Loading nearby amenities…
Taxation est. · year 1
- Rental income
- $20,025
- − Mortgage interest
- −$8,906
- − Property taxes
- −$440
- − Insurance
- −$795
- − Repairs & maintenance
- −$1,602
- − Management
- −$1,602
- − Depreciation
- −$4,625
- Taxable income
- $2,054
- Est. tax owed @ 24.0%
- −$493
- After-tax cash flow
- $4,086/yr
For passive investors: Depreciation is non-cash, so a rental often shows a tax loss while cash-flowing — sheltering income. Rental losses are passive: they offset passive income freely, and up to $25,000/yr can offset ordinary (W-2) income if you actively participate and your MAGI is under $100k (phasing out to $0 by $150k); unused losses carry forward. On sale, claimed depreciation is recaptured at up to 25%, and gains may owe capital-gains tax (a 1031 exchange can defer both). Figures are a year-1 estimate at your 24.0% rate — not tax advice; consult a CPA.
Schools (NCES district)
No district data.
Livability — Eutawville
- Score
- 49/100
- State rank
- #369
- US rank
- #25782
Category grades
Schools grade is shown separately in the Schools card above.
Census & demographics
- Population (ZIP)
- 4,257
Population outlook (Orangeburg County) Hauer SSP2
- Today (2025)
- 82,698 people
- By 2030
- 78,615 · -4.9%
- By 2040
- 69,308 · -16.2%
- By 2050
- 60,629 · -26.7%
- By 2075
- 42,678 · -48.4%
- By 2100
- 28,136 · -66.0%
Race, ethnicity, and origin ACS 2023
- Neighborhood character
- Majority White (53%)
- Race & ethnicity
- White 53% Black 44% Two or more races 3% Hispanic / Latino 2%
- Common ancestry
- Slovak 4% Lithuanian 4% Danish 1%
- Foreign-born
- 1% · Canada
Political lean MEDSL · Orangeburg
- 2024 margin
- Strong D (+24.6) · D 61.8% · R 37.2% · Other 1.1%
- 2008→2024 swing
- -13.5pp toward R · 2008: 38.1pp · 2024: 24.6pp
- All cycles
- 2024: D+24.6 2020: D+33.2 2016: D+37.0 2012: D+43.5 2008: D+38.1
Not yet ingested
- Civics
- —
Market trends
- HPI YoY
- ▲ 3.61%
- Current HPI
- 247.0789
- Rent YoY
- —
- Metro
- —
- State GDP YoY
- ▲ 4.51%
- F500 in state
- 2
Industry mix (Fortune 500 HQ in SC)
| Industry | F500 HQs | Revenue |
|---|---|---|
| Packaging | 1 | $7B |
|
||
Price history
1 event — show timeline
- 2026-03-27 Listed $165,000 Charleston Trident MLS
Property tax history
+4.4%/yrLatest (2024): $440 · +7.2% YoY. Source: county tax records.
Cash-flow waterfall
monthlySold comps — $/sqft
last 12 mo · ≤1 miLoading sold comps…