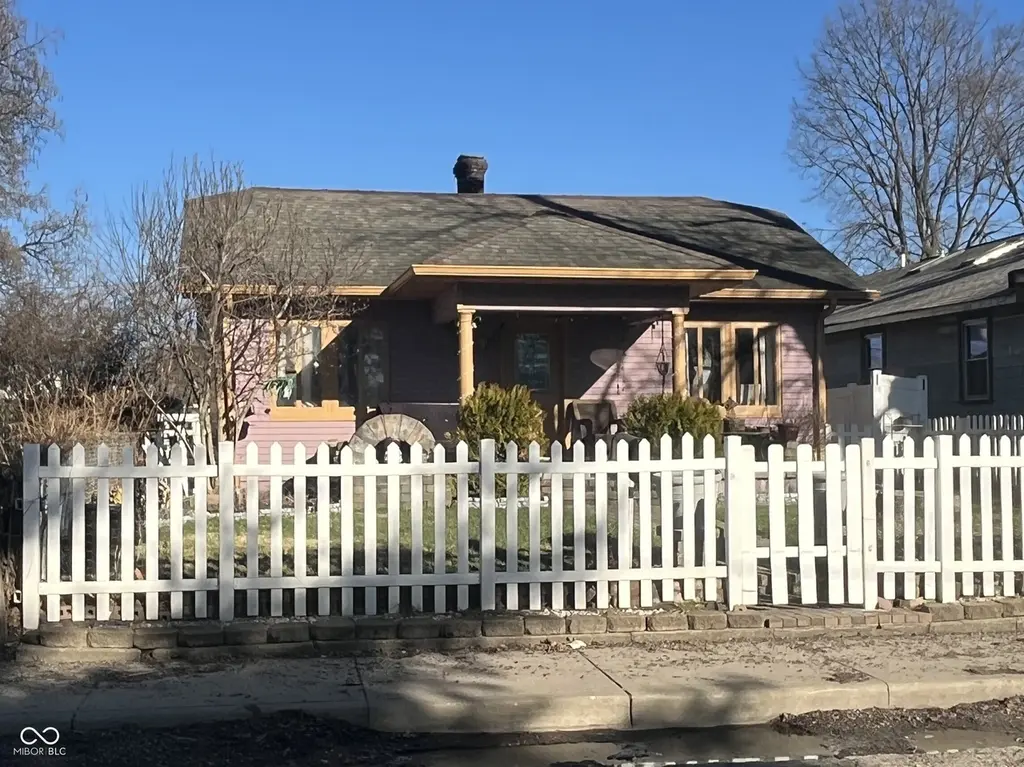
533 S Keystone Ave · Indianapolis city (balance), IN
Flood risk 1/10 · Minimal
- FEMA flood zone
- X (unshaded)
- Chance of flooding over 30 yrs
- 0.0%
- Est. flood insurance / yr
- $473 – $860
Fire risk 1/10 · Minimal
- Est. fire insurance / yr
- $717 – $1,331
Heat risk 4/10 · Minor
- Hot days now (above 101°F)
- 7 days/yr
- Hot days in 30 yrs
- 19 days/yr
Wind risk 2/10 · Minimal
- Chance of severe wind over 30 yrs
- 0.0%
Air-quality risk 4/10 · Minor
- Unhealthy air days now
- 5 days/yr
- Unhealthy air days in 30 yrs
- 7 days/yr
Risk factors via First Street. Map © Google.
Why this score? — see what drove the B- grade
The composite is a weighted blend of 9 inputs, each scored 0–100. Each bar is that input's sub-score; the figure is the points it added to the 100-point composite (weight × sub-score).
- Cash flow +28.3/30.0
- ARV discount +15.0/15.0
- DSCR +10.0/10.0
- 1% rule +6.8/10.0
- Rent growth +3.2/5.0
- Livability +2.5/5.0
- Condition / age +2.5/5.0
- Schools +1.4/10.0
- Appreciation +0.0/10.0
$89,900
🖨 Deal sheet 📄 Offer letter ✓ Due diligence
Listing remarks MLS
Cute bungalow with decent sized yard. Much potential for right investor or fixer-upper.
Key facts
- Formal dining room
- Eat in kitchen
- Plenty of parking
Tags
Property features AI
Exterior
- Parking: Detached garage with storage (1 garage space)
- Utilities: Public water; Municipal sewer connection; Solid waste service available
- Home design: Single-family residence; One and one-half story
- Construction: Aluminum siding; Block foundation
- Exterior features: Full privacy fencing with gate and wrought iron; Yard (lot under 1/4 acre)
Interior
- Kitchen: Electric oven; Refrigerator
- Bedrooms: Two bedrooms total — one on the main level and one on the upper level (Upper bedroom sized 29x10)
- Flooring: Hardwood floors
- Bathrooms: One full bathroom (on the main level)
- Heating & cooling: Forced air heating (natural gas); Central air conditioning
- Interior features: Hardwood floors; Finished basement area; Five total rooms
- Laundry & utility: Washer; Dryer; Gas water heater
Neighborhood map
What this means for you Summary
Snapshot
- This is a 2-bed/1.0-bath single-family listed at $90k.
Deal economics
- At list price, monthly cash flow is $287 ($3k/yr) — positive.
- The deal already cash-flows at list — no discount required.
- Meets the 1% rule at list price ($1k rent vs $90k).
- Recommended offer: $89k (1.5% below list) — sets the bar for market timing.
- Cap rate 10.1% vs local median 4.4% in Indianapolis city (balance) — top-decile yield for the area; either an underpriced asset or a hidden risk that comps aren't pricing in. Stress-test before assuming the spread holds.
Location & tenants
- Location reads: area grade B — affects rentability + tenant quality, not the cash-flow math above.
- Indianapolis Public Schools (urban): math 14% / reading 20% proficiency, ranked #286 of 301 in IN (top 95%) — low school quality limits family demand, transient renter base, plan for 1-2y turnover; 77% free/reduced lunch — lower-income household profile, screen leases tightly.
- Zoned schools: William Mckinley School 39 (math 23% / reading 15%, grade F, #829 of 994 statewide, top 84%, 369 students, 76% FRL); Arsenal Technical High School (math 6% / reading 27%, grade F, #353 of 369 statewide, top 96%, 2,366 students, 74% FRL) — zoned schools at 75% FRL track the district average.
- Market conditions: Rents rising (+2.9%/yr); 493 active listings in the ZIP; 40 comparable units currently listed for rent nearby; rentals at typical pace (median 24d on market — plan ~3-4 weeks tenant-placement turnaround); 45% of comp listings sitting > 30 days — soft ceiling on asking rent; 1,906 units permitted in Marion County in 2024 (621 in 5+ unit buildings).
Forward outlook
- Local home prices are declining (-3.0%/yr); year-one equity from $622 of loan paydown is wiped out by about $3k of value loss. Plan a longer hold.
- Marion County population projected at +18% by 2050 — long-run rental-demand tailwind backs the buy-and-hold thesis.
- At projected returns (-3.0% appreciation + 2.9% rent growth), your $25k cash investment doubles in ~9 years — after that, you're playing with house money.
Negotiation context
- It's been on market 23 days — a 2% lower offer ($89k) is reasonable based on typical stale-listing flexibility.
- 3 sale attempts since 21y ago with the ask held roughly flat each time — persistent listings suggest the price (not the market) is what's stuck; bring a comps-based counter.
- Current owner paid $11k; list at $90k implies a 717% gain — meaningful room to come down on a strong offer.
Risks & watch-outs
- Watch-outs: built in 1925 — expect roof / HVAC / electrical / plumbing capex.
Questions for the listing agent
- Built in 1925 — when were the roof, HVAC, electrical panel, plumbing, and water heater last replaced?
- Is there a deadline driving the sale (1031 exchange, divorce, estate, relocation)? That informs how much negotiation room exists.
- What's the average days-on-market for RENTAL listings here right now (not sales)? A rising rental-DOM trend means longer vacancies and softer asking-rent achievability than the comps imply.
- What's the recent tenant-quality profile in this submarket — average credit score on applications, eviction rate, late-payment / NSF rate, and stable-employment percentage? A property-management company in the area should have these aggregated.
- How much new for-sale + rental construction is in the pipeline within 1–3 miles? Heavy new supply typically softens prices + rents 12–24 months out; constrained supply supports both.
Investment metrics
- 1% rule
- 1.18% ✓
- Cap rate
- 10.12%
- Cash-on-cash
- 13.67%
- DSCR
- 1.61
- GRM
- 7.0
CMA / ARV
- ARV (on-the-fly)
- $144,720
- Comps found
- 12
Show comp detail 12 sales within ~0.75 mi
| Address | Dist | Beds/Ba | Sqft | Sold | Price | $/sf | Match |
|---|---|---|---|---|---|---|---|
| 2217 Spann Ave | 0.18mi | 2/1.0 | 720 (0%) | 3mo | $177,000 | $246 | 89 |
| 524 S Rural St | 0.23mi | 2/1.0 | 720 (0%) | 7mo | $148,000 | $206 | 83 |
| 520 S Rural St | 0.23mi | 2/1.0 | 720 (0%) | 8mo | $95,000 | $132 | 82 |
| 2219 Lexington Ave | 0.26mi | 2/1.0 | 717 (-0%) | 17mo | $178,366 | $249 | 73 |
| 618 S Temple Ave | 0.12mi | 2/1.0 | 672 (-7%) | 14mo | $137,000 | $204 | 72 |
| 2348 Hoyt Ave | 0.10mi | 2/1.0 | 748 (+4%) | 22mo | $150,000 | $201 | 71 |
| 237 S Keystone Ave | 0.36mi | 3/1.0 (+1) | 716 (-1%) | 21mo | $135,000 | $189 | 60 |
| 1456 Hoyt Ave | 0.71mi | 2/1.0 | 732 (+2%) | 14mo | $102,000 | $139 | 52 |
| 418 S Oxford St | 0.34mi | 2/1.0 | 816 (+13%) | 14mo | $151,000 | $185 | 51 |
| 239 S Temple Ave | 0.39mi | 3/1.0 (+1) | 768 (+7%) | 20mo | $110,000 | $143 | 49 |
| 1118 Churchman Ave | 0.51mi | 2/2.0 | 812 (+13%) | 7mo | $244,000 | $300 | 45 |
| 35 N Forest Ave | 0.71mi | 2/1.0 | 672 (-7%) | 18mo | $99,999 | $149 | 40 |
Match score weights: distance 35% · size 25% · config 20% · recency 20%. Top-matched comps best support the ARV.
Projected returns pro-forma
-3.0% appreciation · 2.88% rent growth · sell at horizon
- IRR
- 3.6%
- Equity multiple
- 1.14×
- Total profit
- $3,539
- Equity at exit
- $13,404
- IRR
- 13.0%
- Equity multiple
- 2.03×
- Total profit
- $25,966
- Equity at exit
- $7,773
Cash invested: $25,172 (down + closing). Projections, not guarantees.
Landlord ↔ Tenant lean methodology
- Overall (STATE)
- 90 Strongly Landlord-Friendly
- State Indiana
- 90 Strongly Landlord-Friendly · R+11
- County
- — inherits STATE
- City
- — inherits STATE
ZIP-level market 46203
- Home prices YoY
- -26.7%
- Rents YoY
- 2.9%
- Active inventory
- 493
- Price-to-rent
- 7.0×
Monthly cashflow live
- Estimated rent
- $1,064 high interval (Pro) →
- Mortgage (P&I)
- −$471
- Tax from tax record
- −$45 /mo · $542/yr
- Insurance
- −$37
- HOA
- −$0
- Vacancy / Maint / Mgmt
- −$224
- Net cashflow
- $287
Break-even live
UW: 25.0% down · 7.5% · 30yr · 1.5% tax · 5.0% vac · 8.0% maint · 8.0% mgmt
Financing live
Cash to close
- Down payment
- $22,475
- Closing costs
- $2,697
- Reserves months
- —
- Total cash needed
- —
Loan-product check · same deal, 3 products live
Conventional
25% down · 7.5% · 30yr
- Down + closing
- —
- Monthly P&I
- —
- Monthly cashflow
- —
- DSCR
- —
- Eligible?
- —
Personal DTI + credit; lowest rate.
DSCR
20% down · 8.5% · 30yr
- Down + closing
- —
- Monthly P&I
- —
- Monthly cashflow
- —
- DSCR
- —
- Eligible?
- —
No personal income docs; deal must DSCR.
Hard money
10% down · 12.0% · 12mo
- Down + closing
- —
- Monthly P&I
- —
- Monthly cashflow
- —
- DSCR
- —
- Eligible?
- —
Short-term bridge; refi at stabilization.
Rent comps 40 comps
| Address | Beds | Baths | Sqft | Rent | $/sqft | DOM | Units | Dist |
|---|---|---|---|---|---|---|---|---|
| 423 Villa Ave Indianapolis, IN | 1.0 | 1.0 | 593 | $799 | $1.35 | 23d | 1 | 0.34mi |
| 2025 Southeastern Ave Indianapolis, IN | 1.0 | 1.0 | 663 | $775 | $1.17 | 43d | 1 | 0.37mi |
| 2034 Southeastern Ave Indianapolis, IN | 1.0 | 1.0 | 525 | $850 | $1.62 | 14d | 1 | 0.38mi |
| 1912 Lexington Ave Unit 1910B Indianapolis, IN | 1.0 | 1.0 | 660 | $850 | $1.29 | 43d | 1 | 0.42mi |
| 3022 English Ave Unit 3022 Indianapolis, IN | 2.0 | 1.0 | 600 | $650 | $1.08 | 43d | 1 | 0.42mi |
| 1022 S Churchman Ave Unit 1024 Indianapolis, IN | 1.0 | 1.0 | 350 | $895 | $2.56 | 43d | 1 | 0.42mi |
| 247 S Randolph St Indianapolis, IN | 2.0 | 1.0 | 720 | $750 | $1.04 | 43d | 1 | 0.45mi |
| 245 S Randolph St Indianapolis, IN | 2.0 | 1.0 | 720 | $750 | $1.04 | 43d | 1 | 0.45mi |
| 815 Dawson St Unit 2 Indianapolis, IN | 2.0 | 1.0 | 600 | $1,300 | $2.17 | 4d | 1 | 0.50mi |
| 1718 Southeastern Ave Indianapolis, IN | 1.0 | 1.0 | 700 | $1,080 | $1.54 | 43d | 1 | 0.58mi |
| 49 S Rural St Indianapolis, IN | 2.0 | 1.5 | 750 | $950 | $1.27 | 10d | 1 | 0.60mi |
| 1023 S State Ave Indianapolis, IN | 1.0 | 1.0 | 600 | $1,099 | $1.83 | 23d | 1 | 0.63mi |
| 270 S Lasalle St Indianapolis, IN | 3.0 | 2.0 | 562 | $1,329 | $2.36 | 7d | 1 | 0.68mi |
| 1026 Laurel St Indianapolis, IN | 1.0 | 1.0 | 655 | $860 | $1.31 | 43d | 1 | 0.85mi |
| 2211 E New York St Unit B Indianapolis, IN | 1.0 | 1.0 | 650 | $725 | $1.12 | 22d | 1 | 0.85mi |
| 1441 Prospect St Indianapolis, IN | 2.0 | 1.0–2.0 | 2840 | $2,000 | $0.70 | 1d | 13 | 0.85mi |
| 1503 Dawson St Indianapolis, IN | 2.0 | 1.0 | 700 | $1,200 | $1.71 | 43d | 1 | 0.88mi |
| 1306 Woodlawn Ave Unit 1D Indianapolis, IN | 1.0 | 1.0 | 391 | $1,025 | $2.62 | 43d | 1 | 0.90mi |
| 1306 Woodlawn Ave Unit 1B Indianapolis, IN | 1.0 | 1.0 | 720 | $1,275 | $1.77 | 43d | 1 | 0.90mi |
| 1224 Prospect St Indianapolis, IN | 2.0 | 1.0–2.0 | 691 | $2,235 | $3.23 | 1d | 8 | 0.97mi |
| 1329 E Market St Unit 8 Indianapolis, IN | 1.0 | 1.0 | 480 | $945 | $1.97 | 22d | 1 | 0.99mi |
| 1640 Asbury St Indianapolis, IN | 1.0 | 1.0 | 700 | $850 | $1.21 | 43d | 1 | 1.04mi |
| 415 N Oxford St Indianapolis, IN | 1.0 | 1.0 | 580 | $650 | $1.12 | 23d | 1 | 1.05mi |
| 1727 S Randolph St Indianapolis, IN | 1.0 | 1.0 | 616 | $950 | $1.54 | 43d | 1 | 1.06mi |
| 330 N Arsenal Ave Unit B Indianapolis, IN | 2.0 | 1.0 | 700 | $1,100 | $1.57 | 7d | 1 | 1.08mi |
| 332 N Arsenal Ave Unit A Indianapolis, IN | 2.0 | 1.0 | 750 | $1,150 | $1.53 | 7d | 1 | 1.08mi |
| 1044 Shelby St Unit 205 CDBG 80% Indianapolis, IN | 1.0 | 1.0 | 579 | $650 | $1.12 | 17d | 1 | 1.10mi |
| 1117 E Market St Indianapolis, IN | 2.0 | 1.0–2.0 | 803 | $1,875 | $2.33 | 3d | 15 | 1.13mi |
| 471 N State Ave Unit 1 Indianapolis, IN | 1.0 | 1.0 | 634 | $785 | $1.24 | 43d | 1 | 1.15mi |
| 37 S Sherman Dr Indianapolis, IN | 1.0 | 1.0 | 700 | $800 | $1.14 | 23d | 1 | 1.19mi |
| 1515 E Michigan St Apt 2 Indianapolis, IN | 1.0 | 1.0 | 700 | $825 | $1.18 | 20d | 1 | 1.22mi |
| 621 Tecumseh St Indianapolis, IN | 2.0 | 1.0 | 726 | $1,025 | $1.41 | 43d | 1 | 1.27mi |
| 679 Woodruff Place East Dr Indianapolis, IN | 1.0 | 1.0 | 600 | $895 | $1.49 | 23d | 1 | 1.28mi |
| 628 N Oxford St Indianapolis, IN | 1.0 | 1.0 | 536 | $775 | $1.45 | 23d | 1 | 1.28mi |
| 718 E Georgia St Indianapolis, IN | 2.0 | 1.0–2.0 | 904 | $1,777 | $1.96 | 3d | 15 | 1.32mi |
| 1556 Shelby St Indianapolis, IN | 2.0 | 1.0 | 500 | $1,000 | $2.00 | 43d | 1 | 1.33mi |
| 1558 Shelby St Indianapolis, IN | 1.0 | 1.0 | 500 | $1,000 | $2.00 | 43d | 1 | 1.33mi |
| 520 Virginia Ave Apt 24 Indianapolis, IN | 1.0 | 1.0 | 665 | $1,575 | $2.37 | 23d | 1 | 1.38mi |
| 784 Woodruff Place Middle Dr Indianapolis, IN | 1.0 | 1.0 | 750 | $1,300 | $1.73 | 43d | 1 | 1.40mi |
| 531 Virginia Ave Indianapolis, IN | 1.0 | 1.0 | 642 | $1,384 | $2.16 | 7d | 4 | 1.41mi |
Listing history 7 events
-
2026-04-23status Pending
-
2026-03-31$89,900 Active
-
2012-08-22historical 87-char remark
Show marketing remark (87 chars)
Cute bungalow with decent sized yard. Much potential for right investor or fixer-upper.
-
2012-08-21soldstatus $11,000 87-char remark
Show marketing remark (87 chars)
Cute bungalow with decent sized yard. Much potential for right investor or fixer-upper.
-
2012-07-01$9,900 87-char remark
Show marketing remark (87 chars)
Cute bungalow with decent sized yard. Much potential for right investor or fixer-upper.
-
2005-10-19historical
-
2005-05-20$63,900
ⓘ Source: listings_history table (triggers on properties + properties_extension) + one-shot
backfill from property_details.listing_events for pre-trigger history.
Tax reassessment forecast IN · Partial reset (capped growth)
- Current annual tax
- $542 · $45/mo
- Projected year-2 tax
- $653 · $54/mo
- Expected delta
- +$111/yr (+$9/mo · 20.5%)
ⓘ Screening estimate from a state-policy table — verify with the county assessor before closing.
Climate risk First Street
- Flood 1/10 Low FEMA zone X (unshaded) · 0% chance over 30 yrs
- Wildfire 1/10 Low
- Heat 4/10 Moderate 7 d/yr ≥101°F today · 19 d/yr by 30 yrs out
- Wind 2/10 Low 0% chance of damaging wind over 30 yrs
- Air quality 4/10 Moderate 5 unhealthy d/yr today · 7 by 30 yrs out
Nearby sold comps map
Loading sold comps map…
Walkable amenities ~0.75 mi
Loading nearby amenities…
Taxation est. · year 1
- Rental income
- $12,771
- − Mortgage interest
- −$5,036
- − Property taxes
- −$542
- − Insurance
- −$450
- − Repairs & maintenance
- −$1,022
- − Management
- −$1,022
- − Depreciation
- −$2,615
- Taxable income
- $2,085
- Est. tax owed @ 24.0%
- −$500
- After-tax cash flow
- $2,940/yr
For passive investors: Depreciation is non-cash, so a rental often shows a tax loss while cash-flowing — sheltering income. Rental losses are passive: they offset passive income freely, and up to $25,000/yr can offset ordinary (W-2) income if you actively participate and your MAGI is under $100k (phasing out to $0 by $150k); unused losses carry forward. On sale, claimed depreciation is recaptured at up to 25%, and gains may owe capital-gains tax (a 1031 exchange can defer both). Figures are a year-1 estimate at your 24.0% rate — not tax advice; consult a CPA.
Schools (NCES district)
- District
- Indianapolis Public Schools
- NCES district ID
- 1804770
- Math proficiency
- 14% ▼ -7.00%
- Reading proficiency
- 20% ▼ -3.00%
- Median HH income
- $32,034
- Composite
- 13.69/100
- National rank
- #9499
- State rank
- #286 of 301 in IN
Livability — Indianapolis city (balance)
No livability data for this city. (Only ~50 U.S. cities are tracked.)
Census & demographics
- Census place
- Indianapolis city (balance), IN
- County
- Marion County · 998,460 people
- City population
- 881,119
- Metro
- Indianapolis-Carmel-Anderson, IN
- Population (ZIP)
- 37,758
- Household income
- $57,393
- Rent vs Own
- Severe rent burden
- 1499.0
Population outlook (Marion County) Hauer SSP2
- Today (2025)
- 1,025,572 people
- By 2030
- 1,065,727 · +3.9%
- By 2040
- 1,141,577 · +11.3%
- By 2050
- 1,208,920 · +17.9%
- By 2075
- 1,367,288 · +33.3%
- By 2100
- 1,438,201 · +40.2%
Race, ethnicity, and origin ACS 2023
- Neighborhood character
- Predominantly White (69%)
- Race & ethnicity
- White 69% Hispanic / Latino 14% Black 12% Two or more races 8% Asian 2% Native American 1%
- Hispanic origin (detail)
- Mexican 12% Puerto Rican 1%
- Common ancestry
- Slovak 2% Lithuanian 2% Italian 1%
- Foreign-born
- 8% · Canada
- Languages at home
- 88% English-only · Spanish 10% Other Indo-European 1%
Political lean MEDSL · Marion
- 2024 margin
- Strong D (+27.7) · D 63.0% · R 35.3% · Other 1.7%
- 2008→2024 swing
- -0.7pp no change · 2008: 28.4pp · 2024: 27.7pp
- All cycles
- 2024: D+27.7 2020: D+29.1 2016: D+22.8 2012: D+22.2 2008: D+28.4
Not yet ingested
- Civics
- —
Market trends
- HPI YoY
- ▼ -127.37%
- Current HPI
- 349.579
- Rent YoY
- ▲ 2.88%
- Metro
- Indianapolis-Carmel-Anderson, IN
- State GDP YoY
- ▲ 2.90%
- F500 in state
- 18
Industry mix (Fortune 500 HQ in IN)
| Industry | F500 HQs | Revenue |
|---|---|---|
| Industrial Machinery | 2 | $37B |
|
||
| Healthcare | 1 | $177B |
|
||
| Pharmaceuticals | 1 | $45B |
|
||
| Metals / Steel | 1 | $18B |
|
||
| Agriculture | 1 | $17B |
|
||
| Packaging | 1 | $12B |
|
||
Price history
+40.7% since first listed7 events — show timeline
- 2026-04-23 Pending — MIBOR as Distributed by MLS Grid
- 2026-03-31 Listed $89,900 MIBOR as Distributed by MLS Grid
- 2012-08-22 Listing Removed — MIBOR as Distributed by MLS Grid
- 2012-08-21 Sold (MLS) $11,000 MIBOR as Distributed by MLS Grid
- 2012-07-01 Listed $9,900 MIBOR as Distributed by MLS Grid
- 2005-10-19 Listing Removed — MIBOR as Distributed by MLS Grid
- 2005-05-20 Listed $63,900 MIBOR as Distributed by MLS Grid
Property tax history
+7.4%/yrLatest (2025): $542 · -2.7% YoY. Source: county tax records.
Cash-flow waterfall
monthlySold comps — $/sqft
last 12 mo · ≤1 miLoading sold comps…