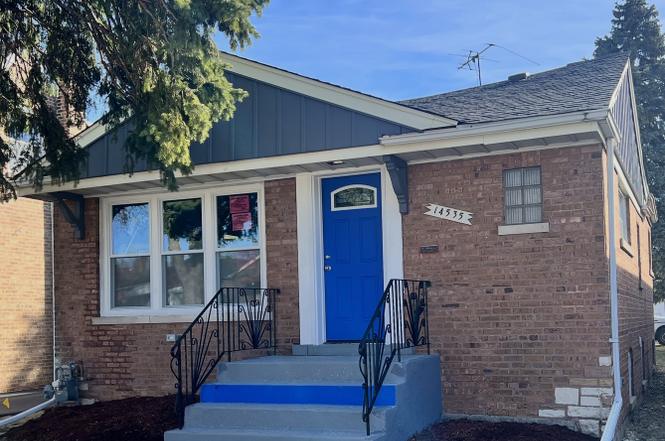
14535 S Parnell Ave · Riverdale, IL
Flood risk 1/10 · Minimal
- FEMA flood zone
- X (unshaded)
- Chance of flooding over 30 yrs
- 0.0%
- Est. flood insurance / yr
- $473 – $860
Fire risk 1/10 · Minimal
- Est. fire insurance / yr
- $804 – $1,492
Heat risk 3/10 · Minor
- Hot days now (above 101°F)
- 7 days/yr
- Hot days in 30 yrs
- 15 days/yr
Wind risk 2/10 · Minimal
- Chance of severe wind over 30 yrs
- —
Air-quality risk 4/10 · Minor
- Unhealthy air days now
- 4 days/yr
- Unhealthy air days in 30 yrs
- 5 days/yr
Risk factors via First Street. Map © Google.
Why this score? — see what drove the F grade
The composite is a weighted blend of 9 inputs, each scored 0–100. Each bar is that input's sub-score; the figure is the points it added to the 100-point composite (weight × sub-score).
- ARV discount +7.5/15.0
- Rent growth +4.5/5.0
- Livability +3.5/5.0
- Condition / age +2.5/5.0
- Cash flow +2.3/30.0
- 1% rule +0.9/10.0
- Schools +0.7/10.0
- DSCR +0.0/10.0
- Appreciation +0.0/10.0
$210,000
🖨 Deal sheet (PDF) 📄 Offer letter ✓ Due diligence
Listing remarks MLS
Rehabbers! Contractors! Solid 2-bedroom property needs to be fully rehabbed. Sold As-Is. Seller will remove car from garage.
Key facts
- New furnace
- Finished basement
- All brick home
Tags
Property features AI
Finance
- Other: School districts noted (district numbers provided); Commuter access: school bus service, commuter bus, commuter train, interstate access
- Financial info: Special service area: No
- HOA & community: No master association fee required; Community features include sidewalks, street lights, and paved streets
Exterior
- Parking: Detached garage, garage owned — total 2 parking spaces
- Utilities: Lake Michigan water; Public sewer; Electric with circuit breakers
- Home design: Detached single-family home; One-story (main living on single level) — with finished basement; Traditional style; Fee simple ownership; Rehab completed in 2026
- Construction: Brick construction; Asphalt roof; Concrete perimeter foundation; Built approximately 71–80 years ago; Property was built before 1978
- Exterior features: Sidewalks; Street lights; Paved streets; Lot dimensions approximately 29 x 125; Lot smaller than 0.25 acre
Interior
- Kitchen: Range; Microwave; Dishwasher; Refrigerator; Stainless steel appliances; Eating area / table space
- Bedrooms: Main-level master bedroom (approximately 11 x 12); Main-level bedroom (approximately 10 x 12); Two additional basement bedrooms (each approximately 12 x 12) — total 4 possible bedrooms, 2 below grade
- Flooring: Hardwood floors on main level; Other flooring in basement areas
- Bathrooms: 2 full bathrooms; Basement has bathroom access
- Heating & cooling: Natural gas heating
- Interior features: First-floor bedroom; Finished full basement; Separate dining room; 8 total rooms
- Laundry & utility: Basement laundry; Gas dryer hookup
Neighborhood map
What this means for you Summary
Snapshot
- This is a 2-bed/1.0-bath single-family listed at $210k.
Deal economics
- At list price, monthly cash flow is $-751 ($-9k/yr) — negative.
- To cash-flow at today's rent, offer at most $131k (37.6% below list).
- To meet the 1% rule (rent ≥ 1% of price), the offer needs to be $124k (40.7% below list).
- Recommended offer: $124k (40.7% below list) — sets the bar for 1% rule.
- Cap rate 2.0% vs local median 9.5% in Riverdale — below-typical yield; the buyer is paying a premium for something (appreciation thesis, condition, location) that the cap rate doesn't capture.
Location & tenants
- Location reads 69/100 on livability (#434 in IL) — a middle-class / working-renter tenant base. Strengths: commute A+, cost of living A+, housing A-; Watch: health & safety C-, crime F, amenities F.
- Thornton Twp Hsd 205 (suburban): math 7% / reading 8% proficiency, ranked #594 of 620 in IL (top 96%) — low school quality limits family demand, transient renter base, plan for 1-2y turnover.
- Zoned schools: Park Elementary School (205 students, 0% FRL); Washington Junior High (math 24% / reading 24%, grade F, #332 of 665 statewide, top 55%, 131 students, 0% FRL); Thornton Township High School (math 7% / reading 7%, grade F, #605 of 693 statewide, top 87%, 1,628 students, 0% FRL).
- Market conditions: Rents rising fast (+7.8%/yr); 77 active listings in the ZIP; 10 comparable units currently listed for rent nearby; rentals leasing fast (median 10d on market — plan ~1-2 weeks tenant-placement turnaround); lower-income renter base — watch delinquency; 6,272 units permitted in Cook County in 2024 (4,658 in 5+ unit buildings).
- This rent runs 40% of the median local income ($37k/yr) — at the standard rent-burdened threshold; future hikes will face affordability resistance.
Forward outlook
- Local home prices are declining (-3.0%/yr); year-one equity from $1k of loan paydown is wiped out by about $6k of value loss. Plan a longer hold.
Negotiation context
- It's been on market 51 days — a 3% lower offer ($204k) is reasonable based on typical stale-listing flexibility.
- 2 sale attempts; this cycle's ask has dropped $15k (7%) from the opening price — seller is motivated, your offer sets the floor, not the list.
- Current owner paid $60k; list at $210k implies a 250% gain — meaningful room to come down on a strong offer.
Risks & watch-outs
- Watch-outs: property tax is 3.1% of price; built in 1954 — expect roof / HVAC / electrical / plumbing capex.
Questions for the listing agent
- What do current leases actually rent for vs. the listed asking? Can we see a recent rent roll and the last 12 months of T-12 income?
- It's been on market 51 days. Have you received any prior offers? Is the seller open to a 41% concession, seller financing, or rate buy-down credit?
- Built in 1954 — when were the roof, HVAC, electrical panel, plumbing, and water heater last replaced?
- Property tax is high relative to price — has the assessment been appealed recently, and will the sale trigger a re-assessment?
- Is there a deadline driving the sale (1031 exchange, divorce, estate, relocation)? That informs how much negotiation room exists.
- Schools are F-rated, which usually means shorter tenancies and higher turnover. Who's the typical renter profile here, and what's been the actual vacancy rate?
- Crime grade is F in this area — have there been break-ins, vandalism, or insurance claims at this property in the last 3 years? What carrier currently insures it and at what premium?
- The area grade is low — what's the realistic commute time and amenity access for the typical tenant pool here? Any planned neighborhood developments (good or bad) we should know about?
- What's the average days-on-market for RENTAL listings here right now (not sales)? A rising rental-DOM trend means longer vacancies and softer asking-rent achievability than the comps imply.
- What's the recent tenant-quality profile in this submarket — average credit score on applications, eviction rate, late-payment / NSF rate, and stable-employment percentage? A property-management company in the area should have these aggregated.
- How much new for-sale + rental construction is in the pipeline within 1–3 miles? Heavy new supply typically softens prices + rents 12–24 months out; constrained supply supports both.
Investment metrics
- 1% rule
- 0.59% ✗
- Cap rate
- 2.00%
- Cash-on-cash
- -15.33%
- DSCR
- 0.32
- GRM
- 14.1
CMA / ARV
- ARV (on-the-fly)
- $127,680
- Comps found
- 12
Show comp detail 12 sales within ~0.75 mi
| Address | Dist | Beds/Ba | Sqft | Sold | Price | $/sf | Match |
|---|---|---|---|---|---|---|---|
| 14514 S Parnell Ave | 0.06mi | 2/1.0 | 890 (-2%) | 2mo | $123,000 | $138 | 91 |
| 14414 Parnell Ave | 0.18mi | 2/1.0 | 891 (-2%) | 5mo | $127,000 | $143 | 84 |
| 14320 Parnell Ave | 0.09mi | 3/2.0 (+1) | 912 (0%) | 5mo | $127,000 | $139 | 82 |
| 14528 S Eggleston Ave | 0.10mi | 2/1.0 | 968 (+6%) | 5mo | $123,649 | $128 | 81 |
| 319 E 145th St | 0.30mi | 2/1.0 | 960 (+5%) | 2mo | $49,900 | $52 | 76 |
| 14325 Park Ave | 0.12mi | 2/1.0 | 832 (-9%) | 6mo | $68,000 | $82 | 74 |
| 14220 S Eggleston Ave | 0.43mi | 2/2.0 | 912 (0%) | 3mo | $138,000 | $151 | 73 |
| 14301 Parnell Ave | 0.03mi | 3/2.0 (+1) | 1,008 (+10%) | 5mo | $217,000 | $215 | 68 |
| 14308 S Tracy Ave | 0.39mi | 3/2.0 (+1) | 914 (+0%) | 5mo | $128,229 | $140 | 68 |
| 14309 S La Salle St | 0.60mi | 2/1.5 | 964 (+6%) | 6mo | $67,000 | $70 | 55 |
| 14455 Des Plaines St | 0.31mi | 3/1.0 (+1) | 1,035 (+14%) | 4mo | $155,000 | $150 | 55 |
| 14811 Perry Ave | 0.75mi | 3/1.0 (+1) | 975 (+7%) | 5mo | $160,000 | $164 | 44 |
Match score weights: distance 35% · size 25% · config 20% · recency 20%. Top-matched comps best support the ARV.
Projected returns pro-forma
-3.0% appreciation · 7.82% rent growth · sell at horizon
- IRR
- -39.1%
- Equity multiple
- -0.28×
- Total profit
- $-75,348
- Equity at exit
- $31,312
- IRR
- -29.3%
- Equity multiple
- -0.66×
- Total profit
- $-97,729
- Equity at exit
- $18,157
Cash invested: $58,800 (down + closing). Projections, not guarantees.
Landlord ↔ Tenant lean methodology
- Overall (STATE)
- 43 Moderately Tenant-Leaning
- State Illinois
- 43 Moderately Tenant-Leaning · D+7
- County
- — inherits STATE
- City
- — inherits STATE
ZIP-level market 60827
- Home prices YoY
- -31.8%
- Rents YoY
- 7.8%
- Active inventory
- 77
- Price-to-rent
- 14.1×
Monthly cashflow live
- Estimated rent
- $1,245 high interval (Pro) →
- Mortgage (P&I)
- −$1,101
- Tax from tax record
- −$546 /mo · $6,550/yr
- Insurance
- −$88
- HOA
- −$0
- Vacancy / Maint / Mgmt
- −$261
- Net cashflow
- $-751
Break-even live
Sensitivity live
| Price | -10% $-632 | -5% $-692 | +0% $-751 | +5% $-811 | +10% $-870 |
|---|---|---|---|---|---|
| Rent | -10% $-850 | -5% $-800 | +0% $-751 | +5% $-702 | +10% $-653 |
| Rate | -1.0pp $-645 | -0.5pp $-698 | base $-751 | +0.5pp $-806 | +1.0pp $-861 |
UW: 25.0% down · 7.5% · 30yr · 1.5% tax · 5.0% vac · 8.0% maint · 8.0% mgmt
Financing live
Cash to close
- Down payment
- $52,500
- Closing costs
- $6,300
- Reserves months
- —
- Total cash needed
- —
Loan-product check · same deal, 3 products live
Conventional
25% down · 7.5% · 30yr
- Down + closing
- —
- Monthly P&I
- —
- Monthly cashflow
- —
- DSCR
- —
- Eligible?
- —
Personal DTI + credit; lowest rate.
DSCR
20% down · 8.5% · 30yr
- Down + closing
- —
- Monthly P&I
- —
- Monthly cashflow
- —
- DSCR
- —
- Eligible?
- —
No personal income docs; deal must DSCR.
Hard money
10% down · 12.0% · 12mo
- Down + closing
- —
- Monthly P&I
- —
- Monthly cashflow
- —
- DSCR
- —
- Eligible?
- —
Short-term bridge; refi at stabilization.
Rent comps 10 comps
| Address | Beds | Baths | Sqft | Rent | $/sqft | DOM | Units | Dist |
|---|---|---|---|---|---|---|---|---|
| 455 W 144th St Unit 2W Riverdale, IL | 1.0 | 1.0 | 750 | $1,250 | $1.67 | 0d | 1 | 0.27mi |
| 14119 S Tracy Ave Riverdale, IL | 2.0 | 1.0 | 696 | $1,205 | $1.73 | 5d | 1 | 0.62mi |
| 14132 S Atlantic Ave Riverdale, IL | 1.0 | 1.0 | 900 | $1,150 | $1.28 | 26d | 1 | 0.63mi |
| 14101 S Atlantic Ave Riverdale, IL | 2.0 | 1.0 | 790 | $1,140 | $1.44 | 9d | 1 | 0.70mi |
| 14015 S Stewart Ave Unit 2W Riverdale, IL | 2.0 | 1.0 | 800 | $1,400 | $1.75 | 26d | 1 | 0.72mi |
| 14031 S School St Riverdale, IL | 1.0 | 1.0 | 620 | $1,045 | $1.69 | 5d | 1 | 0.73mi |
| 13905 S Clark St Riverdale, IL | 1.0 | 1.0 | 685 | $1,210 | $1.77 | 9d | 6 | 1.01mi |
| 724 W 138th St Unit 3 Riverdale, IL | 2.0 | 1.0 | 800 | $1,250 | $1.56 | 20d | 1 | 1.01mi |
| 13810 S La Salle St #1 Riverdale, IL | 3.0 | 1.0 | 800 | $1,550 | $1.94 | 4d | 1 | 1.07mi |
| 13604 S Wentworth Ave Riverdale, IL | 3.0 | 1.0 | 1100 | $1,200 | $1.09 | 26d | 1 | 1.28mi |
Listing history 7 events
-
2026-04-29status Pending
-
2026-04-12price $210,000
-
2026-03-09$225,000 Active
-
2025-10-01soldstatus $60,000 Closed 124-char remark
Show marketing remark (124 chars)
Rehabbers! Contractors! Solid 2-bedroom property needs to be fully rehabbed. Sold As-Is. Seller will remove car from garage.
-
2025-09-29soldstatus $60,000
-
2025-08-18historical Contingent - No Showings 124-char remark
Show marketing remark (124 chars)
Rehabbers! Contractors! Solid 2-bedroom property needs to be fully rehabbed. Sold As-Is. Seller will remove car from garage.
-
2025-07-28$74,900 Active 124-char remark
Show marketing remark (124 chars)
Rehabbers! Contractors! Solid 2-bedroom property needs to be fully rehabbed. Sold As-Is. Seller will remove car from garage.
ⓘ Source: listings_history table (triggers on properties + properties_extension) + one-shot
backfill from property_details.listing_events for pre-trigger history.
Tax reassessment forecast IL · Partial reset (capped growth)
- Current annual tax
- $6,550 · $546/mo
- Projected year-2 tax
- $6,550 · $546/mo
- Expected delta
- $0/yr ($0/mo · 0.0%)
ⓘ Screening estimate from a state-policy table — verify with the county assessor before closing.
Climate risk First Street
- Flood 1/10 Low FEMA zone X (unshaded) · 0% chance over 30 yrs
- Wildfire 1/10 Low
- Heat 3/10 Moderate 7 d/yr ≥101°F today · 15 d/yr by 30 yrs out
- Wind 2/10 Low
- Air quality 4/10 Moderate 4 unhealthy d/yr today · 5 by 30 yrs out
Nearby sold comps map
Loading sold comps map…
Walkable amenities ~0.75 mi
Loading nearby amenities…
Taxation est. · year 1
- Rental income
- $14,938
- − Mortgage interest
- −$11,763
- − Property taxes
- −$6,550
- − Insurance
- −$1,050
- − Repairs & maintenance
- −$1,195
- − Management
- −$1,195
- − Depreciation
- −$6,109
- Taxable loss
- −$12,924
- Est. tax savings @ 24.0%
- +$3,102
- After-tax cash flow
- $-5,912/yr
For passive investors: Depreciation is non-cash, so a rental often shows a tax loss while cash-flowing — sheltering income. Rental losses are passive: they offset passive income freely, and up to $25,000/yr can offset ordinary (W-2) income if you actively participate and your MAGI is under $100k (phasing out to $0 by $150k); unused losses carry forward. On sale, claimed depreciation is recaptured at up to 25%, and gains may owe capital-gains tax (a 1031 exchange can defer both). Figures are a year-1 estimate at your 24.0% rate — not tax advice; consult a CPA.
Schools (NCES district)
- District
- Thornton Twp Hsd 205
- NCES district ID
- 1738970
- Math proficiency
- 7% ▬ 0.00%
- Reading proficiency
- 8% ▼ -2.00%
- Median HH income
- $43,392
- Composite
- 6.92/100
- National rank
- #9976
- State rank
- #594 of 620 in IL
Livability — Riverdale
- Score
- 69/100
- State rank
- #434
- US rank
- #8867
Category grades
Schools grade is shown separately in the Schools card above.
Census & demographics
- Census place
- Riverdale, IL
- County
- Cook County · 4,486,803 people
- City population
- 24,713
- Metro
- Chicago-Naperville-Elgin, IL-IN-WI
- Population (ZIP)
- 24,713
- Household income
- $37,217
- Rent vs Own
- Severe rent burden
- 1868.0
Population outlook (Cook County) Hauer SSP2
- Today (2025)
- 5,347,519 people
- By 2030
- 5,357,703 · +0.2%
- By 2040
- 5,324,924 · -0.4%
- By 2050
- 5,230,762 · -2.2%
- By 2075
- 4,785,735 · -10.5%
- By 2100
- 4,188,836 · -21.7%
Race, ethnicity, and origin ACS 2023
- Neighborhood character
- Predominantly Black (88%)
- Race & ethnicity
- Black 88% Two or more races 5% Hispanic / Latino 5% White 2%
- Common ancestry
- Iranian 1%
- Foreign-born
- 2% · Canada
- Languages at home
- 96% English-only · Spanish 3%
Political lean MEDSL · Cook
- 2024 margin
- Solid D (+42.0) · D 70.4% · R 28.4% · Other 1.2%
- 2008→2024 swing
- -11.4pp toward R · 2008: 53.4pp · 2024: 42.0pp
- All cycles
- 2024: D+42.0 2020: D+50.3 2016: D+53.0 2012: D+49.4 2008: D+53.4
Not yet ingested
- Civics
- —
Market trends
- HPI YoY
- ▼ -76.39%
- Current HPI
- 163.7725
- Rent YoY
- ▲ 7.82%
- Metro
- Chicago-Naperville-Elgin, IL-IN-WI
- State GDP YoY
- ▲ 1.59%
- F500 in state
- 60
Industry mix (Fortune 500 HQ in IL)
| Industry | F500 HQs | Revenue |
|---|---|---|
| Insurance | 4 | $201B |
|
||
| Consumer Goods | 4 | $87B |
|
||
| Industrial Machinery | 3 | $64B |
|
||
| Healthcare | 2 | $55B |
|
||
| Retail / Pharmacy | 1 | $148B |
|
||
| Agriculture / Food | 1 | $86B |
|
||
Price history
+180.4% since first listed7 events — show timeline
- 2026-04-29 Pending — MRED as Distributed by MLS Grid
- 2026-04-12 Price Changed $210,000 MRED as Distributed by MLS Grid
- 2026-03-09 Listed $225,000 MRED as Distributed by MLS Grid
- 2025-10-01 Sold (MLS) $60,000 MRED as Distributed by MLS Grid
- 2025-09-29 Sold (Public Records) $60,000 Public Records
- 2025-08-18 Contingent — MRED as Distributed by MLS Grid
- 2025-07-28 Listed $74,900 MRED as Distributed by MLS Grid
Property tax history
+16.5%/yrLatest (2023): $6,550 · +21.4% YoY. Source: county tax records.
Cash-flow waterfall
monthlySold comps — $/sqft
last 12 mo · ≤1 miLoading sold comps…