31 W Fairview Ave · Northville, NY
Flood risk 1/10 · Minimal
- FEMA flood zone
- X (unshaded)
- Chance of flooding over 30 yrs
- 0.0%
- Est. flood insurance / yr
- $473 – $860
Fire risk 3/10 · Minor
- Est. fire insurance / yr
- $691 – $1,283
Heat risk 4/10 · Minor
- Hot days now (above 92°F)
- 6 days/yr
- Hot days in 30 yrs
- 16 days/yr
Wind risk 8/10 · Major
- Chance of severe wind over 30 yrs
- 80.0%
Air-quality risk 3/10 · Minor
- Unhealthy air days now
- 2 days/yr
- Unhealthy air days in 30 yrs
- 4 days/yr
Risk factors via First Street. Map © Google.
Why this score? — see what drove the B+ grade
The composite is a weighted blend of 9 inputs, each scored 0–100. Each bar is that input's sub-score; the figure is the points it added to the 100-point composite (weight × sub-score).
- Cash flow +30.0/30.0
- ARV discount +15.0/15.0
- 1% rule +10.0/10.0
- DSCR +10.0/10.0
- Schools +3.6/10.0
- Livability +3.2/5.0
- Rent growth +2.5/5.0
- Condition / age +2.5/5.0
- Appreciation +0.0/10.0
$998,000
🖨 Deal sheet 📄 Offer letter ✓ Due diligence
Listing remarks
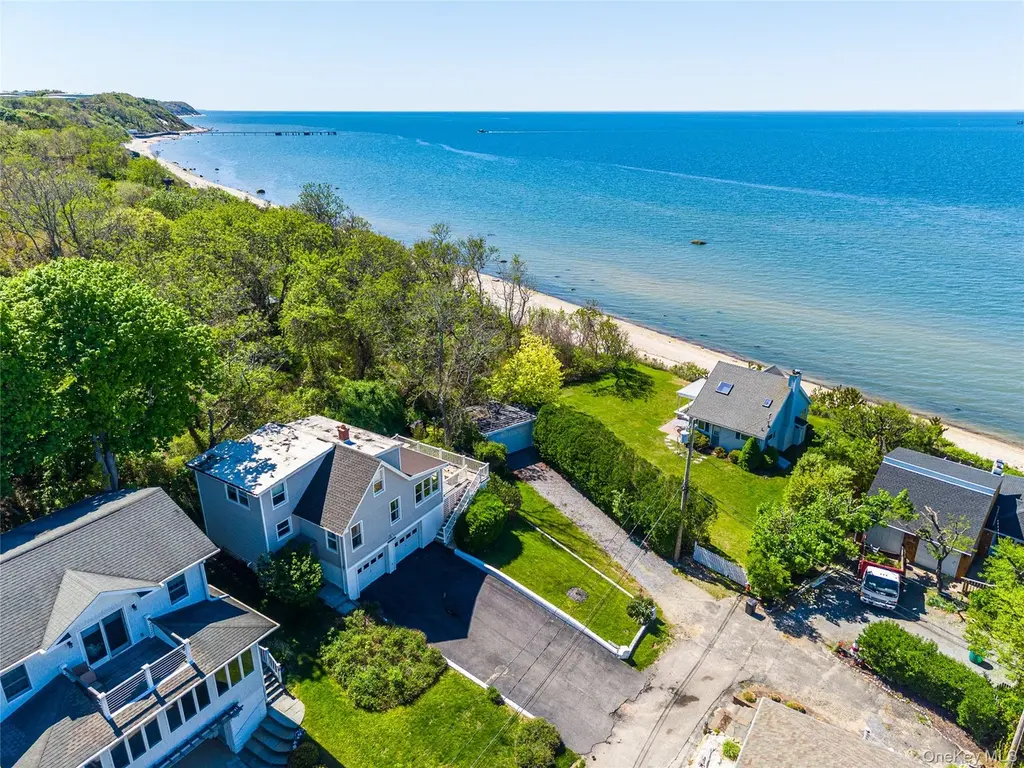
Nestled on the serene North Fork of Long Island, this fantastic, well maintained beach home offers an effortless blend of coastal charm and easy living. The property boasts a rare private beach and wonderful panoramic water views. Airy living spaces capture the beauty of the Long Island Sound. Whether enjoying a quiet morning with coffee on the deck overlooking the sparkling sound or hosting the most beautiful sunset gatherings, this home is a true sanctuary where relaxation and natural beauty come together. Enjoy the beach, wineries, restaurants and everything the North Fork has to offer. Your next home!!
Key facts
- Private beach
- 7,405 sq ft lot
- 2 garage spots
Tags
Property features AI
Exterior
- Parking: Driveway; Heated garage; 6 total parking spaces; 2-car garage
- Utilities: PSEG electric; Propane; Cesspool sewer; Public water available and connected; Electricity available and connected; Cable available; Phone available; Trash collection (public)
- Home design: Single family residence; Actual property condition
- Construction: Frame construction; Vinyl siding; Partial attic; No basement; Built/recorded living area per public records
- Exterior features: Back yard; Front yard; Wooded views
Interior
- Kitchen: Dishwasher; Oven; Range; Refrigerator
- Bedrooms: Includes a first-floor bedroom
- Flooring: Carpet; Ceramic tile; Hardwood
- Bathrooms: 2 full bathrooms
- Heating & cooling: Forced air heating (propane); Central air conditioning
- Interior features: First-floor bedroom; First-floor full bathroom; Ceiling fans; Open floor plan; Open kitchen; New windows; Deck
- Laundry & utility: Washer hookup; Electric dryer hookup; Dryer
Neighborhood map
What this means for you Summary
Snapshot
- This is a 4-bed/2.0-bath single-family listed at $998k.
Deal economics
- At list price, monthly cash flow is $6k ($67k/yr) — positive.
- The deal already cash-flows at list — no discount required.
- Meets the 1% rule at list price ($15k rent vs $998k).
- Recommended offer: $983k (1.5% below list) — sets the bar for market timing.
Location & tenants
- Location reads 64/100 on livability (#759 in NY) — a middle-class / working-renter tenant base. Strengths: crime A+, employment A+, housing A; Watch: amenities F, commute F, cost of living F.
- Riverhead Central School District (suburban): math 34% / reading 48% proficiency, ranked #489 of 590 in NY (top 83%) — families likely to look elsewhere, expect single-tenant / working-renter base with shorter leases.
- Zoned schools: Aquebogue Elementary School (math 47% / reading 57%, grade C-, #988 of 2,108 statewide, top 49%, 474 students, 40% FRL); Riverhead Middle School (math 18% / reading 35%, grade F, #594 of 729 statewide, top 81%, 827 students, 57% FRL); Riverhead Senior High School (math 80% / reading 86%, grade A, #440 of 1,100 statewide, top 40%, 2,001 students, 52% FRL).
- Zoned-school proficiency averages 54% at this address vs 41% district-wide (+13 pts) — the actual schools serving this property are materially stronger than the Riverhead Central School District average implies; a family-tenant draw the district grade alone would hide.
- Market conditions: 188 active listings in the ZIP; 1 comparable units currently listed for rent nearby; 1,366 units permitted in Suffolk County in 2024 (216 in 5+ unit buildings).
Forward outlook
- Local home prices are declining (-3.0%/yr); year-one equity from $7k of loan paydown is wiped out by about $30k of value loss. Plan a longer hold.
- Suffolk County population projected to shrink 5% by 2050 — rents likely to lag national; underwrite the cash flow, not the appreciation.
- At projected returns (-3.0% appreciation + 3.0% rent growth), your $279k cash investment doubles in ~6 years — after that, you're playing with house money.
Negotiation context
- It's been on market 21 days — a 2% lower offer ($983k) is reasonable based on typical stale-listing flexibility.
- 2 sale attempts with the ask held roughly flat each time — persistent listings suggest the price (not the market) is what's stuck; bring a comps-based counter.
- Current owner paid $155k; list at $998k implies a 544% gain — meaningful room to come down on a strong offer.
Risks & watch-outs
- Watch-outs: built in 1939 — expect roof / HVAC / electrical / plumbing capex.
- Climate carrying-cost: severe wind risk, 80% chance of damaging wind over 30y — expect insurance premiums to compound above CPI over the hold.
Questions for the listing agent
- Built in 1939 — when were the roof, HVAC, electrical panel, plumbing, and water heater last replaced?
- Is there a deadline driving the sale (1031 exchange, divorce, estate, relocation)? That informs how much negotiation room exists.
- Schools are B-rated — typically a magnet for longer-tenancy family renters. What's the average tenant stay here, and is there a school-zone premium baked into asking?
- What's the average days-on-market for RENTAL listings here right now (not sales)? A rising rental-DOM trend means longer vacancies and softer asking-rent achievability than the comps imply.
- What's the recent tenant-quality profile in this submarket — average credit score on applications, eviction rate, late-payment / NSF rate, and stable-employment percentage? A property-management company in the area should have these aggregated.
- How much new for-sale + rental construction is in the pipeline within 1–3 miles? Heavy new supply typically softens prices + rents 12–24 months out; constrained supply supports both.
Investment metrics
- 1% rule
- 1.50% ✓
- Cap rate
- 12.96%
- Cash-on-cash
- 23.80%
- DSCR
- 2.06
- GRM
- 5.5
CMA / ARV
- ARV (median comp)
- $1,365,387
- List price
- $998,000
- Delta
- -26.91%
- Verdict
- UNDERPRICED
- Comps
- 2 within 1.0 mi
Show comp detail 1 sale within ~0.75 mi
| Address | Dist | Beds/Ba | Sqft | Sold | Price | $/sf | Match |
|---|---|---|---|---|---|---|---|
| 18 N Walk | 0.04mi | 3/2.0 (-1) | 1,350 (0%) | 3mo | $1,240,000 | $919 | 90 |
Match score weights: distance 35% · size 25% · config 20% · recency 20%. Top-matched comps best support the ARV.
Projected returns pro-forma
-3.0% appreciation · 3.0% rent growth · sell at horizon
- IRR
- 17.0%
- Equity multiple
- 1.68×
- Total profit
- $191,189
- Equity at exit
- $148,805
- IRR
- 25.5%
- Equity multiple
- 3.22×
- Total profit
- $620,532
- Equity at exit
- $86,289
Cash invested: $279,440 (down + closing). Projections, not guarantees.
Landlord ↔ Tenant lean methodology
- Overall (STATE)
- 15 Strongly Tenant-Friendly
- State New York
- 15 Strongly Tenant-Friendly · D+10
- County
- — inherits STATE
- City
- — inherits STATE
ZIP-level market 11901
- Home prices YoY
- -29.5%
- Active inventory
- 188
- Price-to-rent
- 5.5×
Monthly cashflow live
- Estimated rent
- $15,000 medium interval (Pro) →
- Mortgage (P&I)
- −$5,234
- Tax from tax record
- −$657 /mo · $7,889/yr
- Insurance
- −$416
- HOA
- −$0
- Vacancy / Maint / Mgmt
- −$3,150
- Net cashflow
- $5,543
Break-even live
UW: 25.0% down · 7.5% · 30yr · 1.5% tax · 5.0% vac · 8.0% maint · 8.0% mgmt
Financing live
Cash to close
- Down payment
- $249,500
- Closing costs
- $29,940
- Reserves months
- —
- Total cash needed
- —
Loan-product check · same deal, 3 products live
Conventional
25% down · 7.5% · 30yr
- Down + closing
- —
- Monthly P&I
- —
- Monthly cashflow
- —
- DSCR
- —
- Eligible?
- —
Personal DTI + credit; lowest rate.
DSCR
20% down · 8.5% · 30yr
- Down + closing
- —
- Monthly P&I
- —
- Monthly cashflow
- —
- DSCR
- —
- Eligible?
- —
No personal income docs; deal must DSCR.
Hard money
10% down · 12.0% · 12mo
- Down + closing
- —
- Monthly P&I
- —
- Monthly cashflow
- —
- DSCR
- —
- Eligible?
- —
Short-term bridge; refi at stabilization.
Rent comps 1 comps
| Address | Beds | Baths | Sqft | Rent | $/sqft | DOM | Units | Dist |
|---|---|---|---|---|---|---|---|---|
| 21 North Walk Aquebogue, NY | 4.0 | 1.5 | 975 | $15,000 | $15.38 | 24d | 1 | 0.06mi |
Listing history 9 events
-
2026-06-04statusdays on market $998,000 Pending 21 DOM
-
2026-06-03days on market $998,000 Active 20 DOM
-
2026-06-02days on market $998,000 Active 19 DOM
-
2026-06-01days on market $998,000 Active 18 DOM
-
2026-05-31days on market $998,000 Active 17 DOM
-
2026-05-14$998,000 Active 618-char remark
-
2026-05-13historical
-
2026-04-06$1,049,000 Active
-
1995-01-25soldstatus $155,000
ⓘ Source: listings_history table (triggers on properties + properties_extension) + one-shot
backfill from property_details.listing_events for pre-trigger history.
Tax reassessment forecast NY · Partial reset (capped growth)
- Current annual tax
- $7,889 · $657/mo
- Projected year-2 tax
- $12,378 · $1,031/mo
- Expected delta
- +$4,489/yr (+$374/mo · 56.9%)
ⓘ Screening estimate from a state-policy table — verify with the county assessor before closing.
Climate risk First Street
- Flood 1/10 Low FEMA zone X (unshaded) · 0% chance over 30 yrs
- Wildfire 3/10 Moderate
- Heat 4/10 Moderate 6 d/yr ≥92°F today · 16 d/yr by 30 yrs out
- Wind 8/10 Severe 80% chance of damaging wind over 30 yrs
- Air quality 3/10 Moderate 2 unhealthy d/yr today · 4 by 30 yrs out
Nearby sold comps map
Loading sold comps map…
Walkable amenities ~0.75 mi
Loading nearby amenities…
Taxation est. · year 1
- Rental income
- $180,000
- − Mortgage interest
- −$55,904
- − Property taxes
- −$7,889
- − Insurance
- −$4,990
- − Repairs & maintenance
- −$14,400
- − Management
- −$14,400
- − Depreciation
- −$29,033
- Taxable income
- $53,385
- Est. tax owed @ 24.0%
- −$12,812
- After-tax cash flow
- $53,705/yr
For passive investors: Depreciation is non-cash, so a rental often shows a tax loss while cash-flowing — sheltering income. Rental losses are passive: they offset passive income freely, and up to $25,000/yr can offset ordinary (W-2) income if you actively participate and your MAGI is under $100k (phasing out to $0 by $150k); unused losses carry forward. On sale, claimed depreciation is recaptured at up to 25%, and gains may owe capital-gains tax (a 1031 exchange can defer both). Figures are a year-1 estimate at your 24.0% rate — not tax advice; consult a CPA.
Schools (NCES district)
- District
- Riverhead Central School District
- NCES district ID
- 3624690
- Math proficiency
- 34% ▼ -4.00%
- Reading proficiency
- 48% ▲ 13.00%
- Median HH income
- $61,607
- Composite
- 36.38/100
- National rank
- #4683
- State rank
- #489 of 590 in NY
Livability — Northville
- Score
- 64/100
- State rank
- #759
- US rank
- #14567
Category grades
Schools grade is shown separately in the Schools card above.
Census & demographics
- Census place
- Northville, NY
- Population (ZIP)
- 32,921
Population outlook (Suffolk County) Hauer SSP2
- Today (2025)
- 1,505,262 people
- By 2030
- 1,498,318 · -0.5%
- By 2040
- 1,471,101 · -2.3%
- By 2050
- 1,424,848 · -5.3%
- By 2075
- 1,337,157 · -11.2%
- By 2100
- 1,217,720 · -19.1%
Race, ethnicity, and origin ACS 2023
- Neighborhood character
- Diverse neighborhood (Simpson 0.63)
- Race & ethnicity
- White 52% Hispanic / Latino 29% Two or more races 14% Black 11% Asian 3%
- Hispanic origin (detail)
- Mexican 4%
- Common ancestry
- Romanian 8% Iranian 1% Portuguese 1%
- Foreign-born
- 25% · Canada, Jamaica
- Languages at home
- 68% English-only · Spanish 26% Other Indo-European 3% Russian/Polish/Slavic 2%
Political lean MEDSL · Suffolk
- 2024 margin
- Lean R (+10.0) · D 45.0% · R 55.0%
- 2008→2024 swing
- -16.0pp toward R · 2008: 6.0pp · 2024: -10.0pp
- All cycles
- 2024: R+10.0 2020: R+0.0 2016: R+8.2 2012: D+2.9 2008: D+6.0
Not yet ingested
- Civics
- —
Market trends
- HPI YoY
- ▼ -182.60%
- Current HPI
- 436.7781
- Rent YoY
- —
- Metro
- —
- State GDP YoY
- ▲ 2.60%
- F500 in state
- 92
Industry mix (Fortune 500 HQ in NY)
| Industry | F500 HQs | Revenue |
|---|---|---|
| Financial Services | 10 | $950B |
|
||
| Consumer Goods | 9 | $162B |
|
||
| Insurance | 4 | $225B |
|
||
| Telecommunications | 2 | $144B |
|
||
| Pharmaceuticals | 2 | $112B |
|
||
| Media / Entertainment | 2 | $69B |
|
||
Price history
+543.9% since first listed5 events — show timeline
- 2026-06-04 Pending — OneKey® MLS as Distributed by MLS Grid
- 2026-05-14 Listed $998,000 OneKey® MLS as Distributed by MLS Grid
- 2026-05-13 Listing Removed — OneKey® MLS as Distributed by MLS Grid
- 2026-04-06 Listed $1,049,000 OneKey® MLS as Distributed by MLS Grid
- 1995-01-25 Sold (Public Records) $155,000 Public Records
Property tax history
+2.3%/yrLatest (2025): $7,889 · +0.0% YoY. Source: county tax records.
Cash-flow waterfall
monthlySold comps — $/sqft
last 12 mo · ≤1 miLoading sold comps…