11216 Scotchwood Dr · Riverview, FL
Flood risk 1/10 · Minimal
- FEMA flood zone
- X (unshaded)
- Chance of flooding over 30 yrs
- 0.0%
- Est. flood insurance / yr
- $507 – $1,088
Fire risk 4/10 · Minor
- Est. fire insurance / yr
- $947 – $1,759
Heat risk 10/10 · Severe
- Hot days now (above 109°F)
- 7 days/yr
- Hot days in 30 yrs
- 27 days/yr
Wind risk 9/10 · Severe
- Chance of severe wind over 30 yrs
- 99.0%
Air-quality risk 3/10 · Minor
- Unhealthy air days now
- 3 days/yr
- Unhealthy air days in 30 yrs
- 3 days/yr
Risk factors via First Street. Map © Google.
Why this score? — see what drove the D grade
The composite is a weighted blend of 9 inputs, each scored 0–100. Each bar is that input's sub-score; the figure is the points it added to the 100-point composite (weight × sub-score).
- Cash flow +10.1/30.0
- ARV discount +7.5/15.0
- Appreciation +4.3/10.0
- Schools +4.2/10.0
- Livability +4.0/5.0
- DSCR +2.9/10.0
- Rent growth +2.8/5.0
- Condition / age +2.5/5.0
- 1% rule +2.2/10.0
$365,000
🖨 Deal sheet (PDF) 📄 Offer letter ✓ Due diligence
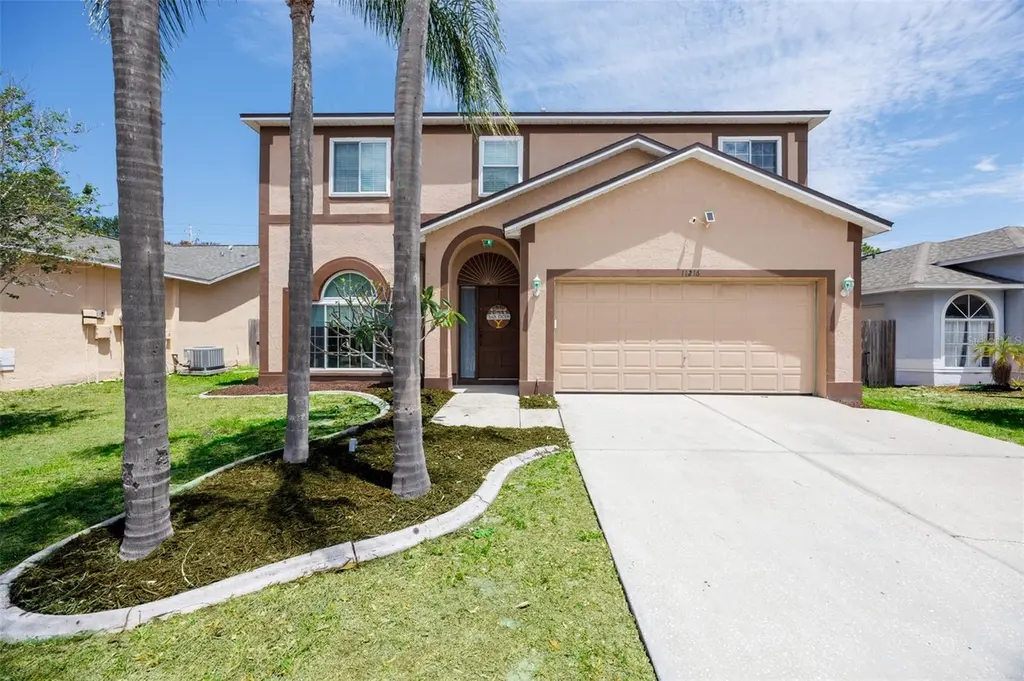
Listing remarks
Under contract-accepting backup offers. One or more photo(s) has been virtually staged. Welcome to this beautifully maintained 3-bedroom, 2.5-bathroom home with a 2-car garage located in the established Summerfield community in Riverview. This home offers a functional layout with an upstairs bonus room, perfect for a home office, playroom, or additional living space. Inside, you'll find thoughtful updates throughout, including cherry laminate flooring (2016), Luxury vinyl plank on the second floor and stairs (2020) and a fully updated kitchen (2019) with QUARTZ countertops, soft-closing wood cabinets, tile backsplash and newer appliances: new refrigerator (2025), dishwasher (2018) and micro
Key facts
- Quartz countertops
- Upstairs bonus room
- Tile backsplash
Tags
Property features AI
Finance
- Other: Homestead exempt; Zoned PD
- HOA & community: Part of Summerfield community; Quarterly association fee ($141); Monthly HOA amount $47 (equivalent); Community clubhouse, pool, playground, tennis courts, basketball and pickleball courts; Pets allowed
Exterior
- Parking: Driveway; Attached 2-car garage
- Utilities: Public water; Public sewer; Public utilities
- Home design: Single family residence; Two levels; Faces south
- Construction: Block and stucco construction; Shingle roof; Slab foundation; Built using masonry and wood fencing
- Exterior features: Sidewalk; Paved lot; Mature landscaping with trees
Interior
- Kitchen: Dishwasher; Microwave; Range; Refrigerator; Stone counters
- Bedrooms: 3 bedrooms
- Flooring: Laminate; Tile
- Bathrooms: 2 full bathrooms; 1 half bathroom
- Heating & cooling: Central heating; Central air conditioning
- Interior features: Stone counters; Walk-in closets; Double-pane windows; Bonus room
- Laundry & utility: Washer; Dryer; Inside laundry room (upper level)
Neighborhood map
What this means for you Summary
Snapshot
- This is a 3-bed/3.0-bath single-family listed at $365k.
Deal economics
- At list price, monthly cash flow is $-213 ($-3k/yr) — negative.
- To cash-flow at today's rent, offer at most $327k (10.3% below list).
- To meet the 1% rule (rent ≥ 1% of price), the offer needs to be $264k (27.6% below list).
- Recommended offer: $264k (27.6% below list) — sets the bar for 1% rule.
Location & tenants
- Location reads 79/100 on livability (#134 in FL, #2,000 nationally) — a middle-class / working-renter tenant base. Strengths: housing A+, health & safety A+, employment B+; Watch: amenities F.
- Hillsborough (suburban): math 47% / reading 50% proficiency, ranked #41 of 73 in FL (top 56%) — families likely to look elsewhere, expect single-tenant / working-renter base with shorter leases.
- Zoned schools: Summerfield Crossings Elementary School (math 43% / reading 45%, grade F, #1,330 of 2,144 statewide, top 63%, 869 students, 53% FRL); East Bay High School (math 24% / reading 35%, grade F, #447 of 667 statewide, top 68%, 1,995 students, 51% FRL) — zoned schools at 52% FRL track the district average.
- Market conditions: Rents rising (+1.2%/yr); 463 active listings in the ZIP; 40 comparable units currently listed for rent nearby; rentals at typical pace (median 15d on market — plan ~3-4 weeks tenant-placement turnaround); high-income renter base; 9,053 units permitted in Hillsborough County in 2024 (4,555 in 5+ unit buildings).
Forward outlook
- Local home prices are declining (-1.4%/yr); year-one equity from $3k of loan paydown is wiped out by about $5k of value loss. Plan a longer hold.
- Hillsborough County population projected at +37% by 2050 — long-run rental-demand tailwind backs the buy-and-hold thesis.
Negotiation context
- Only 13 days on market — expect competitive offers; lowballing is unlikely to land.
Risks & watch-outs
- Climate carrying-cost: severe wind risk, 99% chance of damaging wind over 30y; extreme-heat days projected 7→27/yr by 2055 (HVAC capex compounding) — expect insurance premiums to compound above CPI over the hold.
Questions for the listing agent
- What do current leases actually rent for vs. the listed asking? Can we see a recent rent roll and the last 12 months of T-12 income?
- What does the HOA fee cover, when was the last increase, and are there any pending special assessments or reserve-fund shortfalls?
- Is there a deadline driving the sale (1031 exchange, divorce, estate, relocation)? That informs how much negotiation room exists.
- Schools are B-rated — typically a magnet for longer-tenancy family renters. What's the average tenant stay here, and is there a school-zone premium baked into asking?
- The area grade is low — what's the realistic commute time and amenity access for the typical tenant pool here? Any planned neighborhood developments (good or bad) we should know about?
- What's the average days-on-market for RENTAL listings here right now (not sales)? A rising rental-DOM trend means longer vacancies and softer asking-rent achievability than the comps imply.
- What's the recent tenant-quality profile in this submarket — average credit score on applications, eviction rate, late-payment / NSF rate, and stable-employment percentage? A property-management company in the area should have these aggregated.
- How much new for-sale + rental construction is in the pipeline within 1–3 miles? Heavy new supply typically softens prices + rents 12–24 months out; constrained supply supports both.
Investment metrics
- 1% rule
- 0.72% ✗
- Cap rate
- 5.59%
- Cash-on-cash
- -2.51%
- DSCR
- 0.89
- GRM
- 11.5
CMA / ARV
No comps found within radius.
Projected returns pro-forma
-1.42% appreciation · 1.18% rent growth · sell at horizon
- IRR
- -12.6%
- Equity multiple
- 0.48×
- Total profit
- $-52,806
- Equity at exit
- $80,787
- IRR
- -7.3%
- Equity multiple
- 0.41×
- Total profit
- $-59,912
- Equity at exit
- $78,742
Cash invested: $102,200 (down + closing). Projections, not guarantees.
Landlord ↔ Tenant lean methodology
- Overall (STATE)
- 87 Strongly Landlord-Friendly
- State Florida
- 87 Strongly Landlord-Friendly · R+3
- County
- — inherits STATE
- City
- — inherits STATE
ZIP-level market 33579
- Home prices YoY
- -0.6%
- Rents YoY
- 1.2%
- Active inventory
- 463
- Price-to-rent
- 11.5×
Monthly cashflow live
- Estimated rent
- $2,644 high interval (Pro) →
- Mortgage (P&I)
- −$1,914
- Tax from tax record
- −$189 /mo · $2,266/yr
- Insurance
- −$152
- HOA
- −$47
- Vacancy / Maint / Mgmt
- −$555
- Net cashflow
- $-213
Break-even live
Sensitivity live
| Price | -10% $-7 | -5% $-110 | +0% $-213 | +5% $-317 | +10% $-420 |
|---|---|---|---|---|---|
| Rent | -10% $-422 | -5% $-318 | +0% $-213 | +5% $-109 | +10% $-5 |
| Rate | -1.0pp $-30 | -0.5pp $-121 | base $-213 | +0.5pp $-308 | +1.0pp $-404 |
UW: 25.0% down · 7.5% · 30yr · 1.5% tax · 5.0% vac · 8.0% maint · 8.0% mgmt
Financing live
Cash to close
- Down payment
- $91,250
- Closing costs
- $10,950
- Reserves months
- —
- Total cash needed
- —
Loan-product check · same deal, 3 products live
Conventional
25% down · 7.5% · 30yr
- Down + closing
- —
- Monthly P&I
- —
- Monthly cashflow
- —
- DSCR
- —
- Eligible?
- —
Personal DTI + credit; lowest rate.
DSCR
20% down · 8.5% · 30yr
- Down + closing
- —
- Monthly P&I
- —
- Monthly cashflow
- —
- DSCR
- —
- Eligible?
- —
No personal income docs; deal must DSCR.
Hard money
10% down · 12.0% · 12mo
- Down + closing
- —
- Monthly P&I
- —
- Monthly cashflow
- —
- DSCR
- —
- Eligible?
- —
Short-term bridge; refi at stabilization.
Rent comps 40 comps
| Address | Beds | Baths | Sqft | Rent | $/sqft | DOM | Units | Dist |
|---|---|---|---|---|---|---|---|---|
| 10904 Summerton Dr Riverview, FL | 4.0 | 3.0 | 2977 | $3,150 | $1.06 | 5d | 1 | 0.37mi |
| 13130 Fennway Ridge Dr Riverview, FL | 4.0 | 2.5 | 1736 | $2,219 | $1.28 | 4d | 1 | 0.39mi |
| 13305 Silvercreek Dr Riverview, FL | 3.0 | 2.0 | 1743 | $2,099 | $1.20 | 7d | 1 | 0.42mi |
| 11025 Golden Silence Dr Riverview, FL | 3.0 | 2.5 | 1785 | $2,210 | $1.24 | 16d | 1 | 0.44mi |
| 13625 Silver Charm Ct Riverview, FL | 4.0 | 2.5 | 1907 | $2,350 | $1.23 | 26d | 1 | 0.44mi |
| 11121 Kempton Vista Dr Riverview, FL | 4.0 | 2.0 | 1983 | $2,350 | $1.19 | 26d | 1 | 0.45mi |
| 11009 Golden Silence Dr Riverview, FL | 4.0 | 2.5 | 2154 | $2,800 | $1.30 | 26d | 1 | 0.46mi |
| 11322 Torrey Pines Dr Riverview, FL | 4.0 | 2.0 | 2194 | $2,300 | $1.05 | 26d | 1 | 0.50mi |
| 11106 Kempton Vista Dr Riverview, FL | 4.0 | 2.5 | 3300 | $3,100 | $0.94 | 1d | 1 | 0.50mi |
| 10925 Subtle Trail Dr Riverview, FL | 3.0 | 2.0 | 1716 | $2,000 | $1.17 | 26d | 1 | 0.51mi |
| 12962 Fennway Ridge Dr Riverview, FL | 4.0 | 2.5 | 2098 | $2,950 | $1.41 | 26d | 1 | 0.53mi |
| 11164 Golden Silence Dr Riverview, FL | 3.0 | 2.0 | 1930 | $2,050 | $1.06 | 26d | 1 | 0.53mi |
| 13423 Beechberry Dr Riverview, FL | 4.0 | 2.5 | 2322 | $2,795 | $1.20 | 0d | 1 | 0.58mi |
| 13016 Prestwick Dr Riverview, FL | 4.0 | 3.0 | 2506 | $3,500 | $1.40 | 26d | 1 | 0.66mi |
| 10805 Australian Pine Dr Riverview, FL | 3.0 | 2.0 | 1897 | $2,350 | $1.24 | 26d | 1 | 0.72mi |
| 12942 Utopia Gardens Way Riverview, FL | 3.0 | 2.5 | 1668 | $2,390 | $1.43 | 1d | 1 | 0.80mi |
| 12942 Utopia Gardens Way Riverview, FL | 3.0 | 2.5 | 1668 | $2,350 | $1.41 | 4d | 1 | 0.80mi |
| 12961 Utopia Gardens Way Riverview, FL | 3.0 | 2.5 | 1668 | $1,890 | $1.13 | 18d | 1 | 0.84mi |
| 11424 Misty Isle Ln Riverview, FL | 3.0 | 2.0 | 1839 | $2,165 | $1.18 | 14d | 1 | 0.90mi |
| 10505 Opus Dr Riverview, FL | 4.0 | 2.5 | 1942 | $2,550 | $1.31 | 26d | 1 | 0.91mi |
| 11427 Misty Isle Ln Riverview, FL | 4.0 | 2.0 | 1916 | $2,310 | $1.21 | 7d | 1 | 0.91mi |
| 11519 Misty Isle Ln Riverview, FL | 4.0 | 2.0 | 1936 | $2,600 | $1.34 | 26d | 1 | 0.92mi |
| 11510 Harlan Eddy Ct Riverview, FL | 4.0 | 2.0 | 2351 | $2,700 | $1.15 | 26d | 1 | 0.96mi |
| 12712 Longcrest Dr Riverview, FL | 4.0 | 2.0 | 1608 | $2,200 | $1.37 | 26d | 1 | 0.98mi |
| 12906 Longcrest Dr Riverview, FL | 4.0 | 2.0 | 1596 | $2,290 | $1.43 | 3d | 1 | 1.02mi |
| 11328 Misty Isle Ln Riverview, FL | 4.0 | 3.5 | 2532 | $2,600 | $1.03 | 12d | 1 | 1.05mi |
| 12845 Longcrest Dr Riverview, FL | 3.0 | 2.0 | 1812 | $2,215 | $1.22 | 0d | 1 | 1.05mi |
| 11176 Leland Groves Dr Riverview, FL | 4.0 | 2.5 | 2318 | $2,700 | $1.16 | 7d | 1 | 1.05mi |
| 13263 Evening Sunset Ln Riverview, FL | 4.0 | 2.0 | 1959 | $2,200 | $1.12 | 7d | 1 | 1.06mi |
| 12914 Astorwood Pl Riverview, FL | 4.0 | 2.0 | 1808 | $2,395 | $1.32 | 1d | 1 | 1.06mi |
| 13655 Artesa Bell Dr Riverview, FL | 4.0 | 3.0 | 2351 | $3,000 | $1.28 | 0d | 1 | 1.07mi |
| 11618 Ashton Field Ave Riverview, FL | 4.0 | 3.0 | 2114 | $2,400 | $1.14 | 1d | 1 | 1.11mi |
| 10825 Newbridge Dr Riverview, FL | 4.0 | 2.5 | 2021 | $3,500 | $1.73 | 1d | 1 | 1.12mi |
| 12722 Evington Point Dr Riverview, FL | 4.0 | 2.0 | 1750 | $2,150 | $1.23 | 7d | 1 | 1.13mi |
| 12722 Evington Point Dr Riverview, FL | 4.0 | 2.0 | 1754 | $2,150 | $1.23 | 26d | 1 | 1.13mi |
| 11514 Brighton Knoll Loop Riverview, FL | 3.0 | 2.5 | 2759 | $2,900 | $1.05 | 14d | 1 | 1.14mi |
| 12026 Bridge Point Ln Riverview, FL | 3.0 | 2.5 | 1780 | $2,180 | $1.22 | 26d | 1 | 1.16mi |
| 12762 Standbridge Dr Riverview, FL | 3.0 | 2.5 | 2404 | $2,316 | $0.96 | 26d | 1 | 1.22mi |
| 12019 Butler Woods Cir Riverview, FL | 3.0 | 2.0 | 1693 | $2,230 | $1.32 | 4d | 1 | 1.22mi |
| 11736 Dumaine Valley Rd Riverview, FL | 3.0 | 2.5 | 1670 | $2,000 | $1.20 | 16d | 1 | 1.28mi |
HOA detail
- Monthly dues
- $47 · $564/yr
Listing history 2 events
-
2026-05-14status Pending
-
2026-05-01$365,000 Active
ⓘ Source: listings_history table (triggers on properties + properties_extension) + one-shot
backfill from property_details.listing_events for pre-trigger history.
Tax reassessment forecast FL · Resets to sale price
- Current annual tax
- $2,266 · $189/mo
- Projected year-2 tax
- $3,030 · $252/mo
- Expected delta
- +$763/yr (+$64/mo · 33.7%)
ⓘ Screening estimate from a state-policy table — verify with the county assessor before closing.
Climate risk First Street
- Flood 1/10 Low FEMA zone X (unshaded) · 0% chance over 30 yrs
- Wildfire 4/10 Moderate
- Heat 10/10 Extreme 7 d/yr ≥109°F today · 27 d/yr by 30 yrs out
- Wind 9/10 Extreme 99% chance of damaging wind over 30 yrs
- Air quality 3/10 Moderate 3 unhealthy d/yr today · 3 by 30 yrs out
Nearby sold comps map
Loading sold comps map…
Walkable amenities ~0.75 mi
Loading nearby amenities…
Taxation est. · year 1
- Rental income
- $31,726
- − Mortgage interest
- −$20,446
- − Property taxes
- −$2,266
- − Insurance
- −$1,825
- − Repairs & maintenance
- −$2,538
- − Management
- −$2,538
- − HOA
- −$564
- − Depreciation
- −$10,618
- Taxable loss
- −$9,069
- Est. tax savings @ 24.0%
- +$2,177
- After-tax cash flow
- $-384/yr
For passive investors: Depreciation is non-cash, so a rental often shows a tax loss while cash-flowing — sheltering income. Rental losses are passive: they offset passive income freely, and up to $25,000/yr can offset ordinary (W-2) income if you actively participate and your MAGI is under $100k (phasing out to $0 by $150k); unused losses carry forward. On sale, claimed depreciation is recaptured at up to 25%, and gains may owe capital-gains tax (a 1031 exchange can defer both). Figures are a year-1 estimate at your 24.0% rate — not tax advice; consult a CPA.
Schools (NCES district)
- District
- Hillsborough
- NCES district ID
- 1200870
- Math proficiency
- 47% ▼ -8.00%
- Reading proficiency
- 50% ▼ -4.00%
- Median HH income
- $50,622
- Composite
- 41.6/100
- National rank
- #3435
- State rank
- #41 of 73 in FL
Livability — Riverview
- Score
- 79/100
- State rank
- #134
- US rank
- #2000
Category grades
Schools grade is shown separately in the Schools card above.
Census & demographics
- Census place
- Riverview, FL
- County
- Hillsborough County · 1,540,968 people
- City population
- 137,988
- Metro
- Tampa-St. Petersburg-Clearwater, FL
- Population (ZIP)
- 49,470
- Household income
- $116,134
- Rent vs Own
- Severe rent burden
- 258.0
Population outlook (Hillsborough County) Hauer SSP2
- Today (2025)
- 1,607,022 people
- By 2030
- 1,733,968 · +7.9%
- By 2040
- 1,979,565 · +23.2%
- By 2050
- 2,203,427 · +37.1%
- By 2075
- 2,667,893 · +66.0%
- By 2100
- 2,891,558 · +79.9%
Race, ethnicity, and origin ACS 2023
- Neighborhood character
- Highly diverse neighborhood (Simpson 0.71)
- Race & ethnicity
- White 42% Hispanic / Latino 25% Black 24% Two or more races 19% Asian 5%
- Hispanic origin (detail)
- Mexican 3% Puerto Rican 12% Cuban 3% Dominican 1%
- Common ancestry
- Hispanic 1% British 1% Romanian 1%
- Foreign-born
- 17% · Canada, Jamaica, China
- Languages at home
- 73% English-only · Spanish 19% Other Indo-European 2% French/Haitian/Cajun 1%
Political lean MEDSL · Hillsborough
- 2024 margin
- Toss-up / Even · D 47.8% · R 50.9% · Other 1.3%
- 2008→2024 swing
- -10.2pp toward R · 2008: 7.1pp · 2024: -3.1pp
- All cycles
- 2024: R+3.1 2020: D+6.9 2016: D+6.8 2012: D+6.7 2008: D+7.1
Not yet ingested
- Civics
- —
Market trends
- HPI YoY
- ▼ -1.42%
- Current HPI
- 240.5825
- Rent YoY
- ▲ 1.18%
- Metro
- Tampa-St. Petersburg-Clearwater, FL
- State GDP YoY
- ▲ 3.28%
- F500 in state
- 36
Industry mix (Fortune 500 HQ in FL)
| Industry | F500 HQs | Revenue |
|---|---|---|
| Industrial Technology | 2 | $29B |
|
||
| Insurance | 2 | $17B |
|
||
| Retail | 1 | $60B |
|
||
| Technology Distribution | 1 | $58B |
|
||
| Homebuilding | 1 | $35B |
|
||
| Technology Manufacturing | 1 | $35B |
|
||
Price history
2 events — show timeline
- 2026-05-14 Pending — Stellar MLS as Distributed by MLS Grid
- 2026-05-01 Listed $365,000 Stellar MLS as Distributed by MLS Grid
Property tax history
+3.3%/yrLatest (2025): $2,266 · +10.4% YoY. Source: county tax records.
Cash-flow waterfall
monthlySold comps — $/sqft
last 12 mo · ≤1 miLoading sold comps…