1676 Wood Lily Ln · Custer, SD
Flood risk 1/10 · Minimal
- FEMA flood zone
- X (unshaded)
- Chance of flooding over 30 yrs
- 0.0%
- Est. flood insurance / yr
- $507 – $1,088
Fire risk 7/10 · Major
- Est. fire insurance / yr
- $1,342 – $2,492
Heat risk 1/10 · Minimal
- Hot days now (above 87°F)
- 8 days/yr
- Hot days in 30 yrs
- 19 days/yr
Wind risk 2/10 · Minimal
- Chance of severe wind over 30 yrs
- —
Air-quality risk 2/10 · Minimal
- Unhealthy air days now
- 1 days/yr
- Unhealthy air days in 30 yrs
- 3 days/yr
Risk factors via First Street. Map © Google.
Why this score? — see what drove the C- grade
The composite is a weighted blend of 9 inputs, each scored 0–100. Each bar is that input's sub-score; the figure is the points it added to the 100-point composite (weight × sub-score).
- Cash flow +21.5/30.0
- DSCR +6.9/10.0
- ARV discount +6.5/15.0
- 1% rule +5.4/10.0
- Schools +4.0/10.0
- Condition / age +4.0/5.0
- Livability +3.8/5.0
- Rent growth +2.5/5.0
- Appreciation +0.0/10.0
$129,500
🖨 Deal sheet (PDF) 📄 Offer letter ✓ Due diligence
Key facts
- Nicely landscaped
- Storage shed
- Paved street
Tags
Property features AI
Finance
- Other: Located in Woodland Meadows Mobile Home Court (directions: east Custer, off US Hwy. 16A)
Exterior
- Home design: Manufactured home; Residential property
- Construction: Composition roof
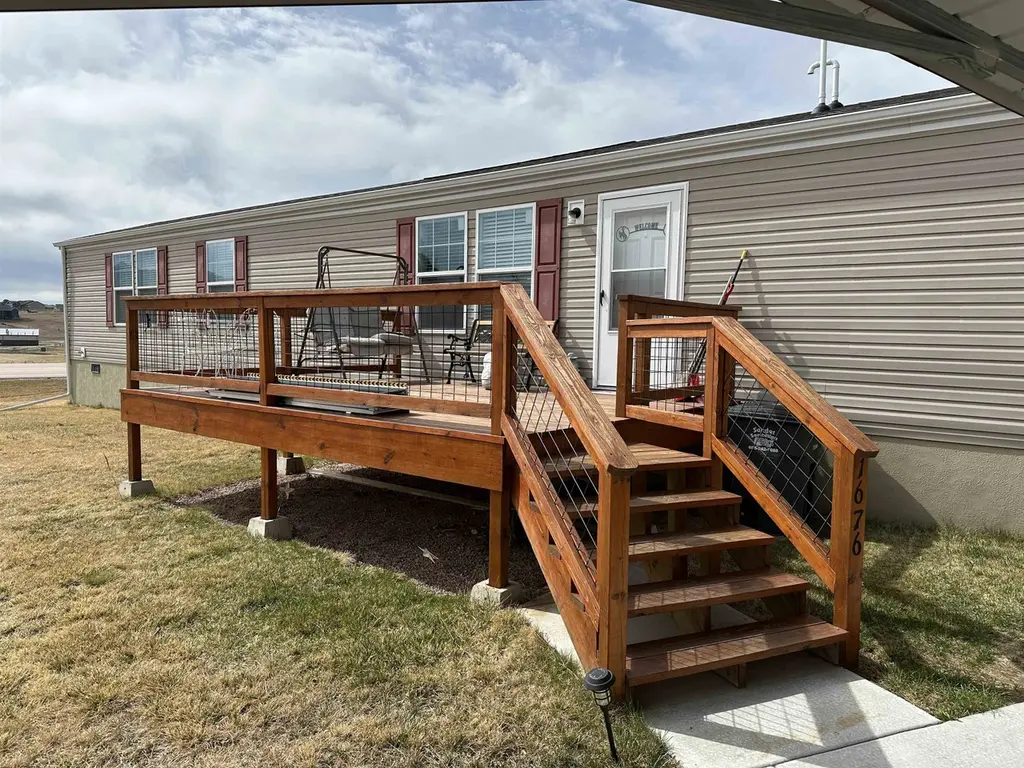
- Exterior features: Deck; Shed(s)
Interior
- Kitchen: Equipped with dishwasher, gas range/oven, microwave, refrigerator
- Bedrooms: 3 bedrooms on the main level
- Bathrooms: 2 full bathrooms; 2 main-level bathrooms
- Interior features: Dishwasher; Dryer; Gas range; Gas oven; Microwave; Refrigerator
- Laundry & utility: Dryer
Neighborhood map
What this means for you Summary
Snapshot
- This is a 2-bed/2.0-bath manufactured listed at $130k. Condition is rated good.
Deal economics
- At list price, monthly cash flow is $195 ($2k/yr) — positive.
- The deal already cash-flows at list — no discount required.
- Meets the 1% rule at list price ($1k rent vs $130k).
- Recommended offer: $126k (3.0% below list) — sets the bar for market timing.
- Cap rate 8.1% vs local median 1.2% in Custer — top-decile yield for the area; either an underpriced asset or a hidden risk that comps aren't pricing in. Stress-test before assuming the spread holds.
Location & tenants
- Location reads 75/100 on livability (#27 in SD, #3,937 nationally) — a middle-class / working-renter tenant base. Strengths: crime A+, cost of living A+, housing A+; Watch: employment D+, commute F.
- Custer School District 16-1 (rural): math 40% / reading 54% proficiency, ranked #37 of 59 in SD (top 63%) — families likely to look elsewhere, expect single-tenant / working-renter base with shorter leases.
- Zoned schools: Custer Elementary - 02 (math 42% / reading 52%, grade D-, #134 of 253 statewide, top 55%, 304 students, 19% FRL); Custer Jr. High - 05 (math 47% / reading 62%, grade B-, #36 of 143 statewide, top 29%, 101 students, 22% FRL); Custer High School - 01 (math 37% / reading 72%, grade C-, #53 of 151 statewide, top 41%, 284 students, 16% FRL).
- Market conditions: 118 active listings in the ZIP; 229 units permitted in Custer County in 2024 (0 in 5+ unit buildings).
Forward outlook
- Local home prices are declining (-3.0%/yr); year-one equity from $895 of loan paydown is wiped out by about $4k of value loss. Plan a longer hold.
- Custer County population projected at +6% by 2050 — modest demand growth; plan on rents tracking national, not racing it.
Negotiation context
- It's been on market 60 days — a 3% lower offer ($126k) is reasonable based on typical stale-listing flexibility.
Risks & watch-outs
- Climate carrying-cost: major wildfire risk — expect insurance premiums to compound above CPI over the hold.
Questions for the listing agent
- It's been on market 60 days. Have you received any prior offers? Is the seller open to a 3% concession, seller financing, or rate buy-down credit?
- Is there a deadline driving the sale (1031 exchange, divorce, estate, relocation)? That informs how much negotiation room exists.
- What's the average days-on-market for RENTAL listings here right now (not sales)? A rising rental-DOM trend means longer vacancies and softer asking-rent achievability than the comps imply.
- What's the recent tenant-quality profile in this submarket — average credit score on applications, eviction rate, late-payment / NSF rate, and stable-employment percentage? A property-management company in the area should have these aggregated.
- How much new for-sale + rental construction is in the pipeline within 1–3 miles? Heavy new supply typically softens prices + rents 12–24 months out; constrained supply supports both.
Investment metrics
- 1% rule
- 1.04% ✓
- Cap rate
- 8.10%
- Cash-on-cash
- 6.46%
- DSCR
- 1.29
- GRM
- 8.0
CMA / ARV
- ARV (median comp)
- $126,738
- List price
- $129,500
- Delta
- 2.18%
- Verdict
- FAIR
- Comps
- 6 within 1.0 mi
Show comp detail 4 sales within ~0.75 mi
| Address | Dist | Beds/Ba | Sqft | Sold | Price | $/sf | Match |
|---|---|---|---|---|---|---|---|
| 1652 Wood Lily Ln | 0.01mi | 3/2.0 (+1) | 1,216 (0%) | 6mo | $135,500 | $111 | 89 |
| 949 Ponderosa St | 0.73mi | 3/2.0 (+1) | 1,216 (0%) | 5mo | $60,000 | $49 | 57 |
| 923, Lot 5 Crook St | 0.67mi | 3/2.0 (+1) | 1,216 (0%) | 19mo | $120,500 | $99 | 48 |
| 25141 Harbach Ln | 0.55mi | 3/2.0 (+1) | 1,056 (-13%) | 5mo | $150,000 | $142 | 43 |
Match score weights: distance 35% · size 25% · config 20% · recency 20%. Top-matched comps best support the ARV.
Projected returns pro-forma
-3.0% appreciation · 3.0% rent growth · sell at horizon
- IRR
- -6.4%
- Equity multiple
- 0.76×
- Total profit
- $-8,554
- Equity at exit
- $19,309
- IRR
- 3.3%
- Equity multiple
- 1.24×
- Total profit
- $8,563
- Equity at exit
- $11,197
Cash invested: $36,260 (down + closing). Projections, not guarantees.
Landlord ↔ Tenant lean methodology
- Overall (STATE)
- 83 Strongly Landlord-Friendly
- State South Dakota
- 83 Strongly Landlord-Friendly · R+16
- County
- — inherits STATE
- City
- — inherits STATE
ZIP-level market 57730
- Home prices YoY
- -20.4%
- Active inventory
- 118
- Price-to-rent
- 8.0×
Monthly cashflow live
- Estimated rent
- $1,343 medium interval (Pro) →
- Mortgage (P&I)
- −$679
- Tax from tax record
- −$133 /mo · $1,591/yr
- Insurance
- −$54
- HOA
- −$0
- Vacancy / Maint / Mgmt
- −$282
- Net cashflow
- $195
Break-even live
Sensitivity live
| Price | -10% $268 | -5% $232 | +0% $195 | +5% $158 | +10% $122 |
|---|---|---|---|---|---|
| Rent | -10% $89 | -5% $142 | +0% $195 | +5% $248 | +10% $301 |
| Rate | -1.0pp $260 | -0.5pp $228 | base $195 | +0.5pp $162 | +1.0pp $127 |
UW: 25.0% down · 7.5% · 30yr · 1.5% tax · 5.0% vac · 8.0% maint · 8.0% mgmt
Financing live
Cash to close
- Down payment
- $32,375
- Closing costs
- $3,885
- Reserves months
- —
- Total cash needed
- —
Loan-product check · same deal, 3 products live
Conventional
25% down · 7.5% · 30yr
- Down + closing
- —
- Monthly P&I
- —
- Monthly cashflow
- —
- DSCR
- —
- Eligible?
- —
Personal DTI + credit; lowest rate.
DSCR
20% down · 8.5% · 30yr
- Down + closing
- —
- Monthly P&I
- —
- Monthly cashflow
- —
- DSCR
- —
- Eligible?
- —
No personal income docs; deal must DSCR.
Hard money
10% down · 12.0% · 12mo
- Down + closing
- —
- Monthly P&I
- —
- Monthly cashflow
- —
- DSCR
- —
- Eligible?
- —
Short-term bridge; refi at stabilization.
Listing history 20 events
-
2026-06-21days on market $129,500 Active 60 DOM
-
2026-06-19days on market $129,500 Active 58 DOM
-
2026-06-18days on market $129,500 Active 57 DOM
-
2026-06-17days on market $129,500 Active 56 DOM
-
2026-06-16days on market $129,500 Active 55 DOM
-
2026-06-15days on market $129,500 Active 54 DOM
-
2026-06-14days on market $129,500 Active 52 DOM
-
2026-06-13days on market $129,500 Active 51 DOM
-
2026-06-10days on market $129,500 Active 49 DOM
-
2026-06-09days on market $129,500 Active 48 DOM
-
2026-06-08days on market $129,500 Active 47 DOM
-
2026-06-07days on market $129,500 Active 46 DOM
-
2026-06-05days on market $129,500 Active 43 DOM
-
2026-06-03days on market $129,500 Active 42 DOM
-
2026-06-02days on market $129,500 Active 41 DOM
-
2026-06-01days on market $129,500 Active 40 DOM
-
2026-05-31days on market $129,500 Active 39 DOM
-
2026-05-30days on market $129,500 Active 38 DOM
-
2026-04-23price $129,500 313-char remark
-
2026-04-18$129,500,000 Active 313-char remark
ⓘ Source: listings_history table (triggers on properties + properties_extension) + one-shot
backfill from property_details.listing_events for pre-trigger history.
Tax reassessment forecast SD · Resets to sale price
- Current annual tax
- $1,591 · $133/mo
- Projected year-2 tax
- $1,696 · $141/mo
- Expected delta
- +$105/yr (+$9/mo · 6.6%)
ⓘ Screening estimate from a state-policy table — verify with the county assessor before closing.
Climate risk First Street
- Flood 1/10 Low FEMA zone X (unshaded) · 0% chance over 30 yrs
- Wildfire 7/10 Severe
- Heat 1/10 Low 8 d/yr ≥87°F today · 19 d/yr by 30 yrs out
- Wind 2/10 Low
- Air quality 2/10 Low 1 unhealthy d/yr today · 3 by 30 yrs out
Nearby sold comps map
Loading sold comps map…
Walkable amenities ~0.75 mi
Loading nearby amenities…
Taxation est. · year 1
- Rental income
- $16,113
- − Mortgage interest
- −$7,254
- − Property taxes
- −$1,591
- − Insurance
- −$648
- − Repairs & maintenance
- −$1,289
- − Management
- −$1,289
- − Depreciation
- −$3,767
- Taxable income
- $275
- Est. tax owed @ 24.0%
- −$66
- After-tax cash flow
- $2,275/yr
For passive investors: Depreciation is non-cash, so a rental often shows a tax loss while cash-flowing — sheltering income. Rental losses are passive: they offset passive income freely, and up to $25,000/yr can offset ordinary (W-2) income if you actively participate and your MAGI is under $100k (phasing out to $0 by $150k); unused losses carry forward. On sale, claimed depreciation is recaptured at up to 25%, and gains may owe capital-gains tax (a 1031 exchange can defer both). Figures are a year-1 estimate at your 24.0% rate — not tax advice; consult a CPA.
Condition & rehab AI · 6 photos
This manufactured home is in good condition with a cosmetic rehab level, ready for immediate occupancy. Minor updates to exterior trim and interior could further enhance its value.
Value-add opportunities
- Both Paint exterior trim — Enhances curb appeal and value
- Both Replace carpet with hardwood — Improves aesthetics and value
- Both Install new kitchen appliances — Modernizes kitchen and adds value
Renovation cost estimate screening
Value-add ROI direction
- Both Paint exterior trim — Enhances curb appeal and value ↑
- Both Replace carpet with hardwood — Improves aesthetics and value ↑
- Both Install new kitchen appliances — Modernizes kitchen and adds value ↑
ⓘ Cost ranges are severity-bucket heuristics (US national rule-of-thumb). Get contractor quotes + a written scope before underwriting a rehab budget.
Schools (NCES district)
- District
- Custer School District 16-1
- NCES district ID
- 4616950
- Math proficiency
- 40% ▬ 0.00%
- Reading proficiency
- 54% ▬ 0.00%
- Median HH income
- $50,785
- Composite
- 40.32/100
- National rank
- #3750
- State rank
- #37 of 59 in SD
Livability — Custer
- Score
- 75/100
- State rank
- #27
- US rank
- #3937
Category grades
Schools grade is shown separately in the Schools card above.
Census & demographics
- Census place
- Custer, SD
- Population (ZIP)
- 5,647
Population outlook (Custer County) Hauer SSP2
- Today (2025)
- 9,045 people
- By 2030
- 9,220 · +1.9%
- By 2040
- 9,459 · +4.6%
- By 2050
- 9,597 · +6.1%
- By 2075
- 10,938 · +20.9%
- By 2100
- 14,306 · +58.2%
Race, ethnicity, and origin ACS 2023
- Neighborhood character
- Predominantly White (90%)
- Race & ethnicity
- White 90% Two or more races 6% Hispanic / Latino 2% Native American 2%
- Common ancestry
- Portuguese 6% Lithuanian 5% Italian 3%
- Foreign-born
- 2% · Canada
- Languages at home
- 95% English-only · German/W. Germanic 2% Spanish 2%
Political lean MEDSL · Custer
- 2024 margin
- Solid R (+45.8) · D 26.1% · R 71.9% · Other 2.0%
- 2008→2024 swing
- -13.9pp toward R · 2008: -31.8pp · 2024: -45.8pp
- All cycles
- 2024: R+45.8 2020: R+42.4 2016: R+46.0 2012: R+38.2 2008: R+31.8
Not yet ingested
- Civics
- —
Market trends
- HPI YoY
- ▼ -72.26%
- Current HPI
- 281.6391
- Rent YoY
- —
- Metro
- —
- State GDP YoY
- ▲ 0.70%
- F500 in state
- 2
Industry mix (Fortune 500 HQ in SD)
| Industry | F500 HQs | Revenue |
|---|---|---|
| Utilities | 1 | $1B |
|
||
Price history
-99.9% since first listed2 events — show timeline
- 2026-04-23 Price Changed $129,500 MRAOR
- 2026-04-18 Listed $129,500,000 MRAOR
Property tax history
+7.3%/yrLatest (2025): $1,591 · +7.9% YoY. Source: county tax records.
Cash-flow waterfall
monthlySold comps — $/sqft
last 12 mo · ≤1 miLoading sold comps…