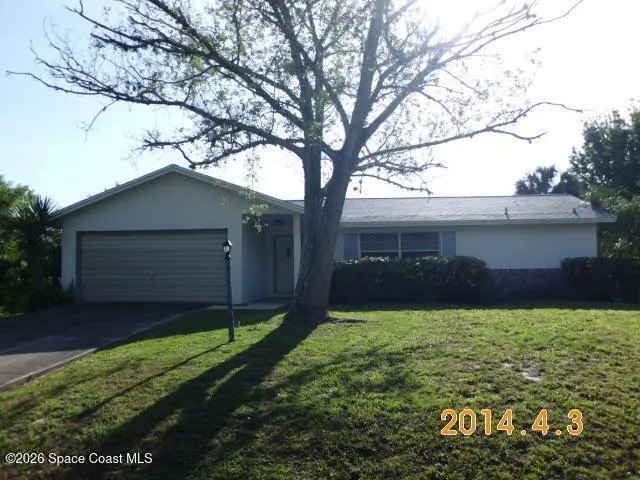
363 Comet Ave SE · Palm Bay, FL
Flood risk 1/10 · Minimal
- FEMA flood zone
- X (unshaded)
- Chance of flooding over 30 yrs
- 0.0%
- Est. flood insurance / yr
- $507 – $1,088
Fire risk 1/10 · Minimal
- Est. fire insurance / yr
- $947 – $1,759
Heat risk 10/10 · Severe
- Hot days now (above 106°F)
- 7 days/yr
- Hot days in 30 yrs
- 22 days/yr
Wind risk 10/10 · Severe
- Chance of severe wind over 30 yrs
- 99.0%
Air-quality risk 1/10 · Minimal
- Unhealthy air days now
- 0 days/yr
- Unhealthy air days in 30 yrs
- 0 days/yr
Risk factors via First Street. Map © Google.
Why this score? — see what drove the C- grade
The composite is a weighted blend of 9 inputs, each scored 0–100. Each bar is that input's sub-score; the figure is the points it added to the 100-point composite (weight × sub-score).
- Cash flow +13.7/30.0
- Appreciation +10.0/10.0
- ARV discount +7.5/15.0
- Schools +4.7/10.0
- DSCR +4.1/10.0
- 1% rule +3.6/10.0
- Livability +3.6/5.0
- Rent growth +3.4/5.0
- Condition / age +2.5/5.0
$254,900
🖨 Deal sheet 📄 Offer letter ✓ Due diligence
Listing remarks MLS
Come see this cute 3 bedroom 2 bathroom home located in quiet SE Palm Bay neighborhood close to all daily needs shopping dining and schools. Home features tile and carpet floors open floor plan and large screened in back patio perfect for entertaining. Large back yard big enough for a pool. Home is perfect for a new growing family! Hurry! this home will not last long!!
Key facts
- Large family room
- Formal dining room
- Screened porch
Tags
Property features AI
Exterior
- Parking: Garage; 2-car garage
- Security: Smoke detector(s)
- Utilities: Public sewer; Water available; Electricity available; Cable available; Sewer available
- Home design: Single-family residence; One story; Entry level: 1; Faces west
- Construction: Concrete and stucco construction; Shingle roof
- Exterior features: Porch (screened); Few trees; City street frontage; Asphalt road surface
Interior
- Kitchen: Electric range; Refrigerator
- Bedrooms: 3 bedrooms (all on entry level)
- Flooring: Tile; Vinyl
- Bathrooms: 2 full bathrooms
- Heating & cooling: Central heating (electric); Central air conditioning (electric)
- Interior features: Ceiling fans; Smoke detector(s)
- Laundry & utility: Electric dryer hookup; Electric water heater
Neighborhood map
What this means for you Summary
Snapshot
- This is a 4-bed/2.0-bath single-family listed at $255k.
Deal economics
- At list price, monthly cash flow is $19 ($224/yr) — positive.
- The deal already cash-flows at list — no discount required.
- To meet the 1% rule (rent ≥ 1% of price), the offer needs to be $220k (13.9% below list).
- Recommended offer: $220k (13.9% below list) — sets the bar for 1% rule.
Location & tenants
- Location reads 72/100 on livability (#366 in FL) — a middle-class / working-renter tenant base. Strengths: cost of living A+, housing A+; Watch: employment D+, amenities F, health & safety D-.
- Brevard (suburban): math 53% / reading 57% proficiency, ranked #19 of 73 in FL (top 26%) — acceptable for families but not a draw, mixed tenant base, ~2y average lease.
- Zoned schools: John F. Turner Senior Elementary School (math 38% / reading 43%, grade F, #1,471 of 2,144 statewide, top 69%, 543 students, 69% FRL); Southwest Middle School (math 40% / reading 39%, grade F, #373 of 571 statewide, top 66%, 920 students, 58% FRL); Heritage High School (math 30% / reading 44%, grade F, #340 of 667 statewide, top 52%, 2,007 students, 62% FRL) — zoned schools average 63% FRL vs 43% district-wide (20 pts higher); higher-poverty schools than district average — tighter screening recommended.
- Zoned-school proficiency averages 39% at this address vs 55% district-wide (-16 pts) — the specific schools serving this property underperform the Brevard average; the district grade overstates school quality for this exact location.
- Market conditions: Rents rising (+3.7%/yr); 1111 active listings in the ZIP; 26 comparable units currently listed for rent nearby; rentals at typical pace (median 24d on market — plan ~3-4 weeks tenant-placement turnaround); solid renter incomes; 4,602 units permitted in Brevard County in 2024 (702 in 5+ unit buildings).
Forward outlook
- In year one you build about $27k of equity ($2k loan paydown + $25k appreciation (10.0% local appreciation)).
- Brevard County population projected at +15% by 2050 — modest demand growth; plan on rents tracking national, not racing it.
- At projected returns (10.0% appreciation + 3.7% rent growth), your $71k cash investment doubles in ~3 years — after that, you're playing with house money.
- By year 2, paydown + projected appreciation supports a ~$44k cash-out refi (75% LTV) — recoverable capital for the next deal without selling this one.
Negotiation context
- It's been on market 87 days — a 6% lower offer ($240k) is reasonable based on typical stale-listing flexibility.
- 2 sale attempts since 13y ago with the ask held roughly flat each time — persistent listings suggest the price (not the market) is what's stuck; bring a comps-based counter.
- Current owner paid $77k; list at $255k implies a 231% gain — meaningful room to come down on a strong offer.
Risks & watch-outs
- Climate carrying-cost: severe wind risk, 99% chance of damaging wind over 30y; extreme-heat days projected 7→22/yr by 2055 (HVAC capex compounding) — expect insurance premiums to compound above CPI over the hold.
Questions for the listing agent
- It's been on market 87 days. Have you received any prior offers? Is the seller open to a 14% concession, seller financing, or rate buy-down credit?
- Why hasn't it sold? Are there any deal-killer items the seller is aware of (foundation, flood, title, zoning, code violations)?
- Is there a deadline driving the sale (1031 exchange, divorce, estate, relocation)? That informs how much negotiation room exists.
- What's the average days-on-market for RENTAL listings here right now (not sales)? A rising rental-DOM trend means longer vacancies and softer asking-rent achievability than the comps imply.
- What's the recent tenant-quality profile in this submarket — average credit score on applications, eviction rate, late-payment / NSF rate, and stable-employment percentage? A property-management company in the area should have these aggregated.
- How much new for-sale + rental construction is in the pipeline within 1–3 miles? Heavy new supply typically softens prices + rents 12–24 months out; constrained supply supports both.
Investment metrics
- 1% rule
- 0.86% ✗
- Cap rate
- 6.38%
- Cash-on-cash
- 0.31%
- DSCR
- 1.01
- GRM
- 9.7
CMA / ARV
No comps found within radius.
Projected returns pro-forma
10.0% appreciation · 3.67% rent growth · sell at horizon
- IRR
- 24.7%
- Equity multiple
- 2.98×
- Total profit
- $141,507
- Equity at exit
- $229,634
- IRR
- 22.0%
- Equity multiple
- 6.87×
- Total profit
- $418,898
- Equity at exit
- $495,215
Cash invested: $71,372 (down + closing). Projections, not guarantees.
Landlord ↔ Tenant lean methodology
- Overall (STATE)
- 87 Strongly Landlord-Friendly
- State Florida
- 87 Strongly Landlord-Friendly · R+3
- County
- — inherits STATE
- City
- — inherits STATE
ZIP-level market 32909
- Home prices YoY
- 6.0%
- Rents YoY
- 3.7%
- Active inventory
- 1111
- Price-to-rent
- 9.7×
Monthly cashflow live
- Estimated rent
- $2,195 high interval (Pro) →
- Mortgage (P&I)
- −$1,337
- Tax from tax record
- −$273 /mo · $3,272/yr
- Insurance
- −$106
- HOA
- −$0
- Vacancy / Maint / Mgmt
- −$461
- Net cashflow
- $19
Break-even live
UW: 25.0% down · 7.5% · 30yr · 1.5% tax · 5.0% vac · 8.0% maint · 8.0% mgmt
Financing live
Cash to close
- Down payment
- $63,725
- Closing costs
- $7,647
- Reserves months
- —
- Total cash needed
- —
Loan-product check · same deal, 3 products live
Conventional
25% down · 7.5% · 30yr
- Down + closing
- —
- Monthly P&I
- —
- Monthly cashflow
- —
- DSCR
- —
- Eligible?
- —
Personal DTI + credit; lowest rate.
DSCR
20% down · 8.5% · 30yr
- Down + closing
- —
- Monthly P&I
- —
- Monthly cashflow
- —
- DSCR
- —
- Eligible?
- —
No personal income docs; deal must DSCR.
Hard money
10% down · 12.0% · 12mo
- Down + closing
- —
- Monthly P&I
- —
- Monthly cashflow
- —
- DSCR
- —
- Eligible?
- —
Short-term bridge; refi at stabilization.
Rent comps 26 comps
| Address | Beds | Baths | Sqft | Rent | $/sqft | DOM | Units | Dist |
|---|---|---|---|---|---|---|---|---|
| 741 Frisco St SE Palm Bay, FL | 3.0 | 2.0 | 1156 | $1,950 | $1.69 | 23d | 1 | 0.24mi |
| 743 Andrew St SE Palm Bay, FL | 3.0 | 2.0 | 1252 | $1,895 | $1.51 | 23d | 1 | 0.65mi |
| 490 Hatcher St SE Palm Bay, FL | 4.0 | 2.0 | 1833 | $2,150 | $1.17 | 21d | 1 | 0.65mi |
| 272 Aquarius Ave SE Palm Bay, FL | 4.0 | 2.0 | 1650 | $1,995 | $1.21 | 23d | 1 | 0.78mi |
| 84 San Filippo Dr SE Palm Bay, FL | 1.0–3.0 | 1.0–2.0 | 1052 | $2,044 | $1.94 | 14d | 30 | 0.79mi |
| 320 Algiers Ave SE Palm Bay, FL | 3.0 | 2.0 | 1306 | $1,825 | $1.40 | 23d | 1 | 0.88mi |
| 1205 Jaslo St SE Palm Bay, FL | 1.0–3.0 | 1.0–2.0 | 992 | $2,245 | $2.26 | 14d | 8 | 1.01mi |
| 309 Cactus St SE Palm Bay, FL | 4.0 | 2.0 | 1846 | $2,195 | $1.19 | 14d | 1 | 1.06mi |
| 214 Eldron Blvd NE Palm Bay, FL | 3.0 | 2.0 | 1646 | $2,075 | $1.26 | 23d | 1 | 1.11mi |
| 721 Taluga Ave SE Palm Bay, FL | 3.0 | 2.0 | 1556 | $1,800 | $1.16 | 23d | 1 | 1.14mi |
| 194 Holiday Park Blvd NE Palm Bay, FL | 3.0 | 2.0 | 1404 | $1,695 | $1.21 | 23d | 1 | 1.18mi |
| 154 Anderson Ave NE Unit 154 Palm Bay, FL | 3.0 | 2.0 | 1414 | $1,800 | $1.27 | 14d | 1 | 1.21mi |
| 481 Firestone St NE Palm Bay, FL | 4.0 | 2.0 | 1504 | $2,100 | $1.40 | 23d | 1 | 1.22mi |
| 431 Brantley St SE Palm Bay, FL | 3.0 | 2.0 | 1326 | $2,050 | $1.55 | 19d | 1 | 1.23mi |
| 896 Talmadge Ave SE Palm Bay, FL | 3.0 | 2.0 | 1263 | $1,900 | $1.50 | 14d | 1 | 1.24mi |
| 885 Talmadge Ave SE Palm Bay, FL | 3.0 | 2.0 | 1787 | $2,300 | $1.29 | 21d | 1 | 1.25mi |
| 1391 Nolan St NE Palm Bay, FL | 3.0 | 2.0 | 1176 | $1,830 | $1.56 | 19d | 1 | 1.25mi |
| 171 Okeefe St SE Palm Bay, FL | 3.0 | 2.0 | 1288 | $1,855 | $1.44 | 14d | 1 | 1.28mi |
| 710 Avalon St SE Palm Bay, FL | 3.0 | 2.0 | 1378 | $1,995 | $1.45 | 23d | 1 | 1.28mi |
| 829 Tampa Ave SE Palm Bay, FL | 3.0 | 2.0 | 1303 | $1,740 | $1.34 | 23d | 1 | 1.33mi |
| 857 Buchanan Ave SE Palm Bay, FL | 3.0 | 2.0 | 1257 | $1,950 | $1.55 | 23d | 1 | 1.36mi |
| 453 Ralwood Ln NE Palm Bay, FL | 3.0 | 2.0 | 1160 | $1,900 | $1.64 | 23d | 1 | 1.37mi |
| 931 Commerce Rd SE Palm Bay, FL | 3.0 | 2.0 | 1068 | $2,300 | $2.15 | 23d | 1 | 1.42mi |
| 463 Eldron Blvd NE Palm Bay, FL | 4.0 | 2.0 | 1870 | $2,800 | $1.50 | 23d | 1 | 1.42mi |
| 1130 Grapefruit Rd SE Palm Bay, FL | 3.0 | 2.0 | 1144 | $1,900 | $1.66 | 14d | 1 | 1.43mi |
| 549 Burlington Ave NE Palm Bay, FL | 3.0 | 2.0 | 1608 | $2,075 | $1.29 | 14d | 1 | 1.44mi |
Listing history 21 events
-
2026-06-18days on market $254,900 Active 87 DOM
-
2026-06-17days on market $254,900 Active 86 DOM
-
2026-06-16days on market $254,900 Active 85 DOM
-
2026-06-15days on market $254,900 Active 84 DOM
-
2026-06-14days on market $254,900 Active 82 DOM
-
2026-06-10days on market $254,900 Active 79 DOM
-
2026-06-08days on market $254,900 Active 77 DOM
-
2026-06-07days on market $254,900 Active 76 DOM
-
2026-06-05days on market $254,900 Active 73 DOM
-
2026-06-03days on market $254,900 Active 72 DOM
-
2026-06-02days on market $254,900 Active 71 DOM
-
2026-06-01days on market $254,900 Active 70 DOM
-
2026-05-31days on market $254,900 Active 69 DOM
-
2026-05-31days on market $254,900 Active 68 DOM
-
2026-03-19$254,900 Active
-
2014-01-17soldstatus $77,000 371-char remark
Show marketing remark (371 chars)
Come see this cute 3 bedroom 2 bathroom home located in quiet SE Palm Bay neighborhood close to all daily needs shopping dining and schools. Home features tile and carpet floors open floor plan and large screened in back patio perfect for entertaining. Large back yard big enough for a pool. Home is perfect for a new growing family! Hurry! this home will not last long!!
-
2013-10-16$84,900 371-char remark
Show marketing remark (371 chars)
Come see this cute 3 bedroom 2 bathroom home located in quiet SE Palm Bay neighborhood close to all daily needs shopping dining and schools. Home features tile and carpet floors open floor plan and large screened in back patio perfect for entertaining. Large back yard big enough for a pool. Home is perfect for a new growing family! Hurry! this home will not last long!!
-
1994-04-28soldstatus $63,000
-
1990-03-01soldstatus $57,000
-
1980-06-01soldstatus $52,900
-
1979-05-01soldstatus $44,000
ⓘ Source: listings_history table (triggers on properties + properties_extension) + one-shot
backfill from property_details.listing_events for pre-trigger history.
Tax reassessment forecast FL · Resets to sale price
- Current annual tax
- $3,272 · $273/mo
- Projected year-2 tax
- $3,272 · $273/mo
- Expected delta
- $0/yr ($0/mo · 0.0%)
ⓘ Screening estimate from a state-policy table — verify with the county assessor before closing.
Climate risk First Street
- Flood 1/10 Low FEMA zone X (unshaded) · 0% chance over 30 yrs
- Wildfire 1/10 Low
- Heat 10/10 Extreme 7 d/yr ≥106°F today · 22 d/yr by 30 yrs out
- Wind 10/10 Extreme 99% chance of damaging wind over 30 yrs
- Air quality 1/10 Low 0 unhealthy d/yr today · 0 by 30 yrs out
Nearby sold comps map
Loading sold comps map…
Walkable amenities ~0.75 mi
Loading nearby amenities…
Taxation est. · year 1
- Rental income
- $26,343
- − Mortgage interest
- −$14,278
- − Property taxes
- −$3,272
- − Insurance
- −$1,274
- − Repairs & maintenance
- −$2,107
- − Management
- −$2,107
- − Depreciation
- −$7,415
- Taxable loss
- −$4,112
- Est. tax savings @ 24.0%
- +$987
- After-tax cash flow
- $1,211/yr
For passive investors: Depreciation is non-cash, so a rental often shows a tax loss while cash-flowing — sheltering income. Rental losses are passive: they offset passive income freely, and up to $25,000/yr can offset ordinary (W-2) income if you actively participate and your MAGI is under $100k (phasing out to $0 by $150k); unused losses carry forward. On sale, claimed depreciation is recaptured at up to 25%, and gains may owe capital-gains tax (a 1031 exchange can defer both). Figures are a year-1 estimate at your 24.0% rate — not tax advice; consult a CPA.
Schools (NCES district)
- District
- Brevard
- NCES district ID
- 1200150
- Math proficiency
- 53% ▼ -9.00%
- Reading proficiency
- 57% ▼ -4.00%
- Median HH income
- $49,426
- Composite
- 46.86/100
- National rank
- #2370
- State rank
- #19 of 73 in FL
Livability — Palm Bay
- Score
- 72/100
- State rank
- #366
- US rank
- #6458
Category grades
Schools grade is shown separately in the Schools card above.
Census & demographics
- Census place
- Palm Bay, FL
- County
- Brevard County · 602,871 people
- City population
- 132,211
- Metro
- Palm Bay-Melbourne-Titusville, FL
- Population (ZIP)
- 41,804
- Household income
- $79,977
- Rent vs Own
- Severe rent burden
- 697.0
Population outlook (Brevard County) Hauer SSP2
- Today (2025)
- 623,254 people
- By 2030
- 648,420 · +4.0%
- By 2040
- 690,009 · +10.7%
- By 2050
- 715,669 · +14.8%
- By 2075
- 775,744 · +24.5%
- By 2100
- 776,687 · +24.6%
Race, ethnicity, and origin ACS 2023
- Neighborhood character
- Diverse neighborhood (Simpson 0.70)
- Race & ethnicity
- White 46% Black 21% Hispanic / Latino 20% Two or more races 16% Asian 4%
- Hispanic origin (detail)
- Mexican 2% Puerto Rican 8% Cuban 5%
- Common ancestry
- Hispanic 3% Slovak 2% Lithuanian 2%
- Foreign-born
- 17% · Canada, China, Jamaica
- Languages at home
- 84% English-only · Spanish 9% French/Haitian/Cajun 4% Chinese 1%
Political lean MEDSL · Brevard
- 2024 margin
- Strong R (+20.8) · D 39.1% · R 59.9% · Other 1.0%
- 2008→2024 swing
- -10.4pp toward R · 2008: -10.4pp · 2024: -20.8pp
- All cycles
- 2024: R+20.8 2020: R+16.4 2016: R+19.8 2012: R+12.7 2008: R+10.4
Not yet ingested
- Civics
- —
Market trends
- HPI YoY
- ▲ 18.81%
- Current HPI
- 330.8595
- Rent YoY
- ▲ 3.67%
- Metro
- Palm Bay-Melbourne-Titusville, FL
- State GDP YoY
- ▲ 3.28%
- F500 in state
- 36
Industry mix (Fortune 500 HQ in FL)
| Industry | F500 HQs | Revenue |
|---|---|---|
| Industrial Technology | 2 | $29B |
|
||
| Insurance | 2 | $17B |
|
||
| Retail | 1 | $60B |
|
||
| Technology Distribution | 1 | $58B |
|
||
| Homebuilding | 1 | $35B |
|
||
| Technology Manufacturing | 1 | $35B |
|
||
Price history
+479.3% since first listed7 events — show timeline
- 2026-03-19 Listed $254,900 SCMLS
- 2014-01-17 Sold (MLS) $77,000 SCMLS
- 2013-10-16 Listed $84,900 SCMLS
- 1994-04-28 Sold (Public Records) $63,000 Public Records
- 1990-03-01 Sold (Public Records) $57,000 Public Records
- 1980-06-01 Sold (Public Records) $52,900 Public Records
- 1979-05-01 Sold (Public Records) $44,000 Public Records
Property tax history
+7.5%/yrLatest (2025): $3,272 · -2.8% YoY. Source: county tax records.
Cash-flow waterfall
monthlySold comps — $/sqft
last 12 mo · ≤1 miLoading sold comps…