2705 Overview Rd · Oak Trail Shores, TX
Flood risk 1/10 · Minimal
- FEMA flood zone
- X (unshaded)
- Chance of flooding over 30 yrs
- 0.0%
- Est. flood insurance / yr
- $507 – $1,088
Fire risk 5/10 · Moderate
- Est. fire insurance / yr
- $1,222 – $2,270
Heat risk 7/10 · Major
- Hot days now (above 108°F)
- 7 days/yr
- Hot days in 30 yrs
- 20 days/yr
Wind risk 6/10 · Moderate
- Chance of severe wind over 30 yrs
- 27.0%
Air-quality risk 2/10 · Minimal
- Unhealthy air days now
- 1 days/yr
- Unhealthy air days in 30 yrs
- 2 days/yr
Risk factors via First Street. Map © Google.
Why this score? — see what drove the C grade
The composite is a weighted blend of 9 inputs, each scored 0–100. Each bar is that input's sub-score; the figure is the points it added to the 100-point composite (weight × sub-score).
- Cash flow +28.2/30.0
- DSCR +10.0/10.0
- 1% rule +6.8/10.0
- Schools +4.0/10.0
- Livability +2.9/5.0
- Rent growth +2.8/5.0
- Condition / age +2.5/5.0
- ARV discount +1.9/15.0
- Appreciation +0.0/10.0
$165,000
🖨 Deal sheet 📄 Offer letter ✓ Due diligence
Listing remarks MLS
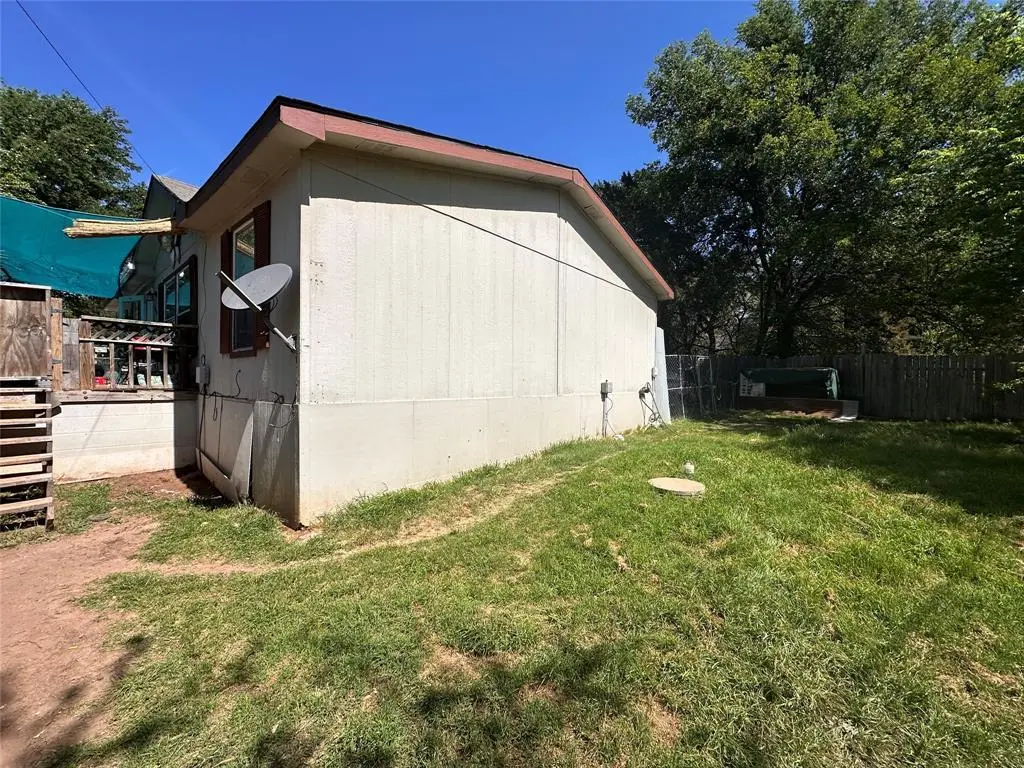
Motivated Sellers. Bring all offers. Welcome to 2705 Overview in Granbury, Texas—a well-maintained investment opportunity located in a desirable and growing area. This property offers strong rental potential with an established tenant already in place, making it an ideal addition to any investor’s portfolio. The home features a functional layout with comfortable living spaces, a well-appointed kitchen, and ample natural light throughout. The exterior provides a manageable yard and attractive curb appeal, contributing to long-term tenant satisfaction and retention. Conveniently located near local shopping, dining, and major thoroughfares, this property offers both accessibility and neighborhood appeal. Please note: The property is currently tenant-occupied. Showings will be scheduled only after receipt of a valid offer accompanied by a preapproval letter. Do not disturb tenant.
Key facts
- Established tenant
- Functional layout
- 2,178 sq ft lot
Tags
Neighborhood map
What this means for you Summary
Snapshot
- This is a 3-bed/2.0-bath manufactured listed at $165k.
Deal economics
- At list price, monthly cash flow is $525 ($6k/yr) — positive.
- The deal already cash-flows at list — no discount required.
- Meets the 1% rule at list price ($2k rent vs $165k).
- Recommended offer: $160k (3.0% below list) — sets the bar for market timing.
- Cap rate 10.1% vs local median 5.9% in Oak Trail Shores — top-decile yield for the area; either an underpriced asset or a hidden risk that comps aren't pricing in. Stress-test before assuming the spread holds.
Location & tenants
- Location reads 58/100 on livability (#1,187 in TX) — a working-class tenant base; expect higher turnover. Strengths: cost of living A+, housing A+, crime B+; Watch: health & safety D+, schools F, amenities F.
- Granbury ISD (town): math 46% / reading 46% proficiency, ranked #237 of 826 in TX (top 29%) — families likely to look elsewhere, expect single-tenant / working-renter base with shorter leases.
- Market conditions: Rents rising (+1.1%/yr); 929 active listings in the ZIP; 2 comparable units currently listed for rent nearby; 125 units permitted in Hood County in 2024 (0 in 5+ unit buildings).
- This rent runs 33% of the median local income ($70k/yr) — at the standard rent-burdened threshold; future hikes will face affordability resistance.
Forward outlook
- Local home prices are declining (-3.0%/yr); year-one equity from $1k of loan paydown is wiped out by about $5k of value loss. Plan a longer hold.
- Hood County population projected at +29% by 2050 — long-run rental-demand tailwind backs the buy-and-hold thesis.
Negotiation context
- It's been on market 59 days — a 3% lower offer ($160k) is reasonable based on typical stale-listing flexibility.
- 6 sale attempts since 17y ago; this cycle's ask has dropped $10k (6%) from the opening price — seller is motivated, your offer sets the floor, not the list.
Risks & watch-outs
- Climate carrying-cost: major wind risk, 27% chance of damaging wind over 30y; moderate wildfire risk; extreme-heat days projected 7→20/yr by 2055 (HVAC capex compounding) — expect insurance premiums to compound above CPI over the hold.
Questions for the listing agent
- It's been on market 59 days. Have you received any prior offers? Is the seller open to a 3% concession, seller financing, or rate buy-down credit?
- Is there a deadline driving the sale (1031 exchange, divorce, estate, relocation)? That informs how much negotiation room exists.
- Schools are F-rated, which usually means shorter tenancies and higher turnover. Who's the typical renter profile here, and what's been the actual vacancy rate?
- What's the average days-on-market for RENTAL listings here right now (not sales)? A rising rental-DOM trend means longer vacancies and softer asking-rent achievability than the comps imply.
- What's the recent tenant-quality profile in this submarket — average credit score on applications, eviction rate, late-payment / NSF rate, and stable-employment percentage? A property-management company in the area should have these aggregated.
- How much new for-sale + rental construction is in the pipeline within 1–3 miles? Heavy new supply typically softens prices + rents 12–24 months out; constrained supply supports both.
Investment metrics
- 1% rule
- 1.18% ✓
- Cap rate
- 10.11%
- Cash-on-cash
- 13.63%
- DSCR
- 1.61
- GRM
- 7.1
CMA / ARV
- ARV (median comp)
- $146,739
- List price
- $165,000
- Delta
- 12.44%
- Verdict
- OVERPRICED
- Comps
- 15 within 1.0 mi
Show comp detail 12 sales within ~0.75 mi
| Address | Dist | Beds/Ba | Sqft | Sold | Price | $/sf | Match |
|---|---|---|---|---|---|---|---|
| 2654 Edgecliff Ct | 0.10mi | 3/2.0 | 1,344 (-1%) | 12mo | $150,000 | $112 | 84 |
| 2703 Rockcliff Ct | 0.06mi | 3/2.0 | 1,368 (+1%) | 14mo | $120,000 | $88 | 84 |
| 2614 Sycamore Ct | 0.43mi | 3/2.0 | 1,344 (-1%) | 4mo | $175,000 | $130 | 75 |
| 3007 Oak Wood St | 0.45mi | 3/2.0 | 1,478 (+9%) | 5mo | $29,990 | $20 | 61 |
| 3001 Elmwood Dr | 0.38mi | 3/2.0 | 1,191 (-12%) | 4mo | $157,500 | $132 | 58 |
| 3806 Oak Meadow St | 0.49mi | 3/2.0 | 1,264 (-7%) | 11mo | $150,000 | $119 | 57 |
| 3210 Robinhood Dr | 0.71mi | 3/2.0 | 1,280 (-6%) | 1mo | $144,900 | $113 | 56 |
| 3011 Mistletoe St | 0.48mi | 3/2.0 | 1,216 (-10%) | 6mo | $139,400 | $115 | 55 |
| 2723 Cypress St | 0.67mi | 3/2.0 | 1,216 (-10%) | 2mo | $147,500 | $121 | 50 |
| 4425 W Oak Trl | 0.31mi | 3/2.0 | 1,159 (-15%) | 17mo | $149,900 | $129 | 47 |
| 4321 Terri Lee Ln | 0.71mi | 4/2.0 (+1) | 1,387 (+2%) | 19mo | $189,000 | $136 | 42 |
| 2606 Hilltop Rd | 0.61mi | 3/2.0 | 1,536 (+13%) | 23mo | $165,000 | $107 | 31 |
Match score weights: distance 35% · size 25% · config 20% · recency 20%. Top-matched comps best support the ARV.
Projected returns pro-forma
-3.0% appreciation · 1.1% rent growth · sell at horizon
- IRR
- 1.7%
- Equity multiple
- 1.06×
- Total profit
- $2,987
- Equity at exit
- $24,602
- IRR
- 9.5%
- Equity multiple
- 1.67×
- Total profit
- $31,032
- Equity at exit
- $14,266
Cash invested: $46,200 (down + closing). Projections, not guarantees.
Landlord ↔ Tenant lean methodology
- Overall (STATE)
- 87 Strongly Landlord-Friendly
- State Texas
- 87 Strongly Landlord-Friendly · R+5
- County
- — inherits STATE
- City
- — inherits STATE
ZIP-level market 76048
- Home prices YoY
- -23.4%
- Rents YoY
- 1.1%
- Active inventory
- 929
- Price-to-rent
- 7.1×
Monthly cashflow live
- Estimated rent
- $1,943 medium interval (Pro) →
- Mortgage (P&I)
- −$865
- Tax from tax record
- −$76 /mo · $911/yr
- Insurance
- −$69
- HOA
- −$0
- Vacancy / Maint / Mgmt
- −$408
- Net cashflow
- $525
Break-even live
UW: 25.0% down · 7.5% · 30yr · 1.5% tax · 5.0% vac · 8.0% maint · 8.0% mgmt
Financing live
Cash to close
- Down payment
- $41,250
- Closing costs
- $4,950
- Reserves months
- —
- Total cash needed
- —
Loan-product check · same deal, 3 products live
Conventional
25% down · 7.5% · 30yr
- Down + closing
- —
- Monthly P&I
- —
- Monthly cashflow
- —
- DSCR
- —
- Eligible?
- —
Personal DTI + credit; lowest rate.
DSCR
20% down · 8.5% · 30yr
- Down + closing
- —
- Monthly P&I
- —
- Monthly cashflow
- —
- DSCR
- —
- Eligible?
- —
No personal income docs; deal must DSCR.
Hard money
10% down · 12.0% · 12mo
- Down + closing
- —
- Monthly P&I
- —
- Monthly cashflow
- —
- DSCR
- —
- Eligible?
- —
Short-term bridge; refi at stabilization.
Rent comps 2 comps
| Address | Beds | Baths | Sqft | Rent | $/sqft | DOM | Units | Dist |
|---|---|---|---|---|---|---|---|---|
| 4321 Terri Lee Ln Granbury, TX | 4.0 | 2.0 | 1387 | $2,075 | $1.50 | 1d | 1 | 0.68mi |
| 3225 Evergreen Dr Granbury, TX | 3.0 | 1.0 | 916 | $1,425 | $1.56 | 1d | 1 | 0.86mi |
Listing history 30 events
-
2026-06-18days on market $165,000 Active 59 DOM
-
2026-06-17days on market $165,000 Active 58 DOM
-
2026-06-16days on market $165,000 Active 57 DOM
-
2026-06-15days on market $165,000 Active 56 DOM
-
2026-06-13pricedays on market $165,000 Active 54 DOM
-
2026-06-09days on market $175,000 Active 50 DOM
-
2026-06-08days on market $175,000 Active 49 DOM
-
2026-06-07days on market $175,000 Active 48 DOM
-
2026-06-04days on market $175,000 Active 45 DOM
-
2026-06-03days on market $175,000 Active 44 DOM
-
2026-06-02days on market $175,000 Active 43 DOM
-
2026-06-02days on market $175,000 Active 42 DOM
-
2026-05-31days on market $175,000 Active 41 DOM
-
2026-04-19$175,000 Active 913-char remark
Show marketing remark (913 chars)
Motivated Sellers. Bring all offers. Welcome to 2705 Overview in Granbury, Texas—a well-maintained investment opportunity located in a desirable and growing area. This property offers strong rental potential with an established tenant already in place, making it an ideal addition to any investor’s portfolio. The home features a functional layout with comfortable living spaces, a well-appointed kitchen, and ample natural light throughout. The exterior provides a manageable yard and attractive curb appeal, contributing to long-term tenant satisfaction and retention. Conveniently located near local shopping, dining, and major thoroughfares, this property offers both accessibility and neighborhood appeal. Please note: The property is currently tenant-occupied. Showings will be scheduled only after receipt of a valid offer accompanied by a preapproval letter. Do not disturb tenant.
-
2025-07-18historical $1,600
-
2025-06-02$1,600
-
2024-05-25historical $1,395
-
2023-11-16price $1,395
-
2023-09-03
-
2023-08-30historical
-
2022-01-12soldstatus
-
2015-10-05soldstatus Sold 303-char remark
Show marketing remark (303 chars)
Three bedroom two bath double wide on a lot in OTS. Home needs some TLC and is sold as is with no Seller repairs or warranties. Subject will be on the market for 3 days before submitting any offers to seller. Buyer to confirm all information concerning the property like lot size, room sizes, condition.
-
2015-09-04status Pending 303-char remark
Show marketing remark (303 chars)
Three bedroom two bath double wide on a lot in OTS. Home needs some TLC and is sold as is with no Seller repairs or warranties. Subject will be on the market for 3 days before submitting any offers to seller. Buyer to confirm all information concerning the property like lot size, room sizes, condition.
-
2015-08-28$35,000 Active 303-char remark
Show marketing remark (303 chars)
Three bedroom two bath double wide on a lot in OTS. Home needs some TLC and is sold as is with no Seller repairs or warranties. Subject will be on the market for 3 days before submitting any offers to seller. Buyer to confirm all information concerning the property like lot size, room sizes, condition.
-
2012-01-28historical
-
2011-10-31price $59,000
-
2011-07-27$75,000 Active
-
2009-10-15soldstatus
-
2009-07-28historical
-
2009-06-29$49,900
ⓘ Source: listings_history table (triggers on properties + properties_extension) + one-shot
backfill from property_details.listing_events for pre-trigger history.
Tax reassessment forecast TX · Resets to sale price
- Current annual tax
- $911 · $76/mo
- Projected year-2 tax
- $3,020 · $252/mo
- Expected delta
- +$2,108/yr (+$176/mo · 231.3%)
ⓘ Screening estimate from a state-policy table — verify with the county assessor before closing.
Climate risk First Street
- Flood 1/10 Low FEMA zone X (unshaded) · 0% chance over 30 yrs
- Wildfire 5/10 Major
- Heat 7/10 Severe 7 d/yr ≥108°F today · 20 d/yr by 30 yrs out
- Wind 6/10 Major 27% chance of damaging wind over 30 yrs
- Air quality 2/10 Low 1 unhealthy d/yr today · 2 by 30 yrs out
Nearby sold comps map
Loading sold comps map…
Walkable amenities ~0.75 mi
Loading nearby amenities…
Taxation est. · year 1
- Rental income
- $23,312
- − Mortgage interest
- −$9,243
- − Property taxes
- −$911
- − Insurance
- −$825
- − Repairs & maintenance
- −$1,865
- − Management
- −$1,865
- − Depreciation
- −$4,800
- Taxable income
- $3,803
- Est. tax owed @ 24.0%
- −$913
- After-tax cash flow
- $5,384/yr
For passive investors: Depreciation is non-cash, so a rental often shows a tax loss while cash-flowing — sheltering income. Rental losses are passive: they offset passive income freely, and up to $25,000/yr can offset ordinary (W-2) income if you actively participate and your MAGI is under $100k (phasing out to $0 by $150k); unused losses carry forward. On sale, claimed depreciation is recaptured at up to 25%, and gains may owe capital-gains tax (a 1031 exchange can defer both). Figures are a year-1 estimate at your 24.0% rate — not tax advice; consult a CPA.
Schools (NCES district)
- District
- Granbury ISD
- NCES district ID
- 4821390
- Math proficiency
- 46% ▬ 0.00%
- Reading proficiency
- 46% ▲ 4.00%
- Median HH income
- $55,856
- Composite
- 40.04/100
- National rank
- #3820
- State rank
- #237 of 826 in TX
Livability — Oak Trail Shores
- Score
- 58/100
- State rank
- #1187
- US rank
- #20758
Category grades
Schools grade is shown separately in the Schools card above.
Census & demographics
- Census place
- Oak Trail Shores, TX
- County
- Hood County · 58,506 people
- Metro
- Granbury, TX
- Population (ZIP)
- 27,000
- Household income
- $70,346
- Rent vs Own
- Severe rent burden
- 612.0
Population outlook (Hood County) Hauer SSP2
- Today (2025)
- 63,502 people
- By 2030
- 67,459 · +6.2%
- By 2040
- 74,958 · +18.0%
- By 2050
- 81,922 · +29.0%
- By 2075
- 98,872 · +55.7%
- By 2100
- 107,796 · +69.8%
Race, ethnicity, and origin ACS 2023
- Neighborhood character
- Predominantly White (80%)
- Race & ethnicity
- White 80% Hispanic / Latino 14% Two or more races 11% Black 1%
- Hispanic origin (detail)
- Mexican 13%
- Common ancestry
- Italian 2% Slovak 2% Portuguese 1%
- Foreign-born
- 4% · Canada
- Languages at home
- 89% English-only · Spanish 10%
Political lean MEDSL · Hood
- 2024 margin
- Solid R (+66.0) · D 16.6% · R 82.6%
- 2008→2024 swing
- -11.9pp toward R · 2008: -54.0pp · 2024: -66.0pp
- All cycles
- 2024: R+66.0 2020: R+64.1 2016: R+66.5 2012: R+64.7 2008: R+54.0
Not yet ingested
- Civics
- —
Market trends
- HPI YoY
- ▼ -83.25%
- Current HPI
- 272.2126
- Rent YoY
- ▲ 1.10%
- Metro
- Granbury, TX
- State GDP YoY
- ▲ 3.95%
- F500 in state
- 110
Industry mix (Fortune 500 HQ in TX)
| Industry | F500 HQs | Revenue |
|---|---|---|
| Energy | 16 | $1,198B |
|
||
| Technology | 5 | $198B |
|
||
| Engineering / Construction | 4 | $72B |
|
||
| Energy Services | 3 | $60B |
|
||
| Utilities | 3 | $41B |
|
||
| Healthcare | 2 | $330B |
|
||
Price history
+250.7% since first listed17 events — show timeline
- 2026-04-19 Listed $175,000 NTREIS
- 2025-07-18 Rental Removed $1,600 RentEngineListings
- 2025-06-02 Listed for Rent $1,600 RentEngineListings
- 2024-05-25 Rental Removed $1,395 BUILDIUM
- 2023-11-16 Price Changed $1,395 BUILDIUM
- 2023-09-03 Listed for Rent — BUILDIUM
- 2023-08-30 Rental Removed — BUILDIUM
- 2022-01-12 Sold (Public Records) — Public Records
- 2015-10-05 Sold (MLS) — NTREIS
- 2015-09-04 Pending — NTREIS
- 2015-08-28 Listed $35,000 NTREIS
- 2012-01-28 Listing Removed — NTREIS
- 2011-10-31 Price Changed $59,000 NTREIS
- 2011-07-27 Listed $75,000 NTREIS
- 2009-10-15 Sold (MLS) — NTREIS
- 2009-07-28 Listing Removed — NTREIS
- 2009-06-29 Listed $49,900 NTREIS
Property tax history
+1.1%/yrLatest (2025): $911 · -10.8% YoY. Source: county tax records.
Cash-flow waterfall
monthlySold comps — $/sqft
last 12 mo · ≤1 miLoading sold comps…