56 Streamview Dr · Harmony, ME
Flood risk No data
- FEMA flood zone
- —
- Chance of flooding over 30 yrs
- —
- Est. flood insurance / yr
- —
Fire risk No data
- Est. fire insurance / yr
- —
Heat risk No data
- Hot days now (above threshold)
- —
- Hot days in 30 yrs
- —
Wind risk No data
- Chance of severe wind over 30 yrs
- —
Air-quality risk No data
- Unhealthy air days now
- —
- Unhealthy air days in 30 yrs
- —
Risk factors via First Street. Map © Google.
Why this score? — see what drove the B grade
The composite is a weighted blend of 9 inputs, each scored 0–100. Each bar is that input's sub-score; the figure is the points it added to the 100-point composite (weight × sub-score).
- Cash flow +27.3/30.0
- DSCR +9.5/10.0
- Appreciation +9.0/10.0
- ARV discount +7.5/15.0
- 1% rule +6.6/10.0
- Schools +3.1/10.0
- Rent growth +2.5/5.0
- Livability +2.5/5.0
- Condition / age +2.5/5.0
$74,999
🖨 Deal sheet (PDF) 📄 Offer letter ✓ Due diligence
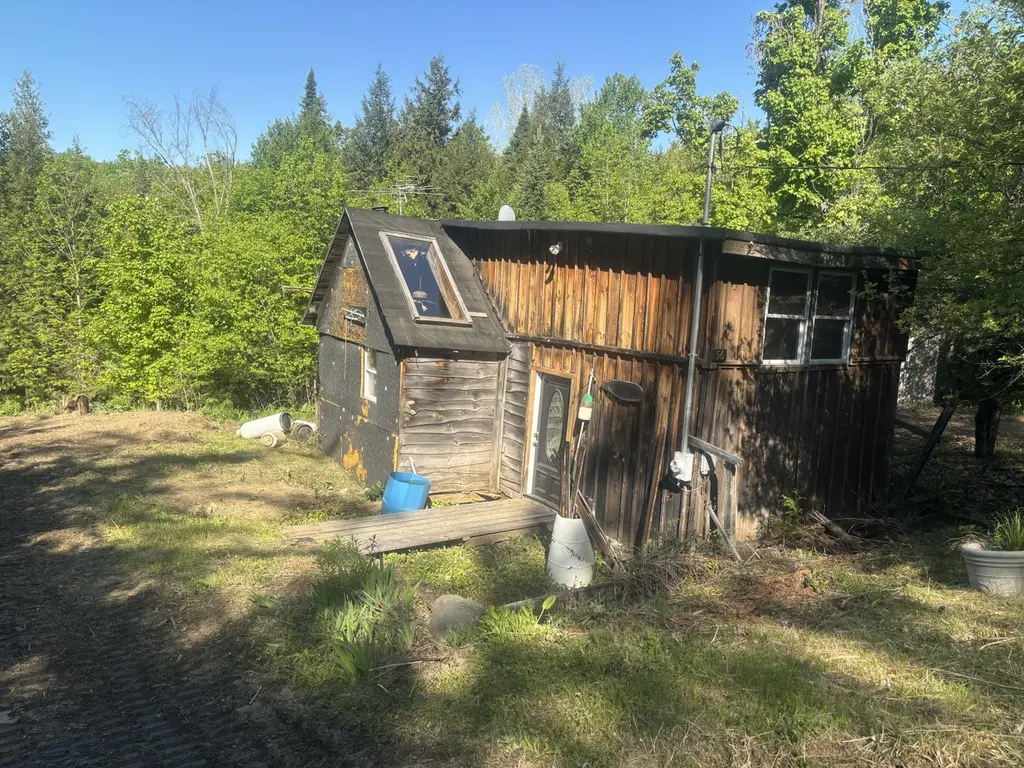
Listing remarks
This property offers waterfront living, swim, kayak, canoe, or sit by the fire and listen to the brook. Streamview drive is an established 4 season recreational access trail. Access major trails from your door step. The cabin has power, dug well, driveway, and many other upgrades. Live in the cabin the way that it is, or upgrade to your dream home. Come walk the recently flagged out lines, and let your imagination take over.
Key facts
- Major trails access
- Upgrades
- Driveway
Tags
Property features AI
Finance
- Financial info: Annual tax noted in records (details omitted per instructions)
Exterior
- Parking: Gravel parking with 1–4 spaces
- Utilities: Private water; Sewer: unknown; Electric: circuit breakers
- Home design: Single family residence; Entry level on the first floor
- Construction: Log and wood-frame construction with log and wood siding; Shingle roof; Originally built in 999 (year listed in records)
- Exterior features: Rural setting; Private road access; Waterfront on Higgins Brook with water view; Lot of about 5.3 acres
Interior
- Bathrooms: One full bathroom
- Heating & cooling: Wood stove heating
- Interior features: Two total rooms; Living room on the first floor; Kitchen on the first floor
Neighborhood map
What this means for you Summary
Snapshot
- This is a 1-bed/1.0-bath single-family listed at $75k.
Deal economics
- At list price, monthly cash flow is $218 ($3k/yr) — positive.
- The deal already cash-flows at list — no discount required.
- Meets the 1% rule at list price ($868 rent vs $75k).
Location & tenants
- Location reads: area grade B — affects rentability + tenant quality, not the cash-flow math above.
- Harmony Public Schools (rural): math 20% / reading 50% proficiency, ranked #152 of 185 in ME (top 82%) — families likely to look elsewhere, expect single-tenant / working-renter base with shorter leases.
- Zoned schools: Harmony Elementary (math 74% / reading 95%, grade A+, #105 of 294 statewide, top 35%, 58 students, 78% FRL) — zoned schools average 78% FRL vs 56% district-wide (22 pts higher); higher-poverty schools than district average — tighter screening recommended.
- Zoned-school proficiency averages 85% at this address vs 35% district-wide (+50 pts) — the actual schools serving this property are materially stronger than the Harmony Public Schools average implies; a family-tenant draw the district grade alone would hide.
- Market conditions: 18 active listings in the ZIP; 129 units permitted in Somerset County in 2024 (0 in 5+ unit buildings).
Forward outlook
- In year one you build about $7k of equity ($518 loan paydown + $6k appreciation (8.0% local appreciation)).
- Somerset County population projected at -25% by 2050 — secular population decline; favor cash flow + early exit over multi-decade hold.
- At projected returns (8.0% appreciation + 3.0% rent growth), your $21k cash investment doubles in ~3 years — after that, you're playing with house money.
- By year 6, paydown + projected appreciation supports a ~$37k cash-out refi (75% LTV) — recoverable capital for the next deal without selling this one.
Negotiation context
- Only 8 days on market — expect competitive offers; lowballing is unlikely to land.
- 2 sale attempts since 18y ago with the ask held roughly flat each time — persistent listings suggest the price (not the market) is what's stuck; bring a comps-based counter.
Questions for the listing agent
- Is there a deadline driving the sale (1031 exchange, divorce, estate, relocation)? That informs how much negotiation room exists.
- What's the average days-on-market for RENTAL listings here right now (not sales)? A rising rental-DOM trend means longer vacancies and softer asking-rent achievability than the comps imply.
- What's the recent tenant-quality profile in this submarket — average credit score on applications, eviction rate, late-payment / NSF rate, and stable-employment percentage? A property-management company in the area should have these aggregated.
- How much new for-sale + rental construction is in the pipeline within 1–3 miles? Heavy new supply typically softens prices + rents 12–24 months out; constrained supply supports both.
Investment metrics
- 1% rule
- 1.16% ✓
- Cap rate
- 9.78%
- Cash-on-cash
- 12.46%
- DSCR
- 1.55
- GRM
- 7.2
CMA / ARV
No comps found within radius.
Projected returns pro-forma
8.0% appreciation · 3.0% rent growth · sell at horizon
- IRR
- 29.7%
- Equity multiple
- 3.13×
- Total profit
- $44,758
- Equity at exit
- $56,968
- IRR
- 26.5%
- Equity multiple
- 6.69×
- Total profit
- $119,501
- Equity at exit
- $113,072
Cash invested: $21,000 (down + closing). Projections, not guarantees.
Landlord ↔ Tenant lean methodology
- Overall (STATE)
- 41 Moderately Tenant-Leaning
- State Maine
- 41 Moderately Tenant-Leaning · D+2
- County
- — inherits STATE
- City
- — inherits STATE
ZIP-level market 04942
- Home prices YoY
- 4.6%
- Active inventory
- 18
- Price-to-rent
- 7.2×
Monthly cashflow live
- Estimated rent
- $868 medium interval (Pro) →
- Mortgage (P&I)
- −$393
- Tax from tax record
- −$43 /mo · $516/yr
- Insurance
- −$31
- HOA
- −$0
- Vacancy / Maint / Mgmt
- −$182
- Net cashflow
- $218
Break-even live
Sensitivity live
| Price | -10% $261 | -5% $239 | +0% $218 | +5% $197 | +10% $176 |
|---|---|---|---|---|---|
| Rent | -10% $150 | -5% $184 | +0% $218 | +5% $252 | +10% $287 |
| Rate | -1.0pp $256 | -0.5pp $237 | base $218 | +0.5pp $199 | +1.0pp $179 |
UW: 25.0% down · 7.5% · 30yr · 1.5% tax · 5.0% vac · 8.0% maint · 8.0% mgmt
Financing live
Cash to close
- Down payment
- $18,750
- Closing costs
- $2,250
- Reserves months
- —
- Total cash needed
- —
Loan-product check · same deal, 3 products live
Conventional
25% down · 7.5% · 30yr
- Down + closing
- —
- Monthly P&I
- —
- Monthly cashflow
- —
- DSCR
- —
- Eligible?
- —
Personal DTI + credit; lowest rate.
DSCR
20% down · 8.5% · 30yr
- Down + closing
- —
- Monthly P&I
- —
- Monthly cashflow
- —
- DSCR
- —
- Eligible?
- —
No personal income docs; deal must DSCR.
Hard money
10% down · 12.0% · 12mo
- Down + closing
- —
- Monthly P&I
- —
- Monthly cashflow
- —
- DSCR
- —
- Eligible?
- —
Short-term bridge; refi at stabilization.
Listing history 7 events
-
2026-06-17status $74,999 Pending 8 DOM
-
2026-06-16days on market $74,999 Active 8 DOM
-
2026-06-15days on market $74,999 Active 7 DOM
-
2026-06-13days on market $74,999 Active 5 DOM
-
2026-06-12days on market $74,999 Active 4 DOM
-
2026-06-09remarks 431-char remark
-
2026-06-09$74,999 Active 1 DOM
ⓘ Source: listings_history table (triggers on properties + properties_extension) + one-shot
backfill from property_details.listing_events for pre-trigger history.
Tax reassessment forecast ME · Partial reset (capped growth)
- Current annual tax
- $516 · $43/mo
- Projected year-2 tax
- $768 · $64/mo
- Expected delta
- +$252/yr (+$21/mo · 48.8%)
ⓘ Screening estimate from a state-policy table — verify with the county assessor before closing.
Nearby sold comps map
Loading sold comps map…
Walkable amenities ~0.75 mi
Loading nearby amenities…
Taxation est. · year 1
- Rental income
- $10,415
- − Mortgage interest
- −$4,201
- − Property taxes
- −$516
- − Insurance
- −$375
- − Repairs & maintenance
- −$833
- − Management
- −$833
- − Depreciation
- −$2,182
- Taxable income
- $1,475
- Est. tax owed @ 24.0%
- −$354
- After-tax cash flow
- $2,263/yr
For passive investors: Depreciation is non-cash, so a rental often shows a tax loss while cash-flowing — sheltering income. Rental losses are passive: they offset passive income freely, and up to $25,000/yr can offset ordinary (W-2) income if you actively participate and your MAGI is under $100k (phasing out to $0 by $150k); unused losses carry forward. On sale, claimed depreciation is recaptured at up to 25%, and gains may owe capital-gains tax (a 1031 exchange can defer both). Figures are a year-1 estimate at your 24.0% rate — not tax advice; consult a CPA.
Schools (NCES district)
- District
- Harmony Public Schools
- NCES district ID
- 2306330
- Math proficiency
- 20% ▼ -20.00%
- Reading proficiency
- 50% ▬ 0.00%
- Median HH income
- $31,217
- Composite
- 31.13/100
- National rank
- #11285
- State rank
- #152 of 185 in ME
Livability — Harmony
No livability data for this city. (Only ~50 U.S. cities are tracked.)
Census & demographics
- Population (ZIP)
- 1,154
Population outlook (Somerset County) Hauer SSP2
- Today (2025)
- 48,335 people
- By 2030
- 46,268 · -4.3%
- By 2040
- 41,276 · -14.6%
- By 2050
- 36,137 · -25.2%
- By 2075
- 26,408 · -45.4%
- By 2100
- 18,836 · -61.0%
Race, ethnicity, and origin ACS 2023
- Neighborhood character
- Predominantly White (96%)
- Race & ethnicity
- White 96% Two or more races 2%
- Common ancestry
- Slovak 8% Lithuanian 8% Serbian 4%
- Foreign-born
- 3% · Canada, China
- Languages at home
- 98% English-only · French/Haitian/Cajun 1%
Political lean MEDSL · Somerset
- 2024 margin
- Strong R (+27.1) · D 35.6% · R 62.7% · Other 1.7%
- 2008→2024 swing
- -32.8pp toward R · 2008: 5.7pp · 2024: -27.1pp
- All cycles
- 2024: R+27.1 2020: R+23.4 2016: R+22.8 2012: D+1.7 2008: D+5.7
Not yet ingested
- Civics
- —
Market trends
- HPI YoY
- ▲ 8.00%
- Current HPI
- 182.5242
- Rent YoY
- —
- Metro
- —
- State GDP YoY
- —
- F500 in state
- 0
Price history
+61.3% since first listed2 events — show timeline
- 2026-06-08 Listed $74,999 MREIS
- 2008-01-12 Listed $46,500 MREIS
Property tax history
+0.4%/yrLatest (2018): $516 · +3.8% YoY. Source: county tax records.
Cash-flow waterfall
monthlySold comps — $/sqft
last 12 mo · ≤1 miLoading sold comps…