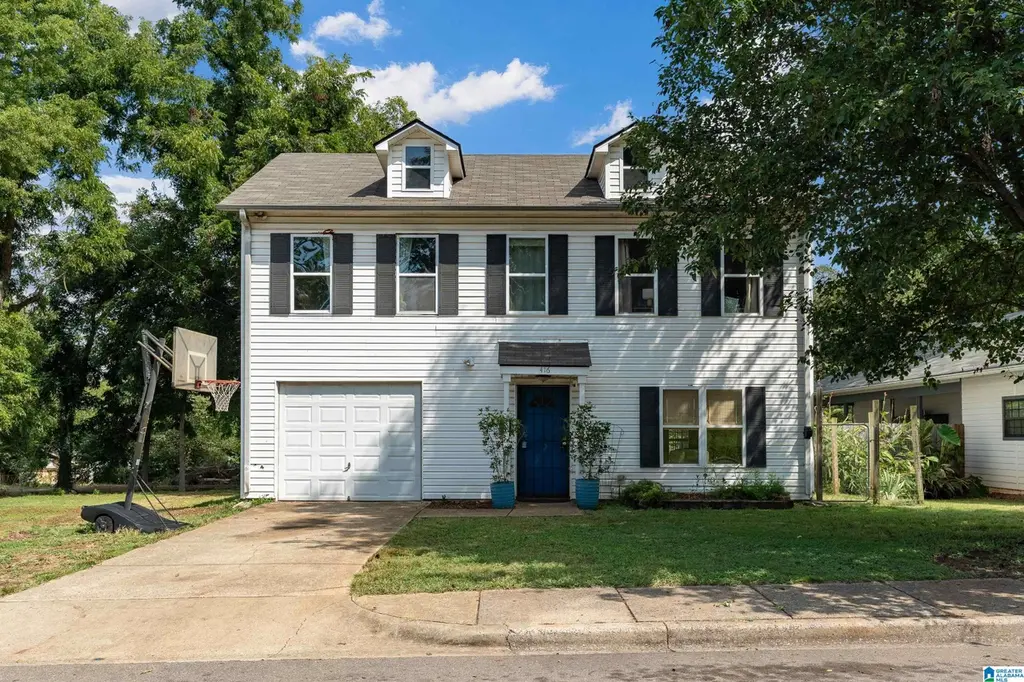
416 Iota Ave S · Birmingham, AL
Flood risk 1/10 · Minimal
- FEMA flood zone
- X (unshaded)
- Chance of flooding over 30 yrs
- 0.0%
- Est. flood insurance / yr
- $507 – $1,088
Fire risk 1/10 · Minimal
- Est. fire insurance / yr
- $916 – $1,700
Heat risk 7/10 · Major
- Hot days now (above 106°F)
- 7 days/yr
- Hot days in 30 yrs
- 19 days/yr
Wind risk 6/10 · Moderate
- Chance of severe wind over 30 yrs
- 27.0%
Air-quality risk 4/10 · Minor
- Unhealthy air days now
- 6 days/yr
- Unhealthy air days in 30 yrs
- 8 days/yr
Risk factors via First Street. Map © Google.
Why this score? — see what drove the C- grade
The composite is a weighted blend of 9 inputs, each scored 0–100. Each bar is that input's sub-score; the figure is the points it added to the 100-point composite (weight × sub-score).
- Cash flow +20.7/30.0
- ARV discount +11.3/15.0
- DSCR +6.6/10.0
- 1% rule +4.8/10.0
- Livability +3.4/5.0
- Rent growth +3.1/5.0
- Condition / age +2.5/5.0
- Schools +0.9/10.0
- Appreciation +0.0/10.0
$137,000
🖨 Deal sheet (PDF) 📄 Offer letter ✓ Due diligence
Listing remarks MLS
If you are looking for an investment, this traditional 3 bedroom/2 bath could just be the one with just some TLC. This 2 story home features vinyl siding, kitchen with lots of cabinet space, living room, dining room, double vanity bath and much more. COME SEE TODAY!! REO PROPERTY-BANK OWNED. PROPERTY SOLD AS IS. Seller makes no guarantees as property is sold AS-IS. Buyer or Buyer's Agent will be responsible for activation of utilities related to inspections.
Key facts
- Access to uab
- Private bath
- Open layout
Tags
Property features AI
Exterior
- Parking: Front garage entry; One garage space (main level); Driveway parking; On-street parking
- Utilities: Public water; Connected sewer; Electric water heater; Spectrum internet available
- Home design: Existing structure; Siding: Vinyl; Slab foundation; Minor subdivision: COX SURVEY
- Construction: Vinyl siding construction; Slab foundation
- Exterior features: Storage building; No pool; No patio; No decks; No garden/patio; Not waterfront
Interior
- Kitchen: Electric cooktop; Electric oven; Built-in dishwasher; Refrigerator; Laminate countertops
- Bedrooms: Two bedrooms on upper level; Living area on main level
- Flooring: Vinyl
- Bathrooms: Two full bathrooms; One half bath; Garden tub, separate shower, tub/shower combo, walk-in closets in baths/bed areas
- Heating & cooling: Central heating; Central cooling
- Interior features: Smooth ceilings; Vinyl floors; Laminate countertops; Cooktop (electric), Built-in dishwasher, Electric oven, Refrigerator; Attic; Tri-level: No; Split level: No; Split foyer: No; Loft: No
- Laundry & utility: Upper-level laundry in closet; Washer hookup; Electric dryer hookup
Neighborhood map
What this means for you Summary
Snapshot
- This is a 3-bed/2.0-bath single-family listed at $137k.
Deal economics
- At list price, monthly cash flow is $185 ($2k/yr) — positive.
- The deal already cash-flows at list — no discount required.
- To meet the 1% rule (rent ≥ 1% of price), the offer needs to be $134k (2.4% below list).
- Recommended offer: $134k (2.4% below list) — sets the bar for 1% rule.
- Cap rate 7.9% vs local median 6.2% in Birmingham — meaningfully above typical; check what's discounted (condition, days-on-market, listing class) to confirm the premium yield is real.
Location & tenants
- Location reads 67/100 on livability (#78 in AL) — a middle-class / working-renter tenant base. Strengths: commute A+, cost of living A+, housing A+; Watch: amenities C-, crime F, employment F.
- Birmingham City (urban): math 4% / reading 20% proficiency, ranked #116 of 129 in AL (top 90%) — low school quality limits family demand, transient renter base, plan for 1-2y turnover; 82% free/reduced lunch — lower-income household profile, screen leases tightly.
- Zoned schools: Washington K8 (math 5% / reading 18%, grade F, #556 of 627 statewide, top 89%, 567 students, 92% FRL); Parker High School (math 2% / reading 2%, grade F, #291 of 305 statewide, top 100%, 826 students, 90% FRL).
- Market conditions: Rents rising (+2.6%/yr); 124 active listings in the ZIP; 40 comparable units currently listed for rent nearby; rentals at typical pace (median 25d on market — plan ~3-4 weeks tenant-placement turnaround); 45% of comp listings sitting > 30 days — soft ceiling on asking rent; 2,114 units permitted in Jefferson County in 2024 (556 in 5+ unit buildings).
- This rent runs 31% of the median local income ($51k/yr) — at the standard rent-burdened threshold; future hikes will face affordability resistance.
Forward outlook
- Local home prices are declining (-3.0%/yr); year-one equity from $947 of loan paydown is wiped out by about $4k of value loss. Plan a longer hold.
- Jefferson County population projected to shrink 4% by 2050 — rents likely to lag national; underwrite the cash flow, not the appreciation.
Negotiation context
- It's been on market 19 days — a 2% lower offer ($135k) is reasonable based on typical stale-listing flexibility.
- 2 sale attempts since 13y ago with the ask held roughly flat each time — persistent listings suggest the price (not the market) is what's stuck; bring a comps-based counter.
- Current owner paid $82k; list at $137k implies a 66% gain — meaningful room to come down on a strong offer.
Risks & watch-outs
- Climate carrying-cost: major wind risk, 27% chance of damaging wind over 30y; extreme-heat days projected 7→19/yr by 2055 (HVAC capex compounding) — expect insurance premiums to compound above CPI over the hold.
Questions for the listing agent
- Is there a deadline driving the sale (1031 exchange, divorce, estate, relocation)? That informs how much negotiation room exists.
- Schools are F-rated, which usually means shorter tenancies and higher turnover. Who's the typical renter profile here, and what's been the actual vacancy rate?
- Crime grade is F in this area — have there been break-ins, vandalism, or insurance claims at this property in the last 3 years? What carrier currently insures it and at what premium?
- What's the average days-on-market for RENTAL listings here right now (not sales)? A rising rental-DOM trend means longer vacancies and softer asking-rent achievability than the comps imply.
- What's the recent tenant-quality profile in this submarket — average credit score on applications, eviction rate, late-payment / NSF rate, and stable-employment percentage? A property-management company in the area should have these aggregated.
- How much new for-sale + rental construction is in the pipeline within 1–3 miles? Heavy new supply typically softens prices + rents 12–24 months out; constrained supply supports both.
Investment metrics
- 1% rule
- 0.98% ✗
- Cap rate
- 7.91%
- Cash-on-cash
- 5.78%
- DSCR
- 1.26
- GRM
- 8.5
CMA / ARV
- ARV (on-the-fly)
- $149,760
- Comps found
- 12
Show comp detail 12 sales within ~0.75 mi
| Address | Dist | Beds/Ba | Sqft | Sold | Price | $/sf | Match |
|---|---|---|---|---|---|---|---|
| 457 Iota Ave S | 0.11mi | 3/2.0 | 1,537 (+7%) | 15mo | $160,000 | $104 | 71 |
| 50 1st Ave S | 0.40mi | 4/2.0 (+1) | 1,400 (-3%) | 4mo | $22,000 | $16 | 68 |
| 345 Iota Ave S | 0.06mi | 2/1.0 (-1) | 1,279 (-11%) | 4mo | $20,000 | $16 | 66 |
| 608 9th Ct S | 0.66mi | 3/2.0 | 1,496 (+4%) | 6mo | $268,000 | $179 | 58 |
| 31 4th Ave | 0.46mi | 3/1.0 | 1,540 (+7%) | 10mo | $80,000 | $52 | 55 |
| 9 6th Ave | 0.62mi | 3/2.0 | 1,326 (-8%) | 12mo | $120,000 | $90 | 48 |
| 529 10th Ave S | 0.72mi | 3/2.0 | 1,544 (+7%) | 8mo | $319,000 | $207 | 48 |
| 1724 1st Pl S | 0.69mi | 3/1.0 | 1,250 (-13%) | 1mo | $85,000 | $68 | 41 |
| 1724 Center St S | 0.75mi | 3/2.0 | 1,250 (-13%) | 4mo | $175,493 | $140 | 40 |
| 600 9th Ct S | 0.65mi | 4/2.0 (+1) | 1,328 (-8%) | 14mo | $204,500 | $154 | 40 |
| 530 10th Ave S | 0.69mi | 3/2.0 | 1,598 (+11%) | 13mo | $386,000 | $242 | 39 |
| 29 16th Ave S | 0.61mi | 3/1.5 | 1,652 (+15%) | 9mo | $45,000 | $27 | 37 |
Match score weights: distance 35% · size 25% · config 20% · recency 20%. Top-matched comps best support the ARV.
Projected returns pro-forma
-3.0% appreciation · 2.59% rent growth · sell at horizon
- IRR
- -7.8%
- Equity multiple
- 0.71×
- Total profit
- $-11,005
- Equity at exit
- $20,427
- IRR
- 1.2%
- Equity multiple
- 1.08×
- Total profit
- $3,232
- Equity at exit
- $11,845
Cash invested: $38,360 (down + closing). Projections, not guarantees.
Landlord ↔ Tenant lean methodology
- Overall (STATE)
- 90 Strongly Landlord-Friendly
- State Alabama
- 90 Strongly Landlord-Friendly · R+15
- County
- — inherits STATE
- City
- — inherits STATE
ZIP-level market 35205
- Rents YoY
- 2.6%
- Active inventory
- 124
- Price-to-rent
- 8.5×
Monthly cashflow live
- Estimated rent
- $1,337 high interval (Pro) →
- Mortgage (P&I)
- −$718
- Tax from tax record
- −$96 /mo · $1,149/yr
- Insurance
- −$57
- HOA
- −$0
- Vacancy / Maint / Mgmt
- −$281
- Net cashflow
- $185
Break-even live
Sensitivity live
| Price | -10% $262 | -5% $224 | +0% $185 | +5% $146 | +10% $107 |
|---|---|---|---|---|---|
| Rent | -10% $79 | -5% $132 | +0% $185 | +5% $238 | +10% $290 |
| Rate | -1.0pp $254 | -0.5pp $220 | base $185 | +0.5pp $149 | +1.0pp $113 |
UW: 25.0% down · 7.5% · 30yr · 1.5% tax · 5.0% vac · 8.0% maint · 8.0% mgmt
Financing live
Cash to close
- Down payment
- $34,250
- Closing costs
- $4,110
- Reserves months
- —
- Total cash needed
- —
Loan-product check · same deal, 3 products live
Conventional
25% down · 7.5% · 30yr
- Down + closing
- —
- Monthly P&I
- —
- Monthly cashflow
- —
- DSCR
- —
- Eligible?
- —
Personal DTI + credit; lowest rate.
DSCR
20% down · 8.5% · 30yr
- Down + closing
- —
- Monthly P&I
- —
- Monthly cashflow
- —
- DSCR
- —
- Eligible?
- —
No personal income docs; deal must DSCR.
Hard money
10% down · 12.0% · 12mo
- Down + closing
- —
- Monthly P&I
- —
- Monthly cashflow
- —
- DSCR
- —
- Eligible?
- —
Short-term bridge; refi at stabilization.
Rent comps 40 comps
| Address | Beds | Baths | Sqft | Rent | $/sqft | DOM | Units | Dist |
|---|---|---|---|---|---|---|---|---|
| 310 Gamma St S Birmingham, AL | 3.0 | 1.5 | 1001 | $1,200 | $1.20 | 17d | 1 | 0.14mi |
| 506 Alpha St S Birmingham, AL | 3.0 | 1.0 | 944 | $1,373 | $1.45 | 45d | 1 | 0.24mi |
| 112 Kappa Ave S Birmingham, AL | 3.0 | 2.0 | 1034 | $1,100 | $1.06 | 45d | 1 | 0.25mi |
| 451 2nd Ave N Birmingham, AL | 4.0 | 3.0 | 1400 | $1,600 | $1.14 | 25d | 1 | 0.38mi |
| 806 Gamma St S Birmingham, AL | 3.0 | 1.0 | 1252 | $1,200 | $0.96 | 45d | 1 | 0.54mi |
| 12 4th Ave SW Unit 1 Birmingham, AL | 3.0 | 1.0 | 1336 | $1,100 | $0.82 | 45d | 1 | 0.55mi |
| 451 2nd St N Birmingham, AL | 4.0 | 3.0 | 1400 | $1,600 | $1.14 | 45d | 1 | 0.80mi |
| 741 Center Pl SW Birmingham, AL | 3.0 | 1.0 | 1101 | $1,250 | $1.14 | 17d | 1 | 0.81mi |
| 1101 10th Pl S Birmingham, AL | 1.0–2.0 | 1.0–2.0 | 986 | $1,825 | $1.85 | 5d | 11 | 0.89mi |
| 413 Fulton Ave SW Birmingham, AL | 3.0 | 1.0 | 940 | $525 | $0.56 | 4d | 1 | 0.98mi |
| 856 Center Way SW Birmingham, AL | 3.0 | 2.0 | 1142 | $1,200 | $1.05 | 45d | 1 | 1.00mi |
| 1508 4th Ave S Birmingham, AL | 2.0 | 2.0 | 1142 | $2,222 | $1.95 | 5d | 3 | 1.09mi |
| 608 Fulton Ave SW Birmingham, AL | 3.0 | 1.0 | 1271 | $1,300 | $1.02 | 45d | 1 | 1.11mi |
| 1131 16th Ave S Unit A Birmingham, AL | 2.0 | 1.0 | 900 | $1,215 | $1.35 | 4d | 1 | 1.16mi |
| 644 Alabama Ave SW Birmingham, AL | 3.0 | 1.0 | 1274 | $1,125 | $0.88 | 25d | 1 | 1.21mi |
| 719 Washington Ave SW Birmingham, AL | 3.0 | 1.0 | 1064 | $950 | $0.89 | 13d | 1 | 1.23mi |
| 1701 1st Ave S Birmingham, AL | 1.0–2.0 | 1.0–2.0 | 889 | $2,506 | $2.82 | 4d | 21 | 1.28mi |
| 1425 13th St S Unit A Birmingham, AL | 2.0 | 1.0 | 1368 | $1,450 | $1.06 | 45d | 1 | 1.30mi |
| 624 4th Ct W Birmingham, AL | 3.0 | 1.5 | 992 | $1,250 | $1.26 | 45d | 1 | 1.32mi |
| 1417 13th Pl S Birmingham, AL | 2.0 | 2.0 | 1245 | $1,950 | $1.57 | 23d | 1 | 1.32mi |
| 1332 14th Ave S Birmingham, AL | 2.0 | 1.5 | 892 | $1,075 | $1.21 | 25d | 2 | 1.33mi |
| 1012 Cotton Ave SW Birmingham, AL | 3.0 | 1.0 | 1232 | $1,000 | $0.81 | 45d | 1 | 1.35mi |
| 1414 13th Ave S Birmingham, AL | 2.0 | 2.0 | 1039 | $1,772 | $1.71 | 20d | 2 | 1.37mi |
| 1414 13th Ave S Unit 1418 Birmingham, AL | 2.0 | 2.0 | 1039 | $1,700 | $1.64 | 45d | 1 | 1.37mi |
| 1414 13th Ave S Unit 1414 Birmingham, AL | 2.0 | 2.0 | 1039 | $1,694 | $1.63 | 45d | 1 | 1.37mi |
| 1228 15th St S Birmingham, AL | 3.0–4.0 | 3.0–4.0 | 1690 | $2,689 | $1.59 | 3d | 3 | 1.37mi |
| 1409 14th St S Birmingham, AL | 2.0 | 1.0 | 940 | $1,257 | $1.34 | 16d | 1 | 1.39mi |
| 724 4th Ct W Birmingham, AL | 3.0 | 1.0 | 1300 | $930 | $0.72 | 45d | 1 | 1.40mi |
| 120 19th St N Birmingham, AL | 1.0–2.0 | 1.0–2.0 | 886 | $2,190 | $2.47 | 3d | 14 | 1.42mi |
| 2217-2249 Green Springs Hwy Unit 2249-E Birmingham, AL | 2.0 | 1.0 | 900 | $910 | $1.01 | 45d | 1 | 1.43mi |
| 2217-2249 Green Springs Hwy Unit 2241-M Birmingham, AL | 3.0 | 2.0 | 1100 | $1,109 | $1.01 | 23d | 1 | 1.43mi |
| 617 7th St W Birmingham, AL | 3.0 | 1.5 | 1120 | $1,175 | $1.05 | 45d | 1 | 1.43mi |
| 410 8th Ter W Birmingham, AL | 3.0 | 1.0 | 1440 | $1,200 | $0.83 | 17d | 1 | 1.44mi |
| 120 19th St N Unit 312 Birmingham, AL | 2.0 | 2.0 | 952 | $3,495 | $3.67 | 45d | 1 | 1.44mi |
| 1404 17th Ave S Unit 2 Birmingham, AL | 2.0 | 1.0 | 900 | $1,160 | $1.29 | 45d | 1 | 1.48mi |
| 1327 16th St S Apt 4 Birmingham, AL | 2.0 | 1.0 | 921 | $1,110 | $1.21 | 25d | 1 | 1.49mi |
| 963 3rd St W Birmingham, AL | 3.0 | 2.0 | 1444 | $1,295 | $0.90 | 25d | 1 | 1.49mi |
| 854 5th St W Birmingham, AL | 3.0 | 1.0 | 1501 | $1,275 | $0.85 | 45d | 1 | 1.49mi |
| 1327 16th St S Unit 3 Birmingham, AL | 2.0 | 1.0 | 921 | $1,143 | $1.24 | 5d | 1 | 1.49mi |
| 1600 14th Ave S Unit 8 Birmingham, AL | 2.0 | 1.0 | 900 | $1,106 | $1.23 | 23d | 1 | 1.50mi |
Listing history 12 events
-
2026-06-21days on market $137,000 Active 19 DOM
-
2026-06-18days on market $137,000 Active 16 DOM
-
2026-06-17days on market $137,000 Active 15 DOM
-
2026-06-16days on market $137,000 Active 14 DOM
-
2026-06-15days on market $137,000 Active 13 DOM
-
2026-06-13days on market $137,000 Active 11 DOM
-
2026-06-10days on market $137,000 Active 8 DOM
-
2026-06-09days on market $137,000 Active 7 DOM
-
2026-06-08days on market $137,000 Active 6 DOM
-
2026-06-07days on market $137,000 Active 5 DOM
-
2026-06-02remarks 687-char remark
-
2026-06-02$137,000 Active 1 DOM
ⓘ Source: listings_history table (triggers on properties + properties_extension) + one-shot
backfill from property_details.listing_events for pre-trigger history.
Tax reassessment forecast AL · Resets to sale price
- Current annual tax
- $1,149 · $96/mo
- Projected year-2 tax
- $1,149 · $96/mo
- Expected delta
- $0/yr ($0/mo · 0.0%)
ⓘ Screening estimate from a state-policy table — verify with the county assessor before closing.
Climate risk First Street
- Flood 1/10 Low FEMA zone X (unshaded) · 0% chance over 30 yrs
- Wildfire 1/10 Low
- Heat 7/10 Severe 7 d/yr ≥106°F today · 19 d/yr by 30 yrs out
- Wind 6/10 Major 27% chance of damaging wind over 30 yrs
- Air quality 4/10 Moderate 6 unhealthy d/yr today · 8 by 30 yrs out
Nearby sold comps map
Loading sold comps map…
Walkable amenities ~0.75 mi
Loading nearby amenities…
Taxation est. · year 1
- Rental income
- $16,042
- − Mortgage interest
- −$7,674
- − Property taxes
- −$1,149
- − Insurance
- −$685
- − Repairs & maintenance
- −$1,283
- − Management
- −$1,283
- − Depreciation
- −$3,985
- Taxable loss
- −$18
- Est. tax savings @ 24.0%
- +$4
- After-tax cash flow
- $2,222/yr
For passive investors: Depreciation is non-cash, so a rental often shows a tax loss while cash-flowing — sheltering income. Rental losses are passive: they offset passive income freely, and up to $25,000/yr can offset ordinary (W-2) income if you actively participate and your MAGI is under $100k (phasing out to $0 by $150k); unused losses carry forward. On sale, claimed depreciation is recaptured at up to 25%, and gains may owe capital-gains tax (a 1031 exchange can defer both). Figures are a year-1 estimate at your 24.0% rate — not tax advice; consult a CPA.
Schools (NCES district)
- District
- Birmingham City
- NCES district ID
- 0100390
- Math proficiency
- 4% ▼ -17.00%
- Reading proficiency
- 20% ▼ -4.00%
- Median HH income
- $31,988
- Composite
- 9.49/100
- National rank
- #9850
- State rank
- #116 of 129 in AL
Livability — Birmingham
- Score
- 67/100
- State rank
- #78
- US rank
- #10412
Category grades
Schools grade is shown separately in the Schools card above.
Census & demographics
- Census place
- Birmingham, AL
- County
- Jefferson County · 527,445 people
- City population
- 210,422
- Metro
- Birmingham-Hoover, AL
- Population (ZIP)
- 18,858
- Household income
- $51,158
- Rent vs Own
- Severe rent burden
- 1468.0
Population outlook (Jefferson County) Hauer SSP2
- Today (2025)
- 669,185 people
- By 2030
- 669,694 · +0.1%
- By 2040
- 661,388 · -1.2%
- By 2050
- 643,086 · -3.9%
- By 2075
- 577,267 · -13.7%
- By 2100
- 474,758 · -29.1%
Race, ethnicity, and origin ACS 2023
- Neighborhood character
- Diverse neighborhood (Simpson 0.56)
- Race & ethnicity
- White 60% Black 26% Hispanic / Latino 5% Asian 5% Two or more races 4%
- Hispanic origin (detail)
- Mexican 3%
- Common ancestry
- Slovak 3% Italian 2% Serbian 2%
- Foreign-born
- 9% · Canada, China, Vietnam
- Languages at home
- 90% English-only · Spanish 4% Other Indo-European 2% Chinese 1%
Political lean MEDSL · Jefferson
- 2024 margin
- D (+10.4) · D 54.6% · R 44.2% · Other 1.2%
- 2008→2024 swing
- +5.4pp toward D · 2008: 5.1pp · 2024: 10.4pp
- All cycles
- 2024: D+10.4 2020: D+13.2 2016: D+7.2 2012: D+6.0 2008: D+5.1
Not yet ingested
- Civics
- —
Market trends
- HPI YoY
- ▼ -199.42%
- Current HPI
- 291.38
- Rent YoY
- ▲ 2.59%
- Metro
- Birmingham-Hoover, AL
- State GDP YoY
- ▲ 2.94%
- F500 in state
- 4
Industry mix (Fortune 500 HQ in AL)
| Industry | F500 HQs | Revenue |
|---|---|---|
| Financial Services | 1 | $8B |
|
||
| Healthcare | 1 | $5B |
|
||
Price history
+312.7% since first listed5 events — show timeline
- 2026-06-02 Listed $137,000 Greater Alabama MLS
- 2025-12-03 Price Changed $159,999 Greater Alabama MLS
- 2020-06-16 Sold (Public Records) $82,500 Public Records
- 2014-07-09 Sold (MLS) $33,739 Greater Alabama MLS
- 2013-09-04 Listed $33,200 Greater Alabama MLS
Property tax history
+2.9%/yrLatest (2025): $1,149 · +7.5% YoY. Source: county tax records.
Cash-flow waterfall
monthlySold comps — $/sqft
last 12 mo · ≤1 miLoading sold comps…