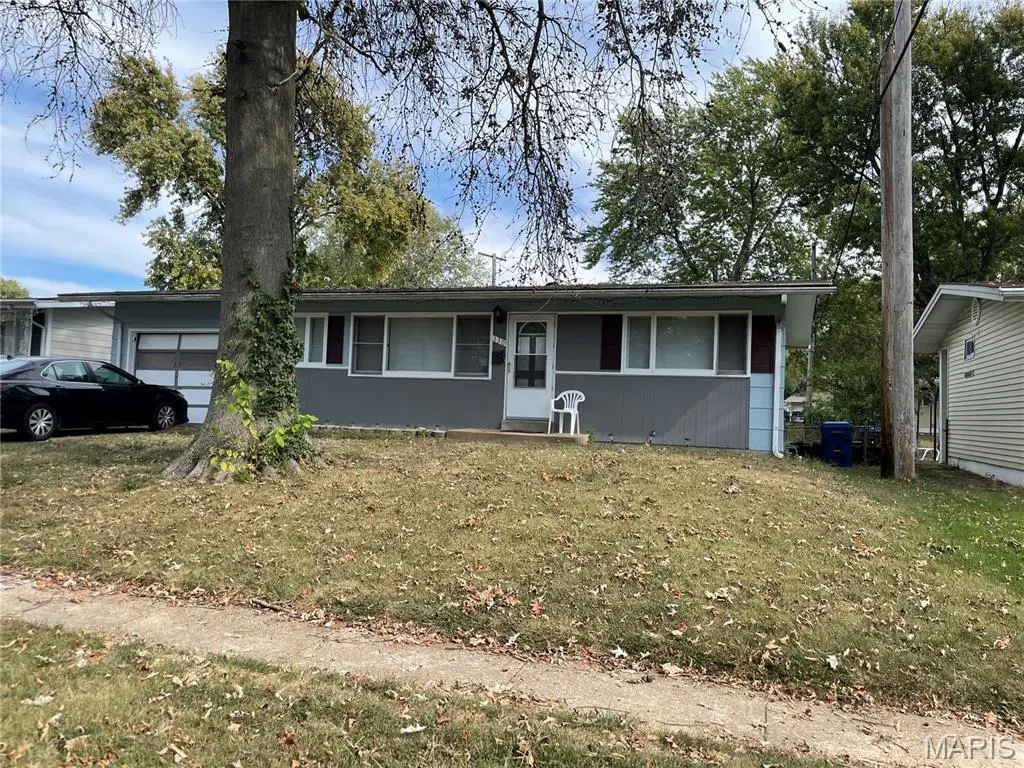
130 Dauphin Ln · Florissant, MO
Flood risk 1/10 · Minimal
- FEMA flood zone
- X (unshaded)
- Chance of flooding over 30 yrs
- 0.0%
- Est. flood insurance / yr
- $473 – $860
Fire risk 1/10 · Minimal
- Est. fire insurance / yr
- $1,054 – $1,958
Heat risk 5/10 · Moderate
- Hot days now (above 106°F)
- 7 days/yr
- Hot days in 30 yrs
- 21 days/yr
Wind risk 2/10 · Minimal
- Chance of severe wind over 30 yrs
- 1.0%
Air-quality risk 3/10 · Minor
- Unhealthy air days now
- 3 days/yr
- Unhealthy air days in 30 yrs
- 5 days/yr
Risk factors via First Street. Map © Google.
Why this score? — see what drove the A- grade
The composite is a weighted blend of 9 inputs, each scored 0–100. Each bar is that input's sub-score; the figure is the points it added to the 100-point composite (weight × sub-score).
- Cash flow +27.5/30.0
- ARV discount +15.0/15.0
- Appreciation +10.0/10.0
- DSCR +9.6/10.0
- 1% rule +7.3/10.0
- Rent growth +4.4/5.0
- Livability +3.7/5.0
- Condition / age +2.5/5.0
- Schools +1.2/10.0
$125,000
🖨 Deal sheet (PDF) 📄 Offer letter ✓ Due diligence
Listing remarks MLS
home is currently leased for $1,050 per month to long term tenant; lease expires 10/31/2026; nice 3 bedroom ranch with living room and large eat in kitchen; bathroom and kitchen updated; 200 amp panel, PVC waste stacks and Trane furnace; finished basement with family room and bonus room; level fenced yard with patio; new refrigerator in 2019; new dishwasher 2023; home is in good condition; property sold in its present "as is" condition; seller will not make any repairs nor provide any inspections;
Key facts
- Pvc waste stacks
- Large eat in kitchen
- Updated kitchen
Tags
Neighborhood map
What this means for you Summary
Snapshot
- This is a 3-bed/1.0-bath single-family listed at $125k.
Deal economics
- At list price, monthly cash flow is $369 ($4k/yr) — positive.
- The deal already cash-flows at list — no discount required.
- Meets the 1% rule at list price ($2k rent vs $125k).
- Recommended offer: $110k (12.0% below list) — sets the bar for market timing.
- Cap rate 9.8% vs local median 6.2% in Florissant — top-decile yield for the area; either an underpriced asset or a hidden risk that comps aren't pricing in. Stress-test before assuming the spread holds.
Location & tenants
- Location reads 73/100 on livability (#82 in MO) — a middle-class / working-renter tenant base. Strengths: cost of living A+, housing A+, health & safety B+; Watch: crime C-, amenities D+, commute F.
- Ferguson-Florissant R-II (suburban): math 7% / reading 20% proficiency, ranked #311 of 324 in MO (top 96%) — low school quality limits family demand, transient renter base, plan for 1-2y turnover; 70% free/reduced lunch — lower-income household profile, screen leases tightly.
- Zoned schools: Robinwood Elementary (math 11% / reading 25%, grade F, #962 of 1,115 statewide, top 86%, 312 students, 99% FRL); Cross Keys Middle (math 5% / reading 10%, grade F, #379 of 391 statewide, top 97%, 625 students, 100% FRL); Mccluer North High (math 5% / reading 28%, grade F, #487 of 521 statewide, top 93%, 1,136 students, 100% FRL) — zoned schools average 99% FRL vs 70% district-wide (30 pts higher); higher-poverty schools than district average — tighter screening recommended.
- Market conditions: Rents rising fast (+7.5%/yr); 224 active listings in the ZIP; 31 comparable units currently listed for rent nearby; rentals at typical pace (median 26d on market — plan ~3-4 weeks tenant-placement turnaround); 920 units permitted in St. Louis County in 2024 (250 in 5+ unit buildings).
Forward outlook
- In year one you build about $13k of equity ($864 loan paydown + $12k appreciation (10.0% local appreciation)).
- At projected returns (10.0% appreciation + 7.5% rent growth), your $35k cash investment doubles in ~2 years — after that, you're playing with house money.
- By year 3, paydown + projected appreciation supports a ~$34k cash-out refi (75% LTV) — recoverable capital for the next deal without selling this one.
Negotiation context
- It's been on market 245 days — a 12% lower offer ($110k) is reasonable based on typical stale-listing flexibility.
- Current owner paid $99k; 26% above their basis — modest negotiation headroom, anchor on the comps not their cost.
Risks & watch-outs
- Watch-outs: built in 1958 — expect roof / HVAC / electrical / plumbing capex.
- Climate carrying-cost: extreme-heat days projected 7→21/yr by 2055 (HVAC capex compounding) — expect insurance premiums to compound above CPI over the hold.
Questions for the listing agent
- It's been on market 245 days. Have you received any prior offers? Is the seller open to a 12% concession, seller financing, or rate buy-down credit?
- Built in 1958 — when were the roof, HVAC, electrical panel, plumbing, and water heater last replaced?
- Why hasn't it sold? Are there any deal-killer items the seller is aware of (foundation, flood, title, zoning, code violations)?
- Is there a deadline driving the sale (1031 exchange, divorce, estate, relocation)? That informs how much negotiation room exists.
- Schools are D-rated, which usually means shorter tenancies and higher turnover. Who's the typical renter profile here, and what's been the actual vacancy rate?
- What's the average days-on-market for RENTAL listings here right now (not sales)? A rising rental-DOM trend means longer vacancies and softer asking-rent achievability than the comps imply.
- What's the recent tenant-quality profile in this submarket — average credit score on applications, eviction rate, late-payment / NSF rate, and stable-employment percentage? A property-management company in the area should have these aggregated.
- How much new for-sale + rental construction is in the pipeline within 1–3 miles? Heavy new supply typically softens prices + rents 12–24 months out; constrained supply supports both.
Investment metrics
- 1% rule
- 1.23% ✓
- Cap rate
- 9.84%
- Cash-on-cash
- 12.65%
- DSCR
- 1.56
- GRM
- 6.8
CMA / ARV
- ARV (median comp)
- $154,691
- List price
- $125,000
- Delta
- -19.19%
- Verdict
- UNDERPRICED
- Comps
- 20 within 1.0 mi
Show comp detail 12 sales within ~0.75 mi
| Address | Dist | Beds/Ba | Sqft | Sold | Price | $/sf | Match |
|---|---|---|---|---|---|---|---|
| 190 Lynn Meadows Ln | 0.23mi | 3/1.0 | 864 (-3%) | 0mo | $119,900 | $139 | 84 |
| 105 Capri Dr | 0.20mi | 3/1.0 | 864 (-3%) | 7mo | $144,900 | $168 | 80 |
| 16 Montclair Ct | 0.17mi | 3/2.0 | 864 (-3%) | 4mo | $100,000 | $116 | 80 |
| 1125 Apache Dr | 0.27mi | 3/1.0 | 957 (+8%) | 1mo | $100,000 | $104 | 74 |
| 4 Saint James Ct | 0.40mi | 2/1.0 (-1) | 898 (+1%) | 7mo | $130,000 | $145 | 69 |
| 1145 S Waterford Dr | 0.20mi | 3/2.0 | 984 (+11%) | 4mo | $165,000 | $168 | 65 |
| 13 Saint Thomas Ct | 0.61mi | 3/1.0 | 912 (+3%) | 6mo | $135,000 | $148 | 62 |
| 1285 Acredale Dr | 0.58mi | 3/2.0 | 960 (+8%) | 0mo | $160,000 | $167 | 55 |
| 1210 Saint Richard Dr | 0.52mi | 2/1.0 (-1) | 791 (-11%) | 2mo | $115,000 | $145 | 51 |
| 1950 Washington St | 0.45mi | 2/2.0 (-1) | 792 (-11%) | 6mo | $20,000 | $25 | 47 |
| 210 Derhake Rd | 0.69mi | 2/1.0 (-1) | 792 (-11%) | 2mo | $109,900 | $139 | 43 |
| 1185 Saint Matthew Dr | 0.72mi | 2/1.0 (-1) | 792 (-11%) | 5mo | $128,000 | $162 | 40 |
Match score weights: distance 35% · size 25% · config 20% · recency 20%. Top-matched comps best support the ARV.
Projected returns pro-forma
10.0% appreciation · 7.51% rent growth · sell at horizon
- IRR
- 35.7%
- Equity multiple
- 3.82×
- Total profit
- $98,859
- Equity at exit
- $112,610
- IRR
- 32.3%
- Equity multiple
- 9.29×
- Total profit
- $290,316
- Equity at exit
- $242,848
Cash invested: $35,000 (down + closing). Projections, not guarantees.
Landlord ↔ Tenant lean methodology
- Overall (STATE)
- 81 Strongly Landlord-Friendly
- State Missouri
- 81 Strongly Landlord-Friendly · R+10
- County
- — inherits STATE
- City
- — inherits STATE
ZIP-level market 63033
- Home prices YoY
- 2.5%
- Rents YoY
- 7.5%
- Active inventory
- 224
- Price-to-rent
- 6.8×
Monthly cashflow live
- Estimated rent
- $1,532 high interval (Pro) →
- Mortgage (P&I)
- −$656
- Tax from tax record
- −$133 /mo · $1,599/yr
- Insurance
- −$52
- HOA
- −$0
- Lot rent
- −$0
- Vacancy / Maint / Mgmt
- −$322
- Net cashflow
- $369
Break-even live
Sensitivity live
| Price | -10% $440 | -5% $404 | +0% $369 | +5% $334 | +10% $298 |
|---|---|---|---|---|---|
| Rent | -10% $248 | -5% $309 | +0% $369 | +5% $430 | +10% $490 |
| Rate | -1.0pp $432 | -0.5pp $401 | base $369 | +0.5pp $337 | +1.0pp $304 |
UW: 25.0% down · 7.5% · 30yr · 1.5% tax · 5.0% vac · 8.0% maint · 8.0% mgmt
Financing live
Cash to close
- Down payment
- $31,250
- Closing costs
- $3,750
- Reserves months
- —
- Total cash needed
- —
Loan-product check · same deal, 3 products live
Conventional
25% down · 7.5% · 30yr
- Down + closing
- —
- Monthly P&I
- —
- Monthly cashflow
- —
- DSCR
- —
- Eligible?
- —
Personal DTI + credit; lowest rate.
DSCR
20% down · 8.5% · 30yr
- Down + closing
- —
- Monthly P&I
- —
- Monthly cashflow
- —
- DSCR
- —
- Eligible?
- —
No personal income docs; deal must DSCR.
Hard money
10% down · 12.0% · 12mo
- Down + closing
- —
- Monthly P&I
- —
- Monthly cashflow
- —
- DSCR
- —
- Eligible?
- —
Short-term bridge; refi at stabilization.
Rent comps 31 comps
| Address | Beds | Baths | Sqft | Rent | $/sqft | DOM | Units | Dist |
|---|---|---|---|---|---|---|---|---|
| 50 Lynn Meadows Ln Florissant, MO | 3.0 | 1.0 | 864 | $1,450 | $1.68 | 26d | 1 | 0.22mi |
| 1050 Ozment Dr Florissant, MO | 3.0 | 2.0 | 984 | $1,525 | $1.55 | 46d | 1 | 0.26mi |
| 1095 Ozment Dr Florissant, MO | 3.0 | 2.0 | 984 | $1,461 | $1.48 | 26d | 1 | 0.32mi |
| 765 Bobbins Ln Florissant, MO | 3.0 | 1.0 | 1107 | $1,450 | $1.31 | 46d | 1 | 0.44mi |
| 297 Saint Eugene Ln Florissant, MO | 2.0 | 1.0 | 1100 | $1,100 | $1.00 | 46d | 1 | 0.58mi |
| 1465 W Duchesne Dr Florissant, MO | 3.0 | 1.0 | 896 | $1,500 | $1.67 | 46d | 1 | 0.61mi |
| 1502 Summer Run Dr #108 Florissant, MO | 2.0 | 1.5 | 922 | $1,200 | $1.30 | 26d | 1 | 0.65mi |
| 1670 Arundel Dr Florissant, MO | 3.0 | 2.0 | 1012 | $1,450 | $1.43 | 26d | 1 | 0.67mi |
| 1600 Washington St Florissant, MO | 3.0 | 1.5 | 1095 | $1,250 | $1.14 | 22d | 1 | 0.75mi |
| 1180 S New Florissant Rd Florissant, MO | 3.0 | 1.0 | 925 | $1,225 | $1.32 | 26d | 1 | 0.77mi |
| 24 Barto Dr Saint Louis, MO | 3.0 | 1.0 | 864 | $1,400 | $1.62 | 46d | 1 | 0.77mi |
| 20 Saint Benedict Ln Florissant, MO | 3.0 | 1.5 | 1092 | $1,525 | $1.40 | 22d | 1 | 0.81mi |
| 36 Connolly Dr Saint Louis, MO | 3.0 | 1.0 | 1024 | $1,149 | $1.12 | 26d | 1 | 0.83mi |
| 11 Anistasia Dr Saint Louis, MO | 3.0 | 1.5 | 1120 | $1,345 | $1.20 | 26d | 1 | 0.85mi |
| 1725 Saint Catherine St Florissant, MO | 3.0 | 1.0 | 1107 | $1,700 | $1.54 | 1d | 1 | 0.90mi |
| 221 Barto Dr Saint Louis, MO | 3.0 | 2.0 | 958 | $1,295 | $1.35 | 22d | 1 | 0.96mi |
| 107 Anistasia Dr Saint Louis, MO | 2.0 | 2.0 | 1030 | $1,400 | $1.36 | 26d | 1 | 0.96mi |
| 46 Bascom Dr Saint Louis, MO | 2.0 | 1.0 | 932 | $1,175 | $1.26 | 46d | 1 | 1.01mi |
| 220 Du Bourg Ln Florissant, MO | 2.0 | 1.0 | 816 | $1,150 | $1.41 | 46d | 1 | 1.08mi |
| 241 Flora Dr Saint Louis, MO | 2.0 | 1.0 | 703 | $1,075 | $1.53 | 26d | 1 | 1.11mi |
| 153 Bascom Dr Saint Louis, MO | 3.0 | 1.0 | 1076 | $1,195 | $1.11 | 22d | 1 | 1.13mi |
| 171 Elbring Dr Saint Louis, MO | 3.0 | 1.5 | 1008 | $1,395 | $1.38 | 14d | 1 | 1.13mi |
| 24 Vierling Dr Saint Louis, MO | 2.0 | 1.0 | 850 | $1,290 | $1.52 | 10d | 1 | 1.15mi |
| 263 Sadonia Ave Saint Louis, MO | 3.0 | 2.0 | 888 | $1,350 | $1.52 | 46d | 1 | 1.25mi |
| 260 Sadonia Ave Saint Louis, MO | 3.0 | 2.0 | 1088 | $1,623 | $1.49 | 22d | 1 | 1.26mi |
| 135 Saint Maurice Ln Florissant, MO | 3.0 | 1.0 | 816 | $1,395 | $1.71 | 46d | 1 | 1.27mi |
| 1004 N New Florissant Rd Florissant, MO | 2.0 | 1.0 | 719 | $1,375 | $1.91 | 26d | 1 | 1.30mi |
| 7025 Richwood Ln Hazelwood, MO | 3.0 | 1.0 | 936 | $1,375 | $1.47 | 20d | 1 | 1.33mi |
| 1045 N New Florissant Rd Florissant, MO | 2.0 | 1.0 | 783 | $1,250 | $1.60 | 17d | 1 | 1.34mi |
| 305 S Lafayette St Florissant, MO | 3.0 | 1.0 | 864 | $1,384 | $1.60 | 1d | 1 | 1.44mi |
| 8507 Tally Ho Dr Hazelwood, MO | 2.0 | 1.5 | 1478 | $1,300 | $0.88 | 46d | 5 | 1.44mi |
Listing history 21 events
-
2026-06-22days on market $125,000 Active 245 DOM
-
2026-06-21pricedays on market $125,000 Active 244 DOM
-
2026-06-18days on market $135,000 Active 241 DOM
-
2026-06-17days on market $135,000 Active 240 DOM
-
2026-06-16days on market $135,000 Active 239 DOM
-
2026-06-15days on market $135,000 Active 238 DOM
-
2026-06-13days on market $135,000 Active 236 DOM
-
2026-06-13days on market $135,000 Active 235 DOM
-
2026-06-09days on market $135,000 Active 232 DOM
-
2026-06-08days on market $135,000 Active 231 DOM
-
2026-06-07days on market $135,000 Active 230 DOM
-
2026-06-05days on market $135,000 Active 227 DOM
-
2026-06-03days on market $135,000 Active 226 DOM
-
2026-06-02days on market $135,000 Active 225 DOM
-
2026-06-01days on market $135,000 Active 224 DOM
-
2026-05-31days on market $135,000 Active 223 DOM
-
2025-12-05price $135,000 516-char remark
Show marketing remark (516 chars)
home is currently leased for $1,050 per month to long term tenant; lease expires 10/31/2026; nice 3 bedroom ranch with living room and large eat in kitchen; bathroom and kitchen updated; 200 amp panel, PVC waste stacks and Trane furnace; finished basement with family room and bonus room; level fenced yard with patio; new refrigerator in 2019; new dishwasher 2023; home is in good condition; property sold in its present "as is" condition; seller will not make any repairs nor provide any inspections;
-
2025-10-20$350,000 Active 516-char remark
Show marketing remark (516 chars)
home is currently leased for $1,050 per month to long term tenant; lease expires 10/31/2026; nice 3 bedroom ranch with living room and large eat in kitchen; bathroom and kitchen updated; 200 amp panel, PVC waste stacks and Trane furnace; finished basement with family room and bonus room; level fenced yard with patio; new refrigerator in 2019; new dishwasher 2023; home is in good condition; property sold in its present "as is" condition; seller will not make any repairs nor provide any inspections;
-
2004-10-22soldstatus $98,900
-
2000-06-01soldstatus $64,900
-
1990-02-01soldstatus
ⓘ Source: listings_history table (triggers on properties + properties_extension) + one-shot
backfill from property_details.listing_events for pre-trigger history.
Tax reassessment forecast MO · Resets to sale price
- Current annual tax
- $1,599 · $133/mo
- Projected year-2 tax
- $1,599 · $133/mo
- Expected delta
- $0/yr ($0/mo · 0.0%)
ⓘ Screening estimate from a state-policy table — verify with the county assessor before closing.
Climate risk First Street
- Flood 1/10 Low FEMA zone X (unshaded) · 0% chance over 30 yrs
- Wildfire 1/10 Low
- Heat 5/10 Major 7 d/yr ≥106°F today · 21 d/yr by 30 yrs out
- Wind 2/10 Low 100% chance of damaging wind over 30 yrs
- Air quality 3/10 Moderate 3 unhealthy d/yr today · 5 by 30 yrs out
Nearby sold comps map
Loading sold comps map…
Walkable amenities ~0.75 mi
Loading nearby amenities…
Taxation est. · year 1
- Rental income
- $18,379
- − Mortgage interest
- −$7,002
- − Property taxes
- −$1,599
- − Insurance
- −$625
- − Repairs & maintenance
- −$1,470
- − Management
- −$1,470
- − Depreciation
- −$3,636
- Taxable income
- $2,576
- Est. tax owed @ 24.0%
- −$618
- After-tax cash flow
- $3,811/yr
For passive investors: Depreciation is non-cash, so a rental often shows a tax loss while cash-flowing — sheltering income. Rental losses are passive: they offset passive income freely, and up to $25,000/yr can offset ordinary (W-2) income if you actively participate and your MAGI is under $100k (phasing out to $0 by $150k); unused losses carry forward. On sale, claimed depreciation is recaptured at up to 25%, and gains may owe capital-gains tax (a 1031 exchange can defer both). Figures are a year-1 estimate at your 24.0% rate — not tax advice; consult a CPA.
Schools (NCES district)
- District
- Ferguson-Florissant R-II
- NCES district ID
- 2912010
- Math proficiency
- 7% ▼ -9.00%
- Reading proficiency
- 20% ▼ -6.00%
- Median HH income
- $44,610
- Composite
- 11.96/100
- National rank
- #9666
- State rank
- #311 of 324 in MO
Livability — Florissant
- Score
- 73/100
- State rank
- #82
- US rank
- #5406
Category grades
Schools grade is shown separately in the Schools card above.
Census & demographics
- Census place
- Florissant, MO
- County
- Saint Louis County · 888,823 people
- City population
- 69,104
- Metro
- St. Louis, MO-IL
- Population (ZIP)
- 43,056
- Household income
- $66,776
- Rent vs Own
- Severe rent burden
- 1429.0
Population outlook (St. Louis County) Hauer SSP2
- Today (2025)
- 1,025,227 people
- By 2030
- 1,028,023 · +0.3%
- By 2040
- 1,020,940 · -0.4%
- By 2050
- 1,007,280 · -1.8%
- By 2075
- 987,277 · -3.7%
- By 2100
- 921,984 · -10.1%
Race, ethnicity, and origin ACS 2023
- Neighborhood character
- Predominantly Black (71%)
- Race & ethnicity
- Black 71% White 23% Two or more races 4% Hispanic / Latino 1%
- Common ancestry
- Romanian 1% Lithuanian 1% Italian 1%
- Foreign-born
- 3% · Canada, Vietnam
- Languages at home
- 95% English-only · Spanish 1% French/Haitian/Cajun 1%
Political lean MEDSL · St. Louis
- 2024 margin
- Strong D (+23.4) · D 60.8% · R 37.4% · Other 1.7%
- 2008→2024 swing
- +3.5pp toward D · 2008: 19.9pp · 2024: 23.4pp
- All cycles
- 2024: D+23.4 2020: D+24.0 2016: D+16.2 2012: D+13.7 2008: D+19.9
Not yet ingested
- Civics
- —
Market trends
- HPI YoY
- ▲ 13.78%
- Current HPI
- 570.6
- Rent YoY
- ▲ 7.51%
- Metro
- St. Louis, MO-IL
- State GDP YoY
- ▲ 1.84%
- F500 in state
- 20
Industry mix (Fortune 500 HQ in MO)
| Industry | F500 HQs | Revenue |
|---|---|---|
| Healthcare | 1 | $163B |
|
||
| Insurance | 1 | $21B |
|
||
| Industrial Technology | 1 | $17B |
|
||
| Retail | 1 | $16B |
|
||
| Industrial Distribution | 1 | $10B |
|
||
| Utilities | 1 | $9B |
|
||
Price history
+108.0% since first listed5 events — show timeline
- 2025-12-05 Price Changed $135,000 MARIS as Distributed by MLS Grid
- 2025-10-20 Listed $350,000 MARIS as Distributed by MLS Grid
- 2004-10-22 Sold (Public Records) $98,900 Public Records
- 2000-06-01 Sold (Public Records) $64,900 Public Records
- 1990-02-01 Sold (Public Records) — Public Records
Property tax history
+0.5%/yrLatest (2022): $1,599 · +1.7% YoY. Source: county tax records.
Cash-flow waterfall
monthlySold comps — $/sqft
last 12 mo · ≤1 miLoading sold comps…