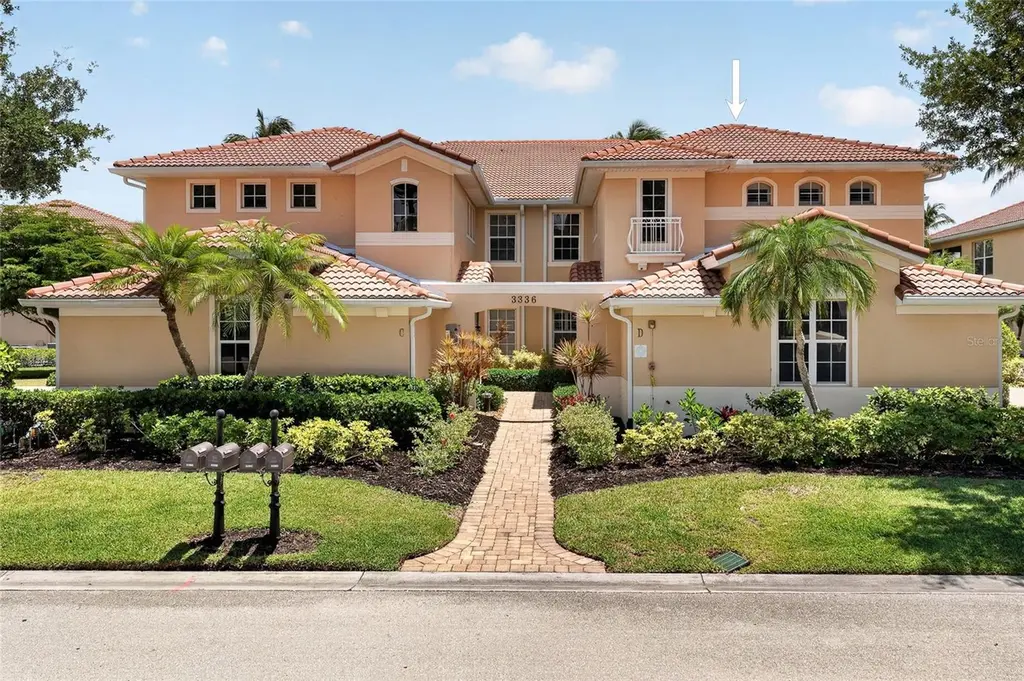
3336 Sunset Key Cir Unit D · Burnt Store Marina, FL
Flood risk 8/10 · Major
- FEMA flood zone
- X (shaded)
- Chance of flooding over 30 yrs
- 0.98%
- Est. flood insurance / yr
- $507 – $1,088
Fire risk 4/10 · Minor
- Est. fire insurance / yr
- $947 – $1,759
Heat risk 10/10 · Severe
- Hot days now (above 107°F)
- 7 days/yr
- Hot days in 30 yrs
- 30 days/yr
Wind risk 10/10 · Severe
- Chance of severe wind over 30 yrs
- 99.0%
Air-quality risk 3/10 · Minor
- Unhealthy air days now
- 2 days/yr
- Unhealthy air days in 30 yrs
- 2 days/yr
Risk factors via First Street. Map © Google.
Why this score? — see what drove the D grade
The composite is a weighted blend of 9 inputs, each scored 0–100. Each bar is that input's sub-score; the figure is the points it added to the 100-point composite (weight × sub-score).
- Cash flow +12.7/30.0
- ARV discount +7.5/15.0
- 1% rule +6.1/10.0
- Schools +4.1/10.0
- DSCR +3.8/10.0
- Livability +3.6/5.0
- Rent growth +2.5/5.0
- Condition / age +2.5/5.0
- Appreciation +0.0/10.0
$469,000
🖨 Deal sheet (PDF) 📄 Offer letter ✓ Due diligence
Listing remarks
LUXURY RESORT-STYLE LIVING IN THE EXCLUSIVE PROSPERITY POINTE AT BURNT STORE MARINA! Welcome to this beautifully maintained 3 BEDROOM + DEN/OFFICE, 2 BATHROOM, 2 CAR GARAGE TURN-KEY CONDO located in one of Southwest Florida’s most desirable gated waterfront communities. Offering the perfect blend of elegance, comfort, and lifestyle amenities, this home is ideal for those seeking the ultimate Florida retreat. Located in the HIGHLY DESIRABLE Prosperity Pointe section of Burnt Store Marina, residents enjoy access to a HEATED ISLAND POOL & SPA, scenic LAGOON WALKING PATHS, and a BEAUTIFUL ONE-MILE BOARDWALK surrounding Prosperity Pointe Island—perfect for morning walks or suns
Key facts
- Heated island pool
- Lagoon walking paths
- One-mile boardwalk
Tags
Property features AI
Finance
- Other: Total annual fees (multi-family): $12,310; total monthly fees: $1,025.83
- Financial info: Turnkey (furnished); Lease restrictions apply
- HOA & community: HOA managed by Alliant Property Management; Monthly condo fee: $788 (land included); Monthly HOA amount: $138.33; annual association fees listed; Association fees cover 24-hour guard, cable TV, pool, reserves, fidelity bond, insurance, building and grounds maintenance, management, and pest control; Community amenities: pool, tennis courts, sidewalks, street lights, deed restrictions, special community restrictions, golf carts allowed; Buyer approval required; Pets allowed (max 100 lbs)
Exterior
- Parking: Attached 2-car garage (20 x 18)
- Security: 24-hour guard included in association amenities
- Utilities: Public water; Public sewer; Electricity connected; Broadband/high-speed internet available
- Home design: Residential condominium; Two stories (unit on 2nd floor); Entry faces northeast
- Construction: Block and stucco construction; Tile roof; Slab foundation; Built as part of a multi-story building
- Exterior features: Covered patio/porch; Front porch; Rear porch; Hurricane shutters; Private mailbox; Rain gutters; Mature landscaping with trees
Interior
- Kitchen: Cooktop; Range; Microwave; Refrigerator
- Bedrooms: 3 bedrooms
- Flooring: Carpet; Ceramic tile
- Bathrooms: 2 full bathrooms
- Heating & cooling: Central heating (electric); Central air conditioning
- Interior features: Ceiling fans; Eat-in kitchen; High ceilings; Kitchen/family room combo; Living room/dining room combo; Open floorplan; Split bedroom layout; Stone counters; Tray ceiling; Vaulted ceilings; Walk-in closets; Window treatments
- Laundry & utility: Inside laundry room; Washer; Dryer
Neighborhood map
What this means for you Summary
Snapshot
- This is a 3-bed/2.0-bath condo listed at $469k.
Deal economics
- At list price, monthly cash flow is $-117 ($-1k/yr) — negative.
- To cash-flow at today's rent, offer at most $448k (4.4% below list).
- Meets the 1% rule at list price ($5k rent vs $469k).
- Recommended offer: $448k (4.4% below list) — sets the bar for cash-flow.
- Cap rate 6.2% vs local median 4.8% in Burnt Store Marina — meaningfully above typical; check what's discounted (condition, days-on-market, listing class) to confirm the premium yield is real.
Location & tenants
- Location reads 72/100 on livability (#354 in FL) — a middle-class / working-renter tenant base. Strengths: crime A+, employment A+, housing A+; Watch: cost of living C-, amenities F, commute F.
- Lee (suburban): math 47% / reading 50% proficiency, ranked #42 of 73 in FL (top 58%) — families likely to look elsewhere, expect single-tenant / working-renter base with shorter leases.
- Zoned schools: Hector A. Cafferata Jr Elementary School (math 45% / reading 46%, grade D-, #1,247 of 2,144 statewide, top 59%, 723 students, 62% FRL); Challenger Middle School (math 59% / reading 56%, grade B, #157 of 571 statewide, top 28%, 1,124 students, 50% FRL); Mariner High School (math 31% / reading 40%, grade F, #367 of 667 statewide, top 57%, 1,852 students, 42% FRL).
- Market conditions: 1490 active listings in the ZIP; 14 comparable units currently listed for rent nearby; rentals at typical pace (median 26d on market — plan ~3-4 weeks tenant-placement turnaround); solid renter incomes; 15,411 units permitted in Lee County in 2024 (4,686 in 5+ unit buildings).
- At $5,224/mo this rent would consume 81% of the median local household income ($77k/yr) (locally 226% of renters already pay >50% of income on rent) — very limited rent-growth headroom before tenants either downsize or default.
Forward outlook
- Local home prices are declining (-3.0%/yr); year-one equity from $3k of loan paydown is wiped out by about $14k of value loss. Plan a longer hold.
- Lee County population projected at +44% by 2050 — long-run rental-demand tailwind backs the buy-and-hold thesis.
Negotiation context
- It's been on market 44 days — a 3% lower offer ($455k) is reasonable based on typical stale-listing flexibility.
Risks & watch-outs
- Watch-outs: flood insurance adds $66/mo.
- Climate carrying-cost: severe flood risk; severe wind risk, 99% chance of damaging wind over 30y; extreme-heat days projected 7→30/yr by 2055 (HVAC capex compounding) — expect insurance premiums to compound above CPI over the hold.
Questions for the listing agent
- What do current leases actually rent for vs. the listed asking? Can we see a recent rent roll and the last 12 months of T-12 income?
- It's been on market 44 days. Have you received any prior offers? Is the seller open to a 4% concession, seller financing, or rate buy-down credit?
- What's the actual annual flood-insurance premium (NFIP or private), and is the property in a SFHA with mandatory coverage?
- What does the HOA fee cover, when was the last increase, and are there any pending special assessments or reserve-fund shortfalls?
- Any open or pending special assessments — roof, HVAC, plumbing, elevator, façade? What's the per-unit balance and payoff schedule, and is the seller paying it off at close or rolling it to the buyer?
- Is there a deadline driving the sale (1031 exchange, divorce, estate, relocation)? That informs how much negotiation room exists.
- The area grade is low — what's the realistic commute time and amenity access for the typical tenant pool here? Any planned neighborhood developments (good or bad) we should know about?
- What's the average days-on-market for RENTAL listings here right now (not sales)? A rising rental-DOM trend means longer vacancies and softer asking-rent achievability than the comps imply.
- What's the recent tenant-quality profile in this submarket — average credit score on applications, eviction rate, late-payment / NSF rate, and stable-employment percentage? A property-management company in the area should have these aggregated.
- How much new apartment / multifamily construction is in the pipeline within 1–3 miles? Heavy new supply (>2% of stock underway) typically softens rents 12–24 months out; light construction supports rent growth.
Investment metrics
- 1% rule
- 1.11% ✓
- Cap rate
- 6.16%
- Cash-on-cash
- -0.46%
- DSCR
- 0.98
- GRM
- 7.5
CMA / ARV
No comps found within radius.
Projected returns pro-forma
-3.0% appreciation · 3.0% rent growth · sell at horizon
- IRR
- -17.9%
- Equity multiple
- 0.37×
- Total profit
- $-82,752
- Equity at exit
- $69,929
- IRR
- -9.7%
- Equity multiple
- 0.40×
- Total profit
- $-78,828
- Equity at exit
- $40,551
Cash invested: $131,320 (down + closing). Projections, not guarantees.
Landlord ↔ Tenant lean methodology
- Overall (STATE)
- 87 Strongly Landlord-Friendly
- State Florida
- 87 Strongly Landlord-Friendly · R+3
- County
- — inherits STATE
- City
- — inherits STATE
ZIP-level market 33955
- Home prices YoY
- -24.5%
- Active inventory
- 1490
- Price-to-rent
- 7.5×
Monthly cashflow live
- Estimated rent
- $5,224 high interval (Pro) →
- Mortgage (P&I)
- −$2,459
- Tax from tax record
- −$498 /mo · $5,970/yr
- Insurance
- −$195
- Flood insurance flood zone
- −$66 /mo · $798/yr
- HOA
- −$1,025
- Vacancy / Maint / Mgmt
- −$1,097
- Net cashflow
- $-117
Break-even live
Sensitivity live
| Price | -10% $149 | -5% $16 | +0% $-117 | +5% $-250 | +10% $-382 |
|---|---|---|---|---|---|
| Rent | -10% $-530 | -5% $-323 | +0% $-117 | +5% $89 | +10% $296 |
| Rate | -1.0pp $119 | -0.5pp $2 | base $-117 | +0.5pp $-238 | +1.0pp $-362 |
UW: 25.0% down · 7.5% · 30yr · 1.5% tax · 5.0% vac · 8.0% maint · 8.0% mgmt
Financing live
Cash to close
- Down payment
- $117,250
- Closing costs
- $14,070
- Reserves months
- —
- Total cash needed
- —
Loan-product check · same deal, 3 products live
Conventional
25% down · 7.5% · 30yr
- Down + closing
- —
- Monthly P&I
- —
- Monthly cashflow
- —
- DSCR
- —
- Eligible?
- —
Personal DTI + credit; lowest rate.
DSCR
20% down · 8.5% · 30yr
- Down + closing
- —
- Monthly P&I
- —
- Monthly cashflow
- —
- DSCR
- —
- Eligible?
- —
No personal income docs; deal must DSCR.
Hard money
10% down · 12.0% · 12mo
- Down + closing
- —
- Monthly P&I
- —
- Monthly cashflow
- —
- DSCR
- —
- Eligible?
- —
Short-term bridge; refi at stabilization.
Rent comps 14 comps
| Address | Beds | Baths | Sqft | Rent | $/sqft | DOM | Units | Dist |
|---|---|---|---|---|---|---|---|---|
| 3313 Sunset Key Cir Punta Gorda, FL | 3.0 | 2.0–3.0 | 2089 | $6,750 | $3.23 | 25d | 4 | 0.12mi |
| 3313 Sunset Key Cir Unit Reservation spot 1 Punta Gorda, FL | 2.0 | 2.0 | 2099 | $2,750 | $1.31 | 25d | 1 | 0.12mi |
| 3304 Sunset Key Cir Unit D Punta Gorda, FL | 3.0 | 2.0 | 2255 | $5,750 | $2.55 | 25d | 1 | 0.13mi |
| 3471 Sunset Key Cir #102 Punta Gorda, FL | 3.0 | 2.0 | 1991 | $5,750 | $2.89 | 25d | 1 | 0.20mi |
| 3270 Southshore Dr Unit 72B Punta Gorda, FL | 3.0 | 2.0 | 2069 | $5,750 | $2.78 | 25d | 1 | 0.23mi |
| 3250 Southshore Dr Unit 54B Punta Gorda, FL | 3.0 | 2.0 | 2069 | $5,750 | $2.78 | 25d | 1 | 0.26mi |
| 3280 Southshore Dr Unit 87A Punta Gorda, FL | 3.0 | 2.0 | 2069 | $4,000 | $1.93 | 25d | 1 | 0.26mi |
| 17849 Hibiscus Cove Ct #1 Punta Gorda, FL | 3.0 | 2.0 | 1937 | $6,250 | $3.23 | 25d | 1 | 0.35mi |
| 1010 Islamorada Blvd Punta Gorda, FL | 3.0 | 2.0 | 1592 | $4,700 | $2.95 | 25d | 1 | 0.83mi |
| 24417 Baltic Ave #1102 Punta Gorda, FL | 2.0 | 2.0 | 1788 | $5,250 | $2.94 | 25d | 1 | 1.20mi |
| 17434 Oro Ct Punta Gorda, FL | 3.0 | 2.5 | 1864 | $2,000 | $1.07 | 22d | 1 | 1.22mi |
| 17314 Cape Horn Blvd Punta Gorda, FL | 3.0 | 2.0 | 2216 | $2,800 | $1.26 | 15d | 1 | 1.24mi |
| 2091 King Tarpon Dr Punta Gorda, FL | 3.0 | 2.0 | 1640 | $5,200 | $3.17 | 25d | 1 | 1.30mi |
| 3001 King Tarpon Dr Punta Gorda, FL | 3.0 | 2.0 | 1734 | $5,500 | $3.17 | 25d | 1 | 1.30mi |
HOA detail condo
- Monthly dues
- $1,025 · $12,300/yr
- Likely covers
- waterpoolsecurity
- Assessments
- None detected in remarks — confirm with the listing agent.
Listing history 14 events
-
2026-06-22days on market $469,000 Active 44 DOM
-
2026-06-17days on market $469,000 Active 40 DOM
-
2026-06-16days on market $469,000 Active 39 DOM
-
2026-06-15days on market $469,000 Active 38 DOM
-
2026-06-13days on market $469,000 Active 36 DOM
-
2026-06-10days on market $469,000 Active 33 DOM
-
2026-06-09days on market $469,000 Active 32 DOM
-
2026-06-08days on market $469,000 Active 31 DOM
-
2026-06-07days on market $469,000 Active 30 DOM
-
2026-06-03days on market $469,000 Active 26 DOM
-
2026-06-02days on market $469,000 Active 25 DOM
-
2026-06-01days on market $469,000 Active 24 DOM
-
2026-05-31days on market $469,000 Active 23 DOM
-
2026-05-08$469,000 Active
ⓘ Source: listings_history table (triggers on properties + properties_extension) + one-shot
backfill from property_details.listing_events for pre-trigger history.
Tax reassessment forecast FL · Resets to sale price
- Current annual tax
- $5,970 · $498/mo
- Projected year-2 tax
- $5,970 · $498/mo
- Expected delta
- $0/yr ($0/mo · 0.0%)
ⓘ Screening estimate from a state-policy table — verify with the county assessor before closing.
Climate risk First Street
- Flood 8/10 Severe FEMA zone X (shaded) · 98% chance over 30 yrs
- Wildfire 4/10 Moderate
- Heat 10/10 Extreme 7 d/yr ≥107°F today · 30 d/yr by 30 yrs out
- Wind 10/10 Extreme 99% chance of damaging wind over 30 yrs
- Air quality 3/10 Moderate 2 unhealthy d/yr today · 2 by 30 yrs out
Nearby sold comps map
Loading sold comps map…
Walkable amenities ~0.75 mi
Loading nearby amenities…
Taxation est. · year 1
- Rental income
- $62,687
- − Mortgage interest
- −$26,271
- − Property taxes
- −$5,970
- − Insurance
- −$3,142
- − Repairs & maintenance
- −$5,015
- − Management
- −$5,015
- − HOA
- −$12,300
- − Depreciation
- −$13,644
- Taxable loss
- −$8,670
- Est. tax savings @ 24.0%
- +$2,081
- After-tax cash flow
- $677/yr
For passive investors: Depreciation is non-cash, so a rental often shows a tax loss while cash-flowing — sheltering income. Rental losses are passive: they offset passive income freely, and up to $25,000/yr can offset ordinary (W-2) income if you actively participate and your MAGI is under $100k (phasing out to $0 by $150k); unused losses carry forward. On sale, claimed depreciation is recaptured at up to 25%, and gains may owe capital-gains tax (a 1031 exchange can defer both). Figures are a year-1 estimate at your 24.0% rate — not tax advice; consult a CPA.
Schools (NCES district)
- District
- Lee
- NCES district ID
- 1201080
- Math proficiency
- 47% ▼ -11.00%
- Reading proficiency
- 50% ▼ -4.00%
- Median HH income
- $49,518
- Composite
- 41.49/100
- National rank
- #3458
- State rank
- #42 of 73 in FL
Livability — Burnt Store Marina
- Score
- 72/100
- State rank
- #354
- US rank
- #6145
Category grades
Schools grade is shown separately in the Schools card above.
Census & demographics
- Census place
- Burnt Store Marina, FL
- County
- Charlotte County · 196,994 people
- Metro
- Punta Gorda, FL
- Population (ZIP)
- 12,399
- Household income
- $76,943
- Rent vs Own
- Severe rent burden
- 226.0
Population outlook (Lee County) Hauer SSP2
- Today (2025)
- 871,946 people
- By 2030
- 955,468 · +9.6%
- By 2040
- 1,113,587 · +27.7%
- By 2050
- 1,256,891 · +44.1%
- By 2075
- 1,560,270 · +78.9%
- By 2100
- 1,726,848 · +98.0%
Race, ethnicity, and origin ACS 2023
- Neighborhood character
- Predominantly White (84%)
- Race & ethnicity
- White 84% Hispanic / Latino 10% Two or more races 9% Black 2%
- Hispanic origin (detail)
- Mexican 4% Puerto Rican 2% Cuban 4%
- Common ancestry
- Romanian 5% Italian 3% Serbian 3%
- Foreign-born
- 8% · Canada
- Languages at home
- 91% English-only · Spanish 5% Other Indo-European 1%
Political lean MEDSL · Lee
- 2024 margin
- Strong R (+28.4) · D 35.5% · R 63.9%
- 2008→2024 swing
- -18.0pp toward R · 2008: -10.4pp · 2024: -28.4pp
- All cycles
- 2024: R+28.4 2020: R+19.2 2016: R+20.4 2012: R+16.6 2008: R+10.4
Not yet ingested
- Civics
- —
Market trends
- HPI YoY
- ▼ -78.71%
- Current HPI
- 242.9043
- Rent YoY
- —
- Metro
- Punta Gorda, FL
- State GDP YoY
- ▲ 3.28%
- F500 in state
- 36
Industry mix (Fortune 500 HQ in FL)
| Industry | F500 HQs | Revenue |
|---|---|---|
| Industrial Technology | 2 | $29B |
|
||
| Insurance | 2 | $17B |
|
||
| Retail | 1 | $60B |
|
||
| Technology Distribution | 1 | $58B |
|
||
| Homebuilding | 1 | $35B |
|
||
| Technology Manufacturing | 1 | $35B |
|
||
Price history
1 event — show timeline
- 2026-05-08 Listed $469,000 Stellar MLS as Distributed by MLS Grid
Property tax history
+4.1%/yrLatest (2025): $5,970 · +5.3% YoY. Source: county tax records.
Cash-flow waterfall
monthlySold comps — $/sqft
last 12 mo · ≤1 miLoading sold comps…