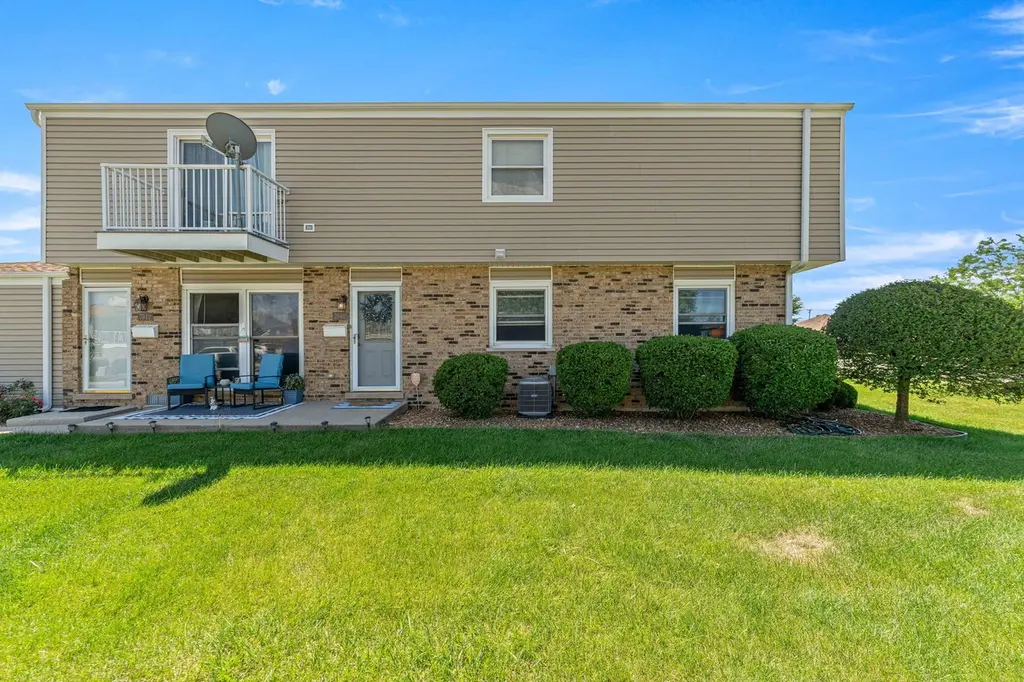
7940 163 Pl #7940 · Tinley Park, IL
Flood risk 1/10 · Minimal
- FEMA flood zone
- X (unshaded)
- Chance of flooding over 30 yrs
- 0.0%
- Est. flood insurance / yr
- $507 – $1,088
Fire risk 1/10 · Minimal
- Est. fire insurance / yr
- $804 – $1,492
Heat risk 3/10 · Minor
- Hot days now (above 102°F)
- 7 days/yr
- Hot days in 30 yrs
- 15 days/yr
Wind risk 2/10 · Minimal
- Chance of severe wind over 30 yrs
- —
Air-quality risk 4/10 · Minor
- Unhealthy air days now
- 4 days/yr
- Unhealthy air days in 30 yrs
- 5 days/yr
Risk factors via First Street. Map © Google.
Why this score? — see what drove the D+ grade
The composite is a weighted blend of 9 inputs, each scored 0–100. Each bar is that input's sub-score; the figure is the points it added to the 100-point composite (weight × sub-score).
- Cash flow +16.7/30.0
- ARV discount +7.5/15.0
- 1% rule +5.7/10.0
- DSCR +5.2/10.0
- Livability +3.7/5.0
- Schools +3.4/10.0
- Rent growth +2.5/5.0
- Condition / age +2.5/5.0
- Appreciation +0.0/10.0
$209,000
🖨 Deal sheet (PDF) 📄 Offer letter ✓ Due diligence
Listing remarks
Charming 2-bedroom, 1-bath condo that truly feels like home! This desirable one-level unit offers easy, stair-free living and features an attached 1-car garage for added convenience. The updated kitchen boasts granite countertops and stainless steel Samsung appliances, while the Maytag washer and dryer provide the convenience of in-unit laundry. All appliances are less than four years old, offering modern style and peace of mind. Ideally located in the heart of Tinley Park, you'll be just minutes from shopping, dining, entertainment, and the Metra, making commuting and errands a breeze. A wonderful opportunity to enjoy comfort, convenience, and a fantastic location all in one place!
Key facts
- Attached garage
- In-unit laundry
- Updated kitchen
Tags
Property features AI
Finance
- Other: Parcel number: 27243070011022
- HOA & community: Monthly association fee of $234; Association fee covers exterior maintenance, lawn care, and snow removal; Pets allowed (cats and dogs) with max pet weight of 40 lbs
Exterior
- Parking: Attached garage (1-car)
- Utilities: Water source: Lake Michigan; Public sewer
- Home design: Attached single condo; Entry level: 1; Part of a 4-unit building; Estimated living area; Built approximately 51–60 years ago; Built before 1978
- Construction: Vinyl siding and brick exterior
- Exterior features: Patio; Common lot/landscape area
Interior
- Kitchen: Kitchen on main level (approx. 8 x 7)
- Bedrooms: Master bedroom on main level (approx. 13 x 19); Second bedroom on main level (approx. 9 x 10); Two additional bedrooms listed (configurable)
- Bathrooms: One full bathroom on the main level
- Heating & cooling: Natural gas heating; Central air conditioning
- Interior features: First-floor bedroom; First-floor full bath; 5 total rooms
- Laundry & utility: Main-level laundry with washer hookup located in-unit (approx. 3 x 7)
Neighborhood map
What this means for you Summary
Snapshot
- This is a 2-bed/1.0-bath condo listed at $209k.
Deal economics
- At list price, monthly cash flow is $131 ($2k/yr) — positive.
- The deal already cash-flows at list — no discount required.
- Meets the 1% rule at list price ($2k rent vs $209k).
- Cap rate 7.0% vs local median 4.3% in Tinley Park — top-decile yield for the area; either an underpriced asset or a hidden risk that comps aren't pricing in. Stress-test before assuming the spread holds.
Location & tenants
- Location reads 74/100 on livability (#246 in IL, #4,453 nationally) — a middle-class / working-renter tenant base. Strengths: commute A+, employment A+, housing A+; Watch: amenities F, health & safety F.
- Cons Hsd 230 (suburban): math 35% / reading 39% proficiency, ranked #146 of 620 in IL (top 24%) — families likely to look elsewhere, expect single-tenant / working-renter base with shorter leases.
- Zoned schools: Helen Keller Elem School (math 32% / reading 22%, grade F, #749 of 2,056 statewide, top 40%, 397 students, 0% FRL); Virgil I Grissom Middle School (math 41% / reading 46%, grade D, #101 of 665 statewide, top 16%, 596 students, 0% FRL); Victor J Andrew High School (math 32% / reading 36%, grade F, #147 of 693 statewide, top 22%, 2,259 students, 0% FRL).
- Market conditions: 159 active listings in the ZIP; 8 comparable units currently listed for rent nearby; rentals leasing fast (median 10d on market — plan ~1-2 weeks tenant-placement turnaround); solid renter incomes; 6,272 units permitted in Cook County in 2024 (4,658 in 5+ unit buildings).
Forward outlook
- Local home prices are declining (-3.0%/yr); year-one equity from $1k of loan paydown is wiped out by about $6k of value loss. Plan a longer hold.
Negotiation context
- Only 8 days on market — expect competitive offers; lowballing is unlikely to land.
- Current owner paid $150k; 39% above their basis — modest negotiation headroom, anchor on the comps not their cost.
Questions for the listing agent
- Built in 1975 — when were the roof, HVAC, electrical panel, plumbing, and water heater last replaced?
- What does the HOA fee cover, when was the last increase, and are there any pending special assessments or reserve-fund shortfalls?
- Any open or pending special assessments — roof, HVAC, plumbing, elevator, façade? What's the per-unit balance and payoff schedule, and is the seller paying it off at close or rolling it to the buyer?
- Is there a deadline driving the sale (1031 exchange, divorce, estate, relocation)? That informs how much negotiation room exists.
- The area grade is low — what's the realistic commute time and amenity access for the typical tenant pool here? Any planned neighborhood developments (good or bad) we should know about?
- What's the average days-on-market for RENTAL listings here right now (not sales)? A rising rental-DOM trend means longer vacancies and softer asking-rent achievability than the comps imply.
- What's the recent tenant-quality profile in this submarket — average credit score on applications, eviction rate, late-payment / NSF rate, and stable-employment percentage? A property-management company in the area should have these aggregated.
- How much new apartment / multifamily construction is in the pipeline within 1–3 miles? Heavy new supply (>2% of stock underway) typically softens rents 12–24 months out; light construction supports rent growth.
Investment metrics
- 1% rule
- 1.07% ✓
- Cap rate
- 7.05%
- Cash-on-cash
- 2.69%
- DSCR
- 1.12
- GRM
- 7.8
CMA / ARV
No comps found within radius.
Projected returns pro-forma
-3.0% appreciation · 3.0% rent growth · sell at horizon
- IRR
- -12.0%
- Equity multiple
- 0.57×
- Total profit
- $-25,359
- Equity at exit
- $31,163
- IRR
- -2.7%
- Equity multiple
- 0.82×
- Total profit
- $-10,697
- Equity at exit
- $18,071
Cash invested: $58,520 (down + closing). Projections, not guarantees.
Landlord ↔ Tenant lean methodology
- Overall (STATE)
- 43 Moderately Tenant-Leaning
- State Illinois
- 43 Moderately Tenant-Leaning · D+7
- County
- — inherits STATE
- City
- — inherits STATE
ZIP-level market 60477
- Active inventory
- 159
- Price-to-rent
- 7.8×
Monthly cashflow live
- Estimated rent
- $2,243 high interval (Pro) →
- Mortgage (P&I)
- −$1,096
- Tax from tax record
- −$224 /mo · $2,686/yr
- Insurance
- −$87
- HOA
- −$234
- Vacancy / Maint / Mgmt
- −$471
- Net cashflow
- $131
Break-even live
Sensitivity live
| Price | -10% $249 | -5% $190 | +0% $131 | +5% $72 | +10% $13 |
|---|---|---|---|---|---|
| Rent | -10% $-46 | -5% $43 | +0% $131 | +5% $220 | +10% $308 |
| Rate | -1.0pp $236 | -0.5pp $184 | base $131 | +0.5pp $77 | +1.0pp $22 |
UW: 25.0% down · 7.5% · 30yr · 1.5% tax · 5.0% vac · 8.0% maint · 8.0% mgmt
Financing live
Cash to close
- Down payment
- $52,250
- Closing costs
- $6,270
- Reserves months
- —
- Total cash needed
- —
Loan-product check · same deal, 3 products live
Conventional
25% down · 7.5% · 30yr
- Down + closing
- —
- Monthly P&I
- —
- Monthly cashflow
- —
- DSCR
- —
- Eligible?
- —
Personal DTI + credit; lowest rate.
DSCR
20% down · 8.5% · 30yr
- Down + closing
- —
- Monthly P&I
- —
- Monthly cashflow
- —
- DSCR
- —
- Eligible?
- —
No personal income docs; deal must DSCR.
Hard money
10% down · 12.0% · 12mo
- Down + closing
- —
- Monthly P&I
- —
- Monthly cashflow
- —
- DSCR
- —
- Eligible?
- —
Short-term bridge; refi at stabilization.
Rent comps 8 comps
| Address | Beds | Baths | Sqft | Rent | $/sqft | DOM | Units | Dist |
|---|---|---|---|---|---|---|---|---|
| 7927 163rd Ct Tinley Park, IL | 2.0 | 1.0 | 1000 | $2,300 | $2.30 | 0d | 1 | 0.12mi |
| 16180 Apple Ln #2 Tinley Park, IL | 3.0 | 2.5 | 1250 | $2,900 | $2.32 | 7d | 1 | 0.83mi |
| 16450 Cherry Hill Ave Tinley Park, IL | 3.0 | 2.0 | 1370 | $3,100 | $2.26 | 9d | 1 | 0.87mi |
| 15834 Orlan Brook Dr Unit 3E Orland Park, IL | 2.0 | 1.0 | 1000 | $1,800 | $1.80 | 19d | 1 | 1.10mi |
| 15826 Farm Hill Dr Orland Park, IL | 3.0 | 1.5 | 1500 | $2,500 | $1.67 | 12d | 1 | 1.24mi |
| 16851 Harlem Ave Tinley Park, IL | 1.0–2.0 | 1.0–2.0 | 857 | $3,065 | $3.58 | 0d | 24 | 1.27mi |
| 15502 Orlan Brook Dr #222 Orland Park, IL | 2.0 | 2.0 | 1069 | $2,500 | $2.34 | 9d | 1 | 1.34mi |
| 15502 Orlan Brook Dr #222 Orland Park, IL | 2.0 | 2.0 | 1069 | $2,700 | $2.53 | 26d | 1 | 1.34mi |
HOA detail condo
- Monthly dues
- $234 · $2,808/yr
- Assessments
- None detected in remarks — confirm with the listing agent.
Listing history 7 events
-
2026-06-21days on market $209,000 Active 8 DOM
-
2026-06-18days on market $209,000 Active 5 DOM
-
2026-06-17days on market $209,000 Active 4 DOM
-
2026-06-16days on market $209,000 Active 3 DOM
-
2026-06-15days on market $209,000 Active 2 DOM
-
2026-06-13remarks 691-char remark
-
2026-06-13$209,000 Active 1 DOM
ⓘ Source: listings_history table (triggers on properties + properties_extension) + one-shot
backfill from property_details.listing_events for pre-trigger history.
Tax reassessment forecast IL · Partial reset (capped growth)
- Current annual tax
- $2,686 · $224/mo
- Projected year-2 tax
- $3,715 · $310/mo
- Expected delta
- +$1,029/yr (+$86/mo · 38.3%)
ⓘ Screening estimate from a state-policy table — verify with the county assessor before closing.
Climate risk First Street
- Flood 1/10 Low FEMA zone X (unshaded) · 0% chance over 30 yrs
- Wildfire 1/10 Low
- Heat 3/10 Moderate 7 d/yr ≥102°F today · 15 d/yr by 30 yrs out
- Wind 2/10 Low
- Air quality 4/10 Moderate 4 unhealthy d/yr today · 5 by 30 yrs out
Nearby sold comps map
Loading sold comps map…
Walkable amenities ~0.75 mi
Loading nearby amenities…
Taxation est. · year 1
- Rental income
- $26,918
- − Mortgage interest
- −$11,707
- − Property taxes
- −$2,686
- − Insurance
- −$1,045
- − Repairs & maintenance
- −$2,153
- − Management
- −$2,153
- − HOA
- −$2,808
- − Depreciation
- −$6,080
- Taxable loss
- −$1,715
- Est. tax savings @ 24.0%
- +$412
- After-tax cash flow
- $1,986/yr
For passive investors: Depreciation is non-cash, so a rental often shows a tax loss while cash-flowing — sheltering income. Rental losses are passive: they offset passive income freely, and up to $25,000/yr can offset ordinary (W-2) income if you actively participate and your MAGI is under $100k (phasing out to $0 by $150k); unused losses carry forward. On sale, claimed depreciation is recaptured at up to 25%, and gains may owe capital-gains tax (a 1031 exchange can defer both). Figures are a year-1 estimate at your 24.0% rate — not tax advice; consult a CPA.
Schools (NCES district)
- District
- Cons Hsd 230
- NCES district ID
- 1708400
- Math proficiency
- 35% ▼ -8.00%
- Reading proficiency
- 39% ▼ -6.00%
- Median HH income
- $73,953
- Composite
- 34.29/100
- National rank
- #5244
- State rank
- #146 of 620 in IL
Livability — Tinley Park
- Score
- 74/100
- State rank
- #246
- US rank
- #4453
Category grades
Schools grade is shown separately in the Schools card above.
Census & demographics
- Census place
- Tinley Park, IL
- County
- Cook County · 4,486,803 people
- City population
- 35,976
- Metro
- Chicago-Naperville-Elgin, IL-IN-WI
- Population (ZIP)
- 35,976
- Household income
- $94,927
- Rent vs Own
- Severe rent burden
- 753.0
Population outlook (Cook County) Hauer SSP2
- Today (2025)
- 5,347,519 people
- By 2030
- 5,357,703 · +0.2%
- By 2040
- 5,324,924 · -0.4%
- By 2050
- 5,230,762 · -2.2%
- By 2075
- 4,785,735 · -10.5%
- By 2100
- 4,188,836 · -21.7%
Race, ethnicity, and origin ACS 2023
- Neighborhood character
- Predominantly White (74%)
- Race & ethnicity
- White 74% Hispanic / Latino 12% Two or more races 9% Black 7% Asian 3%
- Hispanic origin (detail)
- Mexican 9% Puerto Rican 2%
- Common ancestry
- Romanian 14% Iranian 3% Lithuanian 2%
- Foreign-born
- 9% · Canada, China
- Languages at home
- 85% English-only · Spanish 6% Arabic 5% Other Indo-European 1%
Political lean MEDSL · Cook
- 2024 margin
- Solid D (+42.0) · D 70.4% · R 28.4% · Other 1.2%
- 2008→2024 swing
- -11.4pp toward R · 2008: 53.4pp · 2024: 42.0pp
- All cycles
- 2024: D+42.0 2020: D+50.3 2016: D+53.0 2012: D+49.4 2008: D+53.4
Not yet ingested
- Civics
- —
Market trends
- HPI YoY
- ▼ -272.64%
- Current HPI
- 190.7548
- Rent YoY
- —
- Metro
- Chicago-Naperville-Elgin, IL-IN-WI
- State GDP YoY
- ▲ 1.59%
- F500 in state
- 60
Industry mix (Fortune 500 HQ in IL)
| Industry | F500 HQs | Revenue |
|---|---|---|
| Insurance | 4 | $201B |
|
||
| Consumer Goods | 4 | $87B |
|
||
| Industrial Machinery | 3 | $64B |
|
||
| Healthcare | 2 | $55B |
|
||
| Retail / Pharmacy | 1 | $148B |
|
||
| Agriculture / Food | 1 | $86B |
|
||
Price history
+533.3% since first listed5 events — show timeline
- 2026-06-13 Listed $209,000 MRED as Distributed by MLS Grid
- 2007-08-07 Sold (Public Records) $150,000 Public Records
- 2001-05-31 Sold (Public Records) $102,000 Public Records
- 1986-09-01 Sold (Public Records) $42,000 Public Records
- 1979-01-26 Sold (Public Records) $33,000 Public Records
Property tax history
+0.8%/yrLatest (2023): $2,686 · +61.7% YoY. Source: county tax records.
Cash-flow waterfall
monthlySold comps — $/sqft
last 12 mo · ≤1 miLoading sold comps…