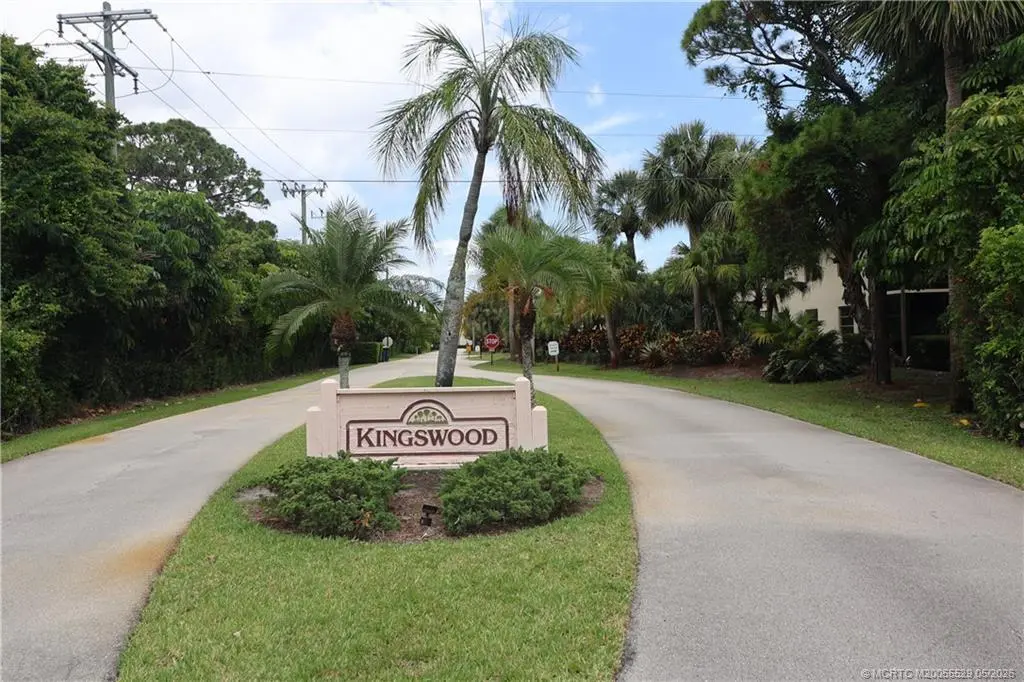
2950 N Ocean Blvd Unit 112-101 · Stuart, FL
Flood risk 7/10 · Major
- FEMA flood zone
- X (unshaded)
- Chance of flooding over 30 yrs
- 0.74%
- Est. flood insurance / yr
- $507 – $1,088
Fire risk 1/10 · Minimal
- Est. fire insurance / yr
- $947 – $1,759
Heat risk 10/10 · Severe
- Hot days now (above 106°F)
- 7 days/yr
- Hot days in 30 yrs
- 25 days/yr
Wind risk 10/10 · Severe
- Chance of severe wind over 30 yrs
- 99.0%
Air-quality risk 2/10 · Minimal
- Unhealthy air days now
- 2 days/yr
- Unhealthy air days in 30 yrs
- 2 days/yr
Risk factors via First Street. Map © Google.
Why this score? — see what drove the D+ grade
The composite is a weighted blend of 9 inputs, each scored 0–100. Each bar is that input's sub-score; the figure is the points it added to the 100-point composite (weight × sub-score).
- Appreciation +10.0/10.0
- Cash flow +9.7/30.0
- 1% rule +8.0/10.0
- Schools +4.5/10.0
- Livability +4.2/5.0
- Condition / age +4.0/5.0
- DSCR +2.7/10.0
- Rent growth +2.5/5.0
- ARV discount +1.0/15.0
$197,000
🖨 Deal sheet (PDF) 📄 Offer letter ✓ Due diligence
Listing remarks
Light and bright first floor corner unit in Kingswood Phase 3. Recently updated with new kitchen, stainless steel appliances, quartz countertop. Partial impact windows in both bedrooms and roll down shutters for all windows. Assigned parking just steps from the front door. Screened patio provides a nice outdoor space with a garden view. Kingswood is located close to the beautiful beaches of Stuart, shopping, downtown Stuart and medical facilities. Listing agent is related to seller.
Key facts
- Quartz countertop
- New kitchen
- Roll down shutters
Tags
Property features AI
Finance
- Other: Pets not allowed
- HOA & community: Homeowners association with monthly fee ($796); HOA covers association management, common areas, cable TV, insurance, grounds maintenance, structure maintenance, pools, recreation facilities, road maintenance, taxes, trash, and water; Community amenities include clubhouse, elevator, pool, trash chute, on-site property manager; Senior community; Elevator(s) provided by association
Exterior
- Parking: Assigned parking; Detached carport; Carport included
- Security: Smoke detectors
- Utilities: Electricity connected (110V and 220V)
- Home design: 4-story building; Resale property; Block, concrete and stucco construction
- Construction: Block construction; Concrete construction; Stucco exterior
- Exterior features: Storm/security shutters; Community pool
Interior
- Kitchen: Dishwasher; Electric range; Disposal; Icemaker; Microwave; Refrigerator
- Bathrooms: 2 full bathrooms
- Heating & cooling: Central heating (electric); Central air conditioning (electric); Ceiling fans
- Interior features: Unfurnished; Multiple primary suites
- Laundry & utility: Washer; Dryer; Water heater
Neighborhood map
What this means for you Summary
Snapshot
- This is a 2-bed/2.0-bath condo listed at $197k. Condition is rated good.
Deal economics
- At list price, monthly cash flow is $-196 ($-2k/yr) — negative.
- To cash-flow at today's rent, offer at most $169k (14.4% below list).
- Meets the 1% rule at list price ($3k rent vs $197k).
- Recommended offer: $169k (14.4% below list) — sets the bar for cash-flow.
- Cap rate 5.5% vs local median 3.5% in Stuart — top-decile yield for the area; either an underpriced asset or a hidden risk that comps aren't pricing in. Stress-test before assuming the spread holds.
Location & tenants
- Location reads 84/100 on livability (#39 in FL, #790 nationally) — a professional / high-income tenant draw. Strengths: commute A+, housing A+, health & safety A+; Watch: crime C-, employment C-, amenities D.
- Martin (suburban): math 52% / reading 53% proficiency, ranked #24 of 73 in FL (top 33%) — acceptable for families but not a draw, mixed tenant base, ~2y average lease.
- Zoned schools: J. D. Parker School of Technology (math 39% / reading 40%, grade F, #1,513 of 2,144 statewide, top 73%, 519 students, 72% FRL); Stuart Middle School (math 55% / reading 55%, grade B-, #180 of 571 statewide, top 32%, 867 students, 49% FRL); Jensen Beach High School (math 53% / reading 71%, grade B-, #98 of 667 statewide, top 15%, 1,584 students, 36% FRL).
- Market conditions: 252 active listings in the ZIP; 14 comparable units currently listed for rent nearby; rentals at typical pace (median 25d on market — plan ~3-4 weeks tenant-placement turnaround); solid renter incomes; 737 units permitted in Martin County in 2024 (167 in 5+ unit buildings).
- This rent runs 37% of the median local income ($84k/yr) — at the standard rent-burdened threshold; future hikes will face affordability resistance.
Forward outlook
- In year one you build about $21k of equity ($1k loan paydown + $20k appreciation (10.0% local appreciation)).
- Martin County population projected at +19% by 2050 — long-run rental-demand tailwind backs the buy-and-hold thesis.
- By year 2, paydown + projected appreciation supports a ~$34k cash-out refi (75% LTV) — recoverable capital for the next deal without selling this one.
Negotiation context
- It's been on market 47 days — a 3% lower offer ($191k) is reasonable based on typical stale-listing flexibility.
- 3 sale attempts since 2y ago; this cycle's ask is 9281% above the opening price — seller raised mid-cycle; expect resistance to lowballs.
Risks & watch-outs
- Watch-outs: flood insurance adds $66/mo; HOA is 31% of rent.
- Climate carrying-cost: major flood risk; severe wind risk, 99% chance of damaging wind over 30y; extreme-heat days projected 7→25/yr by 2055 (HVAC capex compounding) — expect insurance premiums to compound above CPI over the hold.
Questions for the listing agent
- What do current leases actually rent for vs. the listed asking? Can we see a recent rent roll and the last 12 months of T-12 income?
- It's been on market 47 days. Have you received any prior offers? Is the seller open to a 14% concession, seller financing, or rate buy-down credit?
- What's the actual annual flood-insurance premium (NFIP or private), and is the property in a SFHA with mandatory coverage?
- What does the HOA fee cover, when was the last increase, and are there any pending special assessments or reserve-fund shortfalls?
- Any open or pending special assessments — roof, HVAC, plumbing, elevator, façade? What's the per-unit balance and payoff schedule, and is the seller paying it off at close or rolling it to the buyer?
- Is there a deadline driving the sale (1031 exchange, divorce, estate, relocation)? That informs how much negotiation room exists.
- Schools are A-rated — typically a magnet for longer-tenancy family renters. What's the average tenant stay here, and is there a school-zone premium baked into asking?
- The area grade is low — what's the realistic commute time and amenity access for the typical tenant pool here? Any planned neighborhood developments (good or bad) we should know about?
- What's the average days-on-market for RENTAL listings here right now (not sales)? A rising rental-DOM trend means longer vacancies and softer asking-rent achievability than the comps imply.
- What's the recent tenant-quality profile in this submarket — average credit score on applications, eviction rate, late-payment / NSF rate, and stable-employment percentage? A property-management company in the area should have these aggregated.
- How much new apartment / multifamily construction is in the pipeline within 1–3 miles? Heavy new supply (>2% of stock underway) typically softens rents 12–24 months out; light construction supports rent growth.
Investment metrics
- 1% rule
- 1.30% ✓
- Cap rate
- 5.50%
- Cash-on-cash
- -2.83%
- DSCR
- 0.87
- GRM
- 6.4
CMA / ARV
- ARV (median comp)
- $172,005
- List price
- $197,000
- Delta
- 14.53%
- Verdict
- OVERPRICED
- Comps
- 20 within 1.0 mi
Projected returns pro-forma
10.0% appreciation · 3.0% rent growth · sell at horizon
- IRR
- 21.4%
- Equity multiple
- 2.73×
- Total profit
- $95,352
- Equity at exit
- $177,473
- IRR
- 19.4%
- Equity multiple
- 6.29×
- Total profit
- $291,763
- Equity at exit
- $382,728
Cash invested: $55,160 (down + closing). Projections, not guarantees.
Landlord ↔ Tenant lean methodology
- Overall (STATE)
- 87 Strongly Landlord-Friendly
- State Florida
- 87 Strongly Landlord-Friendly · R+3
- County
- — inherits STATE
- City
- — inherits STATE
ZIP-level market 34996
- Home prices YoY
- 2.1%
- Active inventory
- 252
- Price-to-rent
- 6.4×
Monthly cashflow live
- Estimated rent
- $2,566 high interval (Pro) →
- Mortgage (P&I)
- −$1,033
- Tax est. 1.5%
- −$246 /mo · $2,955/yr
- Insurance
- −$82
- Flood insurance flood zone
- −$66 /mo · $798/yr
- HOA
- −$796
- Vacancy / Maint / Mgmt
- −$539
- Net cashflow
- $-196
Break-even live
Sensitivity live
| Price | -10% $-60 | -5% $-128 | +0% $-196 | +5% $-264 | +10% $-333 |
|---|---|---|---|---|---|
| Rent | -10% $-399 | -5% $-298 | +0% $-196 | +5% $-95 | +10% $6 |
| Rate | -1.0pp $-97 | -0.5pp $-146 | base $-196 | +0.5pp $-247 | +1.0pp $-299 |
UW: 25.0% down · 7.5% · 30yr · 1.5% tax · 5.0% vac · 8.0% maint · 8.0% mgmt
Financing live
Cash to close
- Down payment
- $49,250
- Closing costs
- $5,910
- Reserves months
- —
- Total cash needed
- —
Loan-product check · same deal, 3 products live
Conventional
25% down · 7.5% · 30yr
- Down + closing
- —
- Monthly P&I
- —
- Monthly cashflow
- —
- DSCR
- —
- Eligible?
- —
Personal DTI + credit; lowest rate.
DSCR
20% down · 8.5% · 30yr
- Down + closing
- —
- Monthly P&I
- —
- Monthly cashflow
- —
- DSCR
- —
- Eligible?
- —
No personal income docs; deal must DSCR.
Hard money
10% down · 12.0% · 12mo
- Down + closing
- —
- Monthly P&I
- —
- Monthly cashflow
- —
- DSCR
- —
- Eligible?
- —
Short-term bridge; refi at stabilization.
Rent comps 14 comps
| Address | Beds | Baths | Sqft | Rent | $/sqft | DOM | Units | Dist |
|---|---|---|---|---|---|---|---|---|
| 2950 SE Ocean Blvd Stuart, FL | 2.0 | 2.0 | 1157 | $1,800 | $1.56 | 15d | 3 | 0.03mi |
| 2600 SE Ocean Blvd Stuart, FL | 1.0–2.0 | 1.5–2.0 | 951 | $1,900 | $2.00 | 15d | 3 | 0.19mi |
| 2929 SE Ocean Blvd Stuart, FL | 1.0–2.0 | 1.0–2.0 | 812 | $2,400 | $2.96 | 25d | 6 | 0.24mi |
| 2929 SE Ocean Blvd Stuart, FL | 1.0–2.0 | 1.0–2.0 | 812 | $2,400 | $2.96 | 15d | 8 | 0.24mi |
| 1196 SE Saint Lucie Blvd Stuart, FL | 2.0 | 2.0 | 1309 | $4,300 | $3.28 | 25d | 1 | 0.34mi |
| 2929 SE Ocean Blvd Unit 130 Stuart, FL | 2.0 | 2.0 | 1005 | $1,800 | $1.79 | 25d | 1 | 0.40mi |
| 300 SE Saint Lucie Blvd Stuart, FL | 1.0–3.0 | 1.0–2.0 | 884 | $2,258 | $2.55 | 15d | 12 | 0.58mi |
| 262 SE Monterey Ave Stuart, FL | 3.0 | 1.0 | 1001 | $3,500 | $3.50 | 25d | 1 | 0.68mi |
| 175 SE Saint Lucie Blvd Stuart, FL | 2.0 | 2.0–2.5 | 1300 | $2,600 | $2.00 | 25d | 4 | 0.78mi |
| 1800 SE Saint Lucie Blvd Stuart, FL | 2.0 | 2.0 | 1044 | $2,600 | $2.49 | 25d | 3 | 0.83mi |
| 333 SE Martin Ave Unit 1F Stuart, FL | 2.0 | 1.0 | 778 | $1,800 | $2.31 | 25d | 1 | 0.84mi |
| 150 SE Four Winds Dr Unit B303 Stuart, FL | 2.0 | 2.0 | 1359 | $2,500 | $1.84 | 25d | 1 | 0.86mi |
| 217 SE Coconut Ave Stuart, FL | 2.0 | 1.0 | 1197 | $5,000 | $4.18 | 25d | 1 | 1.36mi |
| 3129 SE Indian St #3 Stuart, FL | 2.0 | 1.5 | 986 | $2,300 | $2.33 | 25d | 1 | 1.49mi |
HOA detail condo
- Monthly dues
- $796 · $9,552/yr
- Likely covers
- parking
- Assessments
- None detected in remarks — confirm with the listing agent.
Listing history 21 events
-
2026-06-21days on market $197,000 Active 47 DOM
-
2026-06-18days on market $197,000 Active 44 DOM
-
2026-06-17days on market $197,000 Active 43 DOM
-
2026-06-16days on market $197,000 Active 42 DOM
-
2026-06-15days on market $197,000 Active 41 DOM
-
2026-06-14days on market $197,000 Active 39 DOM
-
2026-06-13days on market $197,000 Active 38 DOM
-
2026-06-10days on market $197,000 Active 36 DOM
-
2026-06-09days on market $197,000 Active 35 DOM
-
2026-06-08days on market $197,000 Active 34 DOM
-
2026-06-07days on market $197,000 Active 33 DOM
-
2026-06-03days on market $197,000 Active 29 DOM
-
2026-06-02days on market $197,000 Active 28 DOM
-
2026-06-01days on market $197,000 Active 27 DOM
-
2026-05-31days on market $197,000 Active 26 DOM
-
2026-05-31days on market $197,000 Active 25 DOM
-
2026-05-05$197,000 Active 452-char remark
-
2025-01-23historical
-
2024-10-23price $250,000
-
2024-09-19price $270,000
-
2024-07-24$315,000 Active
ⓘ Source: listings_history table (triggers on properties + properties_extension) + one-shot
backfill from property_details.listing_events for pre-trigger history.
Climate risk First Street
- Flood 7/10 Severe FEMA zone X (unshaded) · 74% chance over 30 yrs
- Wildfire 1/10 Low
- Heat 10/10 Extreme 7 d/yr ≥106°F today · 25 d/yr by 30 yrs out
- Wind 10/10 Extreme 99% chance of damaging wind over 30 yrs
- Air quality 2/10 Low 2 unhealthy d/yr today · 2 by 30 yrs out
Nearby sold comps map
Loading sold comps map…
Walkable amenities ~0.75 mi
Loading nearby amenities…
Taxation est. · year 1
- Rental income
- $30,797
- − Mortgage interest
- −$11,035
- − Property taxes
- −$2,955
- − Insurance
- −$1,782
- − Repairs & maintenance
- −$2,464
- − Management
- −$2,464
- − HOA
- −$9,552
- − Depreciation
- −$5,731
- Taxable loss
- −$5,186
- Est. tax savings @ 24.0%
- +$1,245
- After-tax cash flow
- $-1,112/yr
For passive investors: Depreciation is non-cash, so a rental often shows a tax loss while cash-flowing — sheltering income. Rental losses are passive: they offset passive income freely, and up to $25,000/yr can offset ordinary (W-2) income if you actively participate and your MAGI is under $100k (phasing out to $0 by $150k); unused losses carry forward. On sale, claimed depreciation is recaptured at up to 25%, and gains may owe capital-gains tax (a 1031 exchange can defer both). Figures are a year-1 estimate at your 24.0% rate — not tax advice; consult a CPA.
Condition & rehab AI · 12 photos
This recently updated condo in Kingswood Phase 3 is in excellent condition with a good curb appeal and modern finishes. It offers a great location and is move-in ready.
Value-add opportunities
- Both Painting the exterior and landscaping — Enhances curb appeal and adds value.
- Resale Upgrading the kitchen appliances — Modernizes the kitchen and attracts buyers.
- Both Installing smart home features — Improves convenience and adds value for both buyers and renters.
Renovation cost estimate screening
Value-add ROI direction
- Both Painting the exterior and landscaping — Enhances curb appeal and adds value. ↑
- Resale Upgrading the kitchen appliances — Modernizes the kitchen and attracts buyers. ↑
- Both Installing smart home features — Improves convenience and adds value for both buyers and renters. ↑
ⓘ Cost ranges are severity-bucket heuristics (US national rule-of-thumb). Get contractor quotes + a written scope before underwriting a rehab budget.
Schools (NCES district)
- District
- Martin
- NCES district ID
- 1201290
- Math proficiency
- 52% ▼ -14.00%
- Reading proficiency
- 53% ▼ -4.00%
- Median HH income
- $52,482
- Composite
- 45.1/100
- National rank
- #2690
- State rank
- #24 of 73 in FL
Livability — Stuart
- Score
- 84/100
- State rank
- #39
- US rank
- #790
Category grades
Schools grade is shown separately in the Schools card above.
Census & demographics
- Census place
- Stuart, FL
- County
- Martin County · 165,223 people
- City population
- 65,812
- Metro
- Port St. Lucie, FL
- Population (ZIP)
- 10,653
- Household income
- $83,929
- Rent vs Own
- Severe rent burden
- 247.0
Population outlook (Martin County) Hauer SSP2
- Today (2025)
- 172,383 people
- By 2030
- 180,192 · +4.5%
- By 2040
- 194,114 · +12.6%
- By 2050
- 204,992 · +18.9%
- By 2075
- 229,641 · +33.2%
- By 2100
- 232,146 · +34.7%
Race, ethnicity, and origin ACS 2023
- Neighborhood character
- Predominantly White (90%)
- Race & ethnicity
- White 90% Hispanic / Latino 7% Two or more races 5%
- Hispanic origin (detail)
- Puerto Rican 2%
- Common ancestry
- Italian 3% Romanian 3% Slovak 3%
- Foreign-born
- 6% · Canada
- Languages at home
- 94% English-only · Spanish 3% Other Indo-European 1% French/Haitian/Cajun 1%
Political lean MEDSL · Martin
- 2024 margin
- Solid R (+31.1) · D 34.1% · R 65.2%
- 2008→2024 swing
- -17.5pp toward R · 2008: -13.6pp · 2024: -31.1pp
- All cycles
- 2024: R+31.1 2020: R+24.6 2016: R+26.9 2012: R+22.9 2008: R+13.6
Not yet ingested
- Civics
- —
Market trends
- HPI YoY
- ▲ 13.71%
- Current HPI
- 658.96
- Rent YoY
- —
- Metro
- Port St. Lucie, FL
- State GDP YoY
- ▲ 3.28%
- F500 in state
- 36
Industry mix (Fortune 500 HQ in FL)
| Industry | F500 HQs | Revenue |
|---|---|---|
| Industrial Technology | 2 | $29B |
|
||
| Insurance | 2 | $17B |
|
||
| Retail | 1 | $60B |
|
||
| Technology Distribution | 1 | $58B |
|
||
| Homebuilding | 1 | $35B |
|
||
| Technology Manufacturing | 1 | $35B |
|
||
Price history
-99.3% since first listed6 events — show timeline
- 2026-06-15 Listed for Rent $2,100 MCRTC
- 2026-05-05 Listed $197,000 MCRTC
- 2025-01-23 Listing Removed — MCRTC
- 2024-10-23 Price Changed $250,000 MCRTC
- 2024-09-19 Price Changed $270,000 MCRTC
- 2024-07-24 Listed $315,000 MCRTC
Cash-flow waterfall
monthlySold comps — $/sqft
last 12 mo · ≤1 miLoading sold comps…