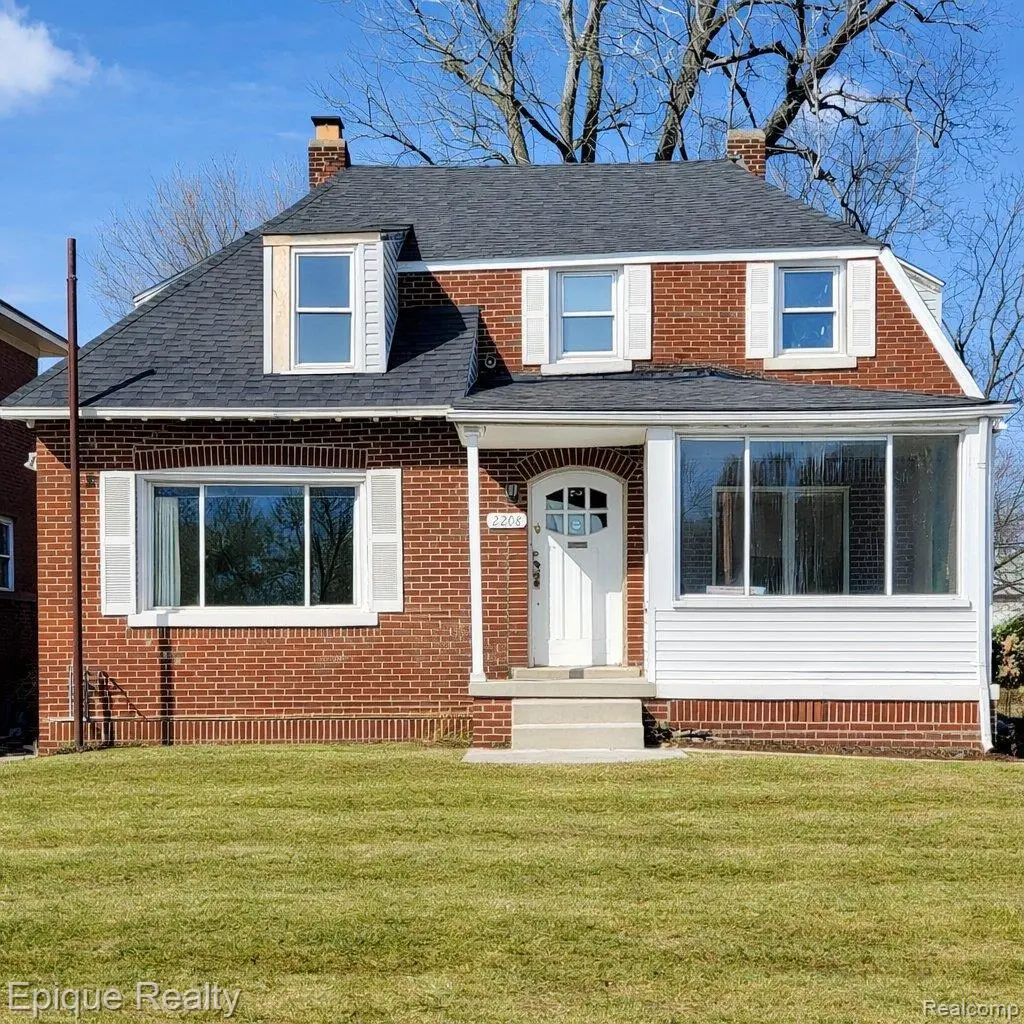
2208 Collingwood St · Detroit, MI
Flood risk 1/10 · Minimal
- FEMA flood zone
- X (unshaded)
- Chance of flooding over 30 yrs
- 0.0%
- Est. flood insurance / yr
- $507 – $1,088
Fire risk 1/10 · Minimal
- Est. fire insurance / yr
- $784 – $1,456
Heat risk 3/10 · Minor
- Hot days now (above 97°F)
- 7 days/yr
- Hot days in 30 yrs
- 15 days/yr
Wind risk 2/10 · Minimal
- Chance of severe wind over 30 yrs
- —
Air-quality risk 4/10 · Minor
- Unhealthy air days now
- 4 days/yr
- Unhealthy air days in 30 yrs
- 6 days/yr
Risk factors via First Street. Map © Google.
Why this score? — see what drove the D grade
The composite is a weighted blend of 9 inputs, each scored 0–100. Each bar is that input's sub-score; the figure is the points it added to the 100-point composite (weight × sub-score).
- Cash flow +21.8/30.0
- DSCR +7.0/10.0
- 1% rule +4.7/10.0
- Rent growth +3.8/5.0
- Livability +3.7/5.0
- Condition / age +2.5/5.0
- Schools +1.3/10.0
- ARV discount +0.0/15.0
- Appreciation +0.0/10.0
$159,000
🖨 Deal sheet (PDF) 📄 Offer letter ✓ Due diligence
Listing remarks MLS
Located just three blocks from the historic Boston-Edison District, this 4-bedroom colonial offers strong upside potential in one of Detroit's most sought-after areas. Major updates include new roof, electrical panels, furnace, water heater, water lines, siding, updated kitchen, and updated half bath. Excellent opportunity for investors or buyers looking to add finishing touches and build equity near higher-value homes. With many big-ticket improvements already done, this property is well-positioned for long-term value and appreciation.
Key facts
- 5,663 sq ft lot
- Built 1922
- Listed 105 days
Neighborhood map
What this means for you Summary
Snapshot
- This is a 4-bed/1.5-bath single-family listed at $159k.
Deal economics
- At list price, monthly cash flow is $247 ($3k/yr) — positive.
- The deal already cash-flows at list — no discount required.
- To meet the 1% rule (rent ≥ 1% of price), the offer needs to be $155k (2.7% below list).
- Recommended offer: $145k (9.0% below list) — sets the bar for market timing.
Location & tenants
- Location reads 73/100 on livability (#218 in MI) — a middle-class / working-renter tenant base. Strengths: amenities A+, commute A+, cost of living A+; Watch: crime F, employment F.
- Detroit Public Schools Community District (urban): math 10% / reading 24% proficiency, ranked #499 of 540 in MI (top 92%) — low school quality limits family demand, transient renter base, plan for 1-2y turnover; 90% free/reduced lunch — lower-income household profile, screen leases tightly.
- Zoned schools: Durfee Elementarymiddle School (593 students, 91% FRL); Central High School (math 24% / reading 24%, grade F, #481 of 713 statewide, top 81%, 353 students, 89% FRL) — zoned schools at 90% FRL track the district average.
- Market conditions: Rents rising fast (+5.2%/yr); 275 active listings in the ZIP; 40 comparable units currently listed for rent nearby; rentals at typical pace (median 23d on market — plan ~3-4 weeks tenant-placement turnaround); 2,639 units permitted in Wayne County in 2024 (1,216 in 5+ unit buildings).
- This rent runs 41% of the median local income ($45k/yr) — at the standard rent-burdened threshold; future hikes will face affordability resistance.
Forward outlook
- Local home prices are declining (-3.0%/yr); year-one equity from $1k of loan paydown is wiped out by about $5k of value loss. Plan a longer hold.
- Wayne County population projected at -17% by 2050 — secular population decline; favor cash flow + early exit over multi-decade hold.
Negotiation context
- It's been on market 106 days — a 9% lower offer ($145k) is reasonable based on typical stale-listing flexibility.
- 6 sale attempts since 28y ago with the ask held roughly flat each time — persistent listings suggest the price (not the market) is what's stuck; bring a comps-based counter.
- Current owner paid $130k; 22% above their basis — modest negotiation headroom, anchor on the comps not their cost.
Risks & watch-outs
- Watch-outs: built in 1922 — expect roof / HVAC / electrical / plumbing capex.
Questions for the listing agent
- It's been on market 106 days. Have you received any prior offers? Is the seller open to a 9% concession, seller financing, or rate buy-down credit?
- Built in 1922 — when were the roof, HVAC, electrical panel, plumbing, and water heater last replaced?
- Why hasn't it sold? Are there any deal-killer items the seller is aware of (foundation, flood, title, zoning, code violations)?
- Is there a deadline driving the sale (1031 exchange, divorce, estate, relocation)? That informs how much negotiation room exists.
- Schools are F-rated, which usually means shorter tenancies and higher turnover. Who's the typical renter profile here, and what's been the actual vacancy rate?
- Crime grade is F in this area — have there been break-ins, vandalism, or insurance claims at this property in the last 3 years? What carrier currently insures it and at what premium?
- The area grade is low — what's the realistic commute time and amenity access for the typical tenant pool here? Any planned neighborhood developments (good or bad) we should know about?
- What's the average days-on-market for RENTAL listings here right now (not sales)? A rising rental-DOM trend means longer vacancies and softer asking-rent achievability than the comps imply.
- What's the recent tenant-quality profile in this submarket — average credit score on applications, eviction rate, late-payment / NSF rate, and stable-employment percentage? A property-management company in the area should have these aggregated.
- How much new for-sale + rental construction is in the pipeline within 1–3 miles? Heavy new supply typically softens prices + rents 12–24 months out; constrained supply supports both.
Investment metrics
- 1% rule
- 0.97% ✗
- Cap rate
- 8.16%
- Cash-on-cash
- 6.65%
- DSCR
- 1.30
- GRM
- 8.6
CMA / ARV
- ARV (median comp)
- $118,717
- List price
- $159,000
- Delta
- 33.93%
- Verdict
- OVERPRICED
- Comps
- 20 within 1.0 mi
Show comp detail 12 sales within ~0.75 mi
| Address | Dist | Beds/Ba | Sqft | Sold | Price | $/sf | Match |
|---|---|---|---|---|---|---|---|
| 2064 Glynn Ct | 0.13mi | 4/1.5 | 1,624 (+1%) | 4mo | $118,556 | $73 | 88 |
| 2704 Burlingame St | 0.43mi | 3/1.5 (-1) | 1,618 (+1%) | 6mo | $119,000 | $74 | 68 |
| 2050 Atkinson St | 0.50mi | 4/1.5 | 1,624 (+1%) | 8mo | $75,000 | $46 | 68 |
| 3275 Collingwood St | 0.70mi | 4/1.5 | 1,600 (-0%) | 2mo | $64,000 | $40 | 66 |
| 2405 Sturtevant St | 0.57mi | 3/1.5 (-1) | 1,636 (+2%) | 3mo | $45,000 | $28 | 63 |
| 2460 Atkinson St | 0.54mi | 3/1.5 (-1) | 1,590 (-1%) | 16mo | $239,000 | $150 | 55 |
| 2437 Longfellow St | 0.44mi | 4/1.5 | 1,841 (+15%) | 2mo | $135,000 | $73 | 53 |
| 1981 Leslie St | 0.68mi | 3/1.5 (-1) | 1,518 (-5%) | 13mo | $50,000 | $33 | 43 |
| 929 Lawrence St | 0.75mi | 3/1.5 (-1) | 1,692 (+6%) | 9mo | $205,000 | $121 | 43 |
| 940 Burlingame St | 0.75mi | 3/1.0 (-1) | 1,644 (+3%) | 14mo | $71,000 | $43 | 42 |
| 1220 Lawrence St | 0.58mi | 3/1.0 (-1) | 1,382 (-14%) | 5mo | $5,000 | $4 | 39 |
| 3040 Burlingame St | 0.62mi | 3/2.5 (-1) | 1,778 (+11%) | 12mo | $275,000 | $155 | 34 |
Match score weights: distance 35% · size 25% · config 20% · recency 20%. Top-matched comps best support the ARV.
Projected returns pro-forma
-3.0% appreciation · 5.2% rent growth · sell at horizon
- IRR
- -3.9%
- Equity multiple
- 0.85×
- Total profit
- $-6,597
- Equity at exit
- $23,707
- IRR
- 8.0%
- Equity multiple
- 1.66×
- Total profit
- $29,312
- Equity at exit
- $13,747
Cash invested: $44,520 (down + closing). Projections, not guarantees.
Landlord ↔ Tenant lean methodology
- Overall (STATE)
- 62 Landlord-Friendly
- State Michigan
- 62 Landlord-Friendly · EVEN
- County
- — inherits STATE
- City
- — inherits STATE
ZIP-level market 48206
- Rents YoY
- 5.2%
- Active inventory
- 275
- Price-to-rent
- 8.6×
Monthly cashflow live
- Estimated rent
- $1,548 high interval (Pro) →
- Mortgage (P&I)
- −$834
- Tax from tax record
- −$76 /mo · $909/yr
- Insurance
- −$66
- HOA
- −$0
- Lot rent
- −$0
- Vacancy / Maint / Mgmt
- −$325
- Net cashflow
- $247
Break-even live
Sensitivity live
| Price | -10% $337 | -5% $292 | +0% $247 | +5% $202 | +10% $157 |
|---|---|---|---|---|---|
| Rent | -10% $125 | -5% $186 | +0% $247 | +5% $308 | +10% $369 |
| Rate | -1.0pp $327 | -0.5pp $287 | base $247 | +0.5pp $206 | +1.0pp $164 |
UW: 25.0% down · 7.5% · 30yr · 1.5% tax · 5.0% vac · 8.0% maint · 8.0% mgmt
Financing live
Cash to close
- Down payment
- $39,750
- Closing costs
- $4,770
- Reserves months
- —
- Total cash needed
- —
Loan-product check · same deal, 3 products live
Conventional
25% down · 7.5% · 30yr
- Down + closing
- —
- Monthly P&I
- —
- Monthly cashflow
- —
- DSCR
- —
- Eligible?
- —
Personal DTI + credit; lowest rate.
DSCR
20% down · 8.5% · 30yr
- Down + closing
- —
- Monthly P&I
- —
- Monthly cashflow
- —
- DSCR
- —
- Eligible?
- —
No personal income docs; deal must DSCR.
Hard money
10% down · 12.0% · 12mo
- Down + closing
- —
- Monthly P&I
- —
- Monthly cashflow
- —
- DSCR
- —
- Eligible?
- —
Short-term bridge; refi at stabilization.
Rent comps 40 comps
| Address | Beds | Baths | Sqft | Rent | $/sqft | DOM | Units | Dist |
|---|---|---|---|---|---|---|---|---|
| 1929 Calvert Ave Unit 2 Detroit, MI | 3.0 | 1.0 | 1414 | $1,199 | $0.85 | 17d | 1 | 0.19mi |
| 2634 Lawrence St Detroit, MI | 3.0 | 1.5 | 1388 | $1,600 | $1.15 | 4d | 1 | 0.37mi |
| 2655 Collingwood St Detroit, MI | 4.0 | 1.5 | 1881 | $2,700 | $1.44 | 0d | 1 | 0.39mi |
| 2653 Calvert Ave Unit 1 Detroit, MI | 3.0 | 1.0 | 1305 | $1,200 | $0.92 | 46d | 1 | 0.39mi |
| 9844 Woodrow Wilson St Detroit, MI | 3.0 | 1.0 | 1187 | $1,300 | $1.10 | 15d | 1 | 0.40mi |
| 2727 Calvert Ave Unit 1 Detroit, MI | 3.0 | 1.5 | 1350 | $1,200 | $0.89 | 46d | 1 | 0.46mi |
| 1427 Calvert Ave Detroit, MI | 3.0 | 1.0 | 1100 | $1,850 | $1.68 | 27d | 1 | 0.50mi |
| 1427 Calvert Ave Detroit, MI | 3.0 | 1.0 | 1100 | $1,750 | $1.59 | 46d | 1 | 0.50mi |
| 2925 Calvert St Detroit, MI | 3.0 | 1.0 | 1400 | $1,300 | $0.93 | 19d | 1 | 0.52mi |
| 3031 Lawrence St Detroit, MI | 4.0 | 1.0 | 1700 | $1,600 | $0.94 | 19d | 1 | 0.61mi |
| 2474 Fullerton St Detroit, MI | 3.0 | 1.0 | 1400 | $1,300 | $0.93 | 17d | 1 | 0.65mi |
| 2254 Taylor St Unit Taylor St unit Detroit, MI | 3.0 | 1.0 | 1307 | $1,550 | $1.19 | 6d | 1 | 0.65mi |
| 3224 Calvert St Detroit, MI | 3.0 | 1.0 | 1150 | $1,150 | $1.00 | 46d | 1 | 0.67mi |
| 3226 Calvert Ave Detroit, MI | 3.0 | 1.0 | 1100 | $1,200 | $1.09 | 15d | 1 | 0.68mi |
| 3266 Calvert Ave Fl 2 Detroit, MI | 3.0 | 1.0 | 1279 | $1,300 | $1.02 | 27d | 1 | 0.72mi |
| 2463 Taylor St Detroit, MI | 3.0 | 1.0 | 1350 | $1,100 | $0.81 | 46d | 1 | 0.72mi |
| 2302 Hazelwood St Unit 1 Detroit, MI | 3.0 | 1.0 | 1550 | $1,273 | $0.82 | 27d | 1 | 0.72mi |
| 3322 Webb St Unit 2 Detroit, MI | 3.0 | 1.0 | 1656 | $1,350 | $0.82 | 46d | 1 | 0.78mi |
| 3322 Webb St Unit 1 Detroit, MI | 3.0 | 1.0 | 1656 | $1,350 | $0.82 | 46d | 1 | 0.78mi |
| 3322 Webb St Detroit, MI | 3.0 | 1.0 | 1600 | $1,250 | $0.78 | 19d | 1 | 0.78mi |
| 3422 Edison St Detroit, MI | 3.0 | 1.0 | 1300 | $1,295 | $1.00 | 19d | 1 | 0.86mi |
| 3220 Gladstone St Detroit, MI | 3.0 | 1.0 | 1248 | $1,200 | $0.96 | 46d | 1 | 1.02mi |
| 1926 Clements St Unit 1926 Detroit, MI | 3.0 | 1.0 | 1150 | $1,250 | $1.09 | 22d | 1 | 1.03mi |
| 1926 Clements St Detroit, MI | 3.0 | 1.0 | 1150 | $1,150 | $1.00 | 7d | 1 | 1.03mi |
| 2504 W Euclid St Unit 2506 Detroit, MI | 3.0 | 1.0 | 1475 | $1,675 | $1.14 | 46d | 1 | 1.06mi |
| 2506 W Euclid St Detroit, MI | 3.0 | 1.0 | 1475 | $1,675 | $1.14 | 46d | 1 | 1.06mi |
| 2504 W Euclid St Unit 2504 Detroit, MI | 3.0 | 1.0 | 1475 | $1,650 | $1.12 | 46d | 1 | 1.07mi |
| 41 Richton St Highland Park, MI | 5.0 | 2.0 | 1871 | $1,800 | $0.96 | 17d | 1 | 1.18mi |
| 41 Richton St Highland Park, MI | 5.0 | 2.0 | 1871 | $1,800 | $0.96 | 4d | 1 | 1.18mi |
| 2047 Seward St Detroit, MI | 3.0 | 1.0 | 1421 | $1,453 | $1.02 | 1d | 1 | 1.19mi |
| 3740 Tyler St Unit 1 Detroit, MI | 3.0 | 1.0 | 1300 | $1,300 | $1.00 | 7d | 1 | 1.23mi |
| 1226 Virginia Park St Unit 1226 Virginia Park, Upper V 1/10/26 (T) Detroit, MI | 3.0 | 1.0 | 1100 | $1,200 | $1.09 | 46d | 1 | 1.23mi |
| 3209 W Grand St Detroit, MI | 3.0 | 1.0 | 1550 | $1,103 | $0.71 | 46d | 1 | 1.24mi |
| 3786 Carter St Unit 2 Detroit, MI | 3.0 | 1.0 | 1400 | $1,100 | $0.79 | 27d | 1 | 1.24mi |
| 3259 W Philadelphia St Detroit, MI | 3.0 | 1.0 | 1293 | $1,400 | $1.08 | 19d | 1 | 1.24mi |
| 64 Glendale St Highland Park, MI | 4.0 | 1.0 | 1464 | $1,500 | $1.02 | 13d | 1 | 1.27mi |
| 3757 Blaine St Detroit, MI | 3.0 | 1.0 | 1169 | $1,480 | $1.27 | 19d | 1 | 1.28mi |
| 11704 Broadstreet Ave Detroit, MI | 3.0 | 1.0 | 1200 | $1,050 | $0.88 | 46d | 1 | 1.31mi |
| 3799 W Philadelphia St Detroit, MI | 5.0 | 2.0 | 2200 | $1,650 | $0.75 | 19d | 1 | 1.38mi |
| 7640 Woodrow Wilson St Unit 1 Detroit, MI | 3.0 | 1.5 | 1095 | $1,400 | $1.28 | 46d | 1 | 1.39mi |
Listing history 28 events
-
2026-06-22days on market $159,000 Active 106 DOM
-
2026-06-21days on market $159,000 Active 105 DOM
-
2026-06-18days on market $159,000 Active 102 DOM
-
2026-06-17days on market $159,000 Active 101 DOM
-
2026-06-15days on market $159,000 Active 99 DOM
-
2026-06-13days on market $159,000 Active 97 DOM
-
2026-06-13days on market $159,000 Active 96 DOM
-
2026-06-09days on market $159,000 Active 93 DOM
-
2026-06-08days on market $159,000 Active 92 DOM
-
2026-06-07days on market $159,000 Active 91 DOM
-
2026-06-04days on market $159,000 Active 88 DOM
-
2026-06-03days on market $159,000 Active 87 DOM
-
2026-06-01days on market $159,000 Active 85 DOM
-
2026-05-31days on market $159,000 Active 84 DOM
-
2026-03-09$159,000 Active 542-char remark
Show marketing remark (542 chars)
Located just three blocks from the historic Boston-Edison District, this 4-bedroom colonial offers strong upside potential in one of Detroit's most sought-after areas. Major updates include new roof, electrical panels, furnace, water heater, water lines, siding, updated kitchen, and updated half bath. Excellent opportunity for investors or buyers looking to add finishing touches and build equity near higher-value homes. With many big-ticket improvements already done, this property is well-positioned for long-term value and appreciation.
-
2026-03-09$159,000 Active 548-char remark
Show marketing remark (542 chars)
Located just three blocks from the historic Boston-Edison District, this 4-bedroom colonial offers strong upside potential in one of Detroit's most sought-after areas. Major updates include new roof, electrical panels, furnace, water heater, water lines, siding, updated kitchen, and updated half bath. Excellent opportunity for investors or buyers looking to add finishing touches and build equity near higher-value homes. With many big-ticket improvements already done, this property is well-positioned for long-term value and appreciation.
-
2026-03-09historical $159,000 542-char remark
Show marketing remark (542 chars)
Located just three blocks from the historic Boston-Edison District, this 4-bedroom colonial offers strong upside potential in one of Detroit's most sought-after areas. Major updates include new roof, electrical panels, furnace, water heater, water lines, siding, updated kitchen, and updated half bath. Excellent opportunity for investors or buyers looking to add finishing touches and build equity near higher-value homes. With many big-ticket improvements already done, this property is well-positioned for long-term value and appreciation.
-
2022-07-28historical
-
2022-07-28historical
-
2022-05-17$49,900 Active
-
2022-05-17$49,900 Active
-
2022-05-15historical
-
2022-05-15historical
-
2008-04-03historical
-
2007-10-04$9,900
-
2005-09-26soldstatus $130,000
-
1998-08-15historical
-
1998-02-15$51,900
ⓘ Source: listings_history table (triggers on properties + properties_extension) + one-shot
backfill from property_details.listing_events for pre-trigger history.
Tax reassessment forecast MI · Partial reset (capped growth)
- Current annual tax
- $909 · $76/mo
- Projected year-2 tax
- $1,679 · $140/mo
- Expected delta
- +$770/yr (+$64/mo · 84.7%)
ⓘ Screening estimate from a state-policy table — verify with the county assessor before closing.
Climate risk First Street
- Flood 1/10 Low FEMA zone X (unshaded) · 0% chance over 30 yrs
- Wildfire 1/10 Low
- Heat 3/10 Moderate 7 d/yr ≥97°F today · 15 d/yr by 30 yrs out
- Wind 2/10 Low
- Air quality 4/10 Moderate 4 unhealthy d/yr today · 6 by 30 yrs out
Nearby sold comps map
Loading sold comps map…
Walkable amenities ~0.75 mi
Loading nearby amenities…
Taxation est. · year 1
- Rental income
- $18,571
- − Mortgage interest
- −$8,906
- − Property taxes
- −$909
- − Insurance
- −$795
- − Repairs & maintenance
- −$1,486
- − Management
- −$1,486
- − Depreciation
- −$4,625
- Taxable income
- $364
- Est. tax owed @ 24.0%
- −$87
- After-tax cash flow
- $2,874/yr
For passive investors: Depreciation is non-cash, so a rental often shows a tax loss while cash-flowing — sheltering income. Rental losses are passive: they offset passive income freely, and up to $25,000/yr can offset ordinary (W-2) income if you actively participate and your MAGI is under $100k (phasing out to $0 by $150k); unused losses carry forward. On sale, claimed depreciation is recaptured at up to 25%, and gains may owe capital-gains tax (a 1031 exchange can defer both). Figures are a year-1 estimate at your 24.0% rate — not tax advice; consult a CPA.
Schools (NCES district)
- District
- Detroit Public Schools Community District
- NCES district ID
- 2601103
- Math proficiency
- 10% ▼ -2.00%
- Reading proficiency
- 24% ▲ 6.00%
- Median HH income
- $25,815
- Composite
- 13.06/100
- National rank
- #9564
- State rank
- #499 of 540 in MI
Livability — Detroit
- Score
- 73/100
- State rank
- #218
- US rank
- #5427
Category grades
Schools grade is shown separately in the Schools card above.
Census & demographics
- Census place
- Detroit, MI
- County
- Wayne County · 1,562,939 people
- City population
- 572,865
- Metro
- Detroit-Warren-Dearborn, MI
- Population (ZIP)
- 15,227
- Household income
- $45,046
- Rent vs Own
- Severe rent burden
- 646.0
Population outlook (Wayne County) Hauer SSP2
- Today (2025)
- 1,675,273 people
- By 2030
- 1,620,300 · -3.3%
- By 2040
- 1,502,341 · -10.3%
- By 2050
- 1,384,039 · -17.4%
- By 2075
- 1,124,592 · -32.9%
- By 2100
- 881,193 · -47.4%
Race, ethnicity, and origin ACS 2023
- Neighborhood character
- Predominantly Black (81%)
- Race & ethnicity
- Black 81% White 12% Two or more races 5% Hispanic / Latino 3%
- Common ancestry
- Iranian 3% Romanian 1% Slovak 1%
- Foreign-born
- 4% · Canada
- Languages at home
- 94% English-only · Spanish 4% Other Indo-European 1%
Political lean MEDSL · Wayne
- 2024 margin
- Strong D (+29.0) · D 62.7% · R 33.7% · Other 3.6%
- 2008→2024 swing
- -20.5pp toward R · 2008: 49.5pp · 2024: 29.0pp
- All cycles
- 2024: D+29.0 2020: D+38.1 2016: D+37.3 2012: D+46.9 2008: D+49.5
Not yet ingested
- Civics
- —
Market trends
- HPI YoY
- ▼ -139.60%
- Current HPI
- 130.9545
- Rent YoY
- ▲ 5.20%
- Metro
- Detroit-Warren-Dearborn, MI
- State GDP YoY
- ▲ 1.37%
- F500 in state
- 28
Industry mix (Fortune 500 HQ in MI)
| Industry | F500 HQs | Revenue |
|---|---|---|
| Automotive Parts | 3 | $48B |
|
||
| Automotive | 2 | $372B |
|
||
| Chemicals | 1 | $45B |
|
||
| Automotive Retail | 1 | $29B |
|
||
| Healthcare / Medical Devices | 1 | $23B |
|
||
| Automotive Technology | 1 | $20B |
|
||
Price history
+206.4% since first listed14 events — show timeline
- 2026-03-09 Listed $159,000 MiRealSource-MiMLS
- 2026-03-09 Listed $159,000 REALCOMP
- 2026-03-09 Coming Soon $159,000 MiRealSource-MiMLS
- 2022-07-28 Listing Removed — REALCOMP
- 2022-07-28 Listing Removed — MiRealSource-MiMLS
- 2022-05-17 Listed $49,900 MiRealSource-MiMLS
- 2022-05-17 Listed $49,900 REALCOMP
- 2022-05-15 Coming Soon — MiRealSource-MiMLS
- 2022-05-15 Coming Soon — REALCOMP
- 2008-04-03 Listing Removed — REALCOMP
- 2007-10-04 Listed $9,900 REALCOMP
- 2005-09-26 Sold (Public Records) $130,000 Public Records
- 1998-08-15 Listing Removed — REALCOMP
- 1998-02-15 Listed $51,900 REALCOMP
Property tax history
-4.3%/yrLatest (2025): $909 · -7.8% YoY. Source: county tax records.
Cash-flow waterfall
monthlySold comps — $/sqft
last 12 mo · ≤1 miLoading sold comps…