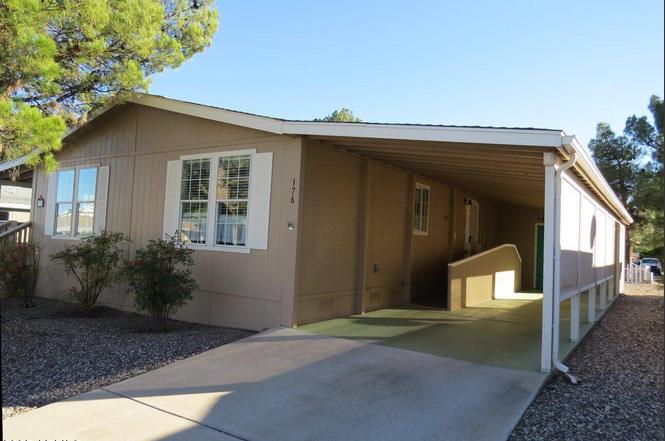
2050 W State Route 89-a -- #176 · Cottonwood, AZ
Flood risk 1/10 · Minimal
- FEMA flood zone
- X (unshaded)
- Chance of flooding over 30 yrs
- 0.0%
- Est. flood insurance / yr
- $507 – $1,088
Fire risk 5/10 · Moderate
- Est. fire insurance / yr
- $610 – $1,132
Heat risk 6/10 · Moderate
- Hot days now (above 103°F)
- 8 days/yr
- Hot days in 30 yrs
- 20 days/yr
Wind risk 1/10 · Minimal
- Chance of severe wind over 30 yrs
- —
Air-quality risk 1/10 · Minimal
- Unhealthy air days now
- 0 days/yr
- Unhealthy air days in 30 yrs
- 0 days/yr
Risk factors via First Street. Map © Google.
Why this score? — see what drove the B+ grade
The composite is a weighted blend of 9 inputs, each scored 0–100. Each bar is that input's sub-score; the figure is the points it added to the 100-point composite (weight × sub-score).
- Cash flow +30.0/30.0
- ARV discount +15.0/15.0
- 1% rule +10.0/10.0
- DSCR +10.0/10.0
- Livability +4.0/5.0
- Condition / age +2.5/5.0
- Rent growth +2.4/5.0
- Schools +1.9/10.0
- Appreciation +0.0/10.0
$130,000
🖨 Deal sheet 📄 Offer letter ✓ Due diligence
Listing remarks
The Best of Pine Shadows: Modern Comfort, Total Peace of Mind. Rarely does a home hit the market with every major detail already perfected. This beautifully updated 2-bedroom, 2-bath residence offers more than just a place to live--it offers the luxury of a fresh start. With a brand-new roof in 2024, and a high-efficiency heating and cooling system in 2025, and a sleek new dishwasher and refrigerator. The ''big things'' are done, leaving you free to simply enjoy the lifestyle. Nestled within the sought-after Pine Shadows 55+ community, you're just steps away from world-class amenities and a calendar full of activities. Effortless, elegant, and priced to be your next great move.
Key facts
- 2 parking spots
- Community pool
- Built 2002
Property features AI
Finance
- Other: Leasehold property; Directions available for location
- HOA & community: Land lease: $820 monthly; Association covers grounds maintenance and street maintenance; Community amenities: pool, community spa (heated), golf, pickleball courts, fitness center, biking/walking paths, transportation services
Exterior
- Parking: 2 covered parking spaces; 2 carport spaces
- Security: Gated community
- Utilities: City water; Public sewer
- Home design: Manufactured / mobile home; Leasehold ownership
- Construction: Cement siding; Steel frame; Wood frame; Composition roof; Home warranty included; Building area per builder
- Exterior features: Heated spa; Shed(s); East/West exposure; Gravel/stone front; Private maintained road; Asphalt road surface
Interior
- Kitchen: Built-in microwave; Kitchen island; Pantry / walk-in pantry; Refrigerator; Dishwasher; Disposal; Eat-in kitchen
- Bedrooms: Up to 2 bedrooms (possible)
- Flooring: Carpet; Vinyl
- Bathrooms: 2 full bathrooms
- Heating & cooling: Electric heating; Central air conditioning
- Interior features: Eat-in kitchen; Kitchen island; Pantry; Walk-in pantry; Full bath in master bedroom; Dual-pane windows; Accessible hallways; Refrigerator; Dishwasher; Disposal; Inside laundry
- Laundry & utility: Inside laundry
Neighborhood map
What this means for you Summary
Snapshot
- This is a 2-bed/2.0-bath manufactured listed at $130k.
Deal economics
- At list price, monthly cash flow is $741 ($9k/yr) — positive.
- The deal already cash-flows at list — no discount required.
- Meets the 1% rule at list price ($2k rent vs $130k).
- Recommended offer: $114k (12.0% below list) — sets the bar for market timing.
- Cap rate 13.1% vs local median 3.8% in Cottonwood — top-decile yield for the area; either an underpriced asset or a hidden risk that comps aren't pricing in. Stress-test before assuming the spread holds.
Location & tenants
- Location reads 79/100 on livability (#7 in AZ, #2,176 nationally) — a middle-class / working-renter tenant base. Strengths: health & safety A+, commute A, cost of living A; Watch: employment D, amenities F.
- Cottonwood-Oak Creek Elementary District (4487) (town): math 17% / reading 28% proficiency, ranked #174 of 249 in AZ (top 70%) — low school quality limits family demand, transient renter base, plan for 1-2y turnover.
- Market conditions: Rents soft (-0.2%/yr); 266 active listings in the ZIP; 3 comparable units currently listed for rent nearby; rentals leasing fast (median 14d on market — plan ~1-2 weeks tenant-placement turnaround); 2,062 units permitted in Yavapai County in 2024 (98 in 5+ unit buildings).
- This rent runs 43% of the median local income ($57k/yr) — at the standard rent-burdened threshold; future hikes will face affordability resistance.
Forward outlook
- Local home prices are declining (-3.0%/yr); year-one equity from $899 of loan paydown is wiped out by about $4k of value loss. Plan a longer hold.
- Yavapai County population projected at +10% by 2050 — modest demand growth; plan on rents tracking national, not racing it.
- At projected returns (-3.0% appreciation + 0.0% rent growth), your $36k cash investment doubles in ~6 years — after that, you're playing with house money.
Negotiation context
- It's been on market 182 days — a 12% lower offer ($114k) is reasonable based on typical stale-listing flexibility.
- 2 sale attempts; this cycle's ask has dropped $19k (13%) from the opening price — seller is motivated, your offer sets the floor, not the list.
Risks & watch-outs
- Climate carrying-cost: moderate wildfire risk; extreme-heat days projected 8→20/yr by 2055 (HVAC capex compounding) — expect insurance premiums to compound above CPI over the hold.
Questions for the listing agent
- It's been on market 182 days. Have you received any prior offers? Is the seller open to a 12% concession, seller financing, or rate buy-down credit?
- Why hasn't it sold? Are there any deal-killer items the seller is aware of (foundation, flood, title, zoning, code violations)?
- Is there a deadline driving the sale (1031 exchange, divorce, estate, relocation)? That informs how much negotiation room exists.
- What's the average days-on-market for RENTAL listings here right now (not sales)? A rising rental-DOM trend means longer vacancies and softer asking-rent achievability than the comps imply.
- What's the recent tenant-quality profile in this submarket — average credit score on applications, eviction rate, late-payment / NSF rate, and stable-employment percentage? A property-management company in the area should have these aggregated.
- How much new for-sale + rental construction is in the pipeline within 1–3 miles? Heavy new supply typically softens prices + rents 12–24 months out; constrained supply supports both.
Investment metrics
- 1% rule
- 1.60% ✓
- Cap rate
- 13.13%
- Cash-on-cash
- 24.43%
- DSCR
- 2.09
- GRM
- 5.2
CMA / ARV
- ARV (on-the-fly)
- $162,240
- Comps found
- 12
Show comp detail 12 sales within ~0.75 mi
| Address | Dist | Beds/Ba | Sqft | Sold | Price | $/sf | Match |
|---|---|---|---|---|---|---|---|
| 2050 W State Route 89a -- #181 | 0.17mi | 2/2.0 | 1,216 (-3%) | 0mo | $120,000 | $99 | 88 |
| 2050 W State Route 89a -- #86 | 0.00mi | 3/2.0 (+1) | 1,344 (+8%) | 2mo | $35,000 | $26 | 80 |
| 2050 W State Route 89-a -- #92 | 0.00mi | 3/2.0 (+1) | 1,344 (+8%) | 4mo | $145,000 | $108 | 79 |
| 2050 W State Route 89a -- #152 | 0.24mi | 2/2.0 | 1,344 (+8%) | 0mo | $205,000 | $153 | 76 |
| 511 Mingus Shadows Dr | 0.36mi | 2/2.0 | 1,325 (+6%) | 3mo | $262,500 | $198 | 71 |
| 2050 W State Route 89a -- #158 | 0.26mi | 3/2.0 (+1) | 1,334 (+7%) | 5mo | $130,000 | $97 | 67 |
| 2050 State Route 89a -- #377 | 0.26mi | 2/2.0 | 1,088 (-13%) | 1mo | $109,000 | $100 | 66 |
| 2050 W State Route 89a Hwy #51 | 0.26mi | 2/2.0 | 1,088 (-13%) | 4mo | $125,000 | $115 | 63 |
| 972 Trevino Dr | 0.37mi | 3/2.0 (+1) | 1,382 (+11%) | 2mo | $179,900 | $130 | 58 |
| 880 Calle Rosas -- | 0.70mi | 3/2.0 (+1) | 1,324 (+6%) | 0mo | $279,999 | $211 | 52 |
| 992 Trevino Dr | 0.35mi | 3/2.0 (+1) | 1,431 (+15%) | 3mo | $195,000 | $136 | 51 |
| 1139 W On The Greens Blvd | 0.45mi | 3/2.0 (+1) | 1,404 (+12%) | 8mo | $245,000 | $175 | 46 |
Match score weights: distance 35% · size 25% · config 20% · recency 20%. Top-matched comps best support the ARV.
Projected returns pro-forma
-3.0% appreciation · 0.0% rent growth · sell at horizon
- IRR
- 14.3%
- Equity multiple
- 1.55×
- Total profit
- $20,084
- Equity at exit
- $19,383
- IRR
- 20.7%
- Equity multiple
- 2.51×
- Total profit
- $54,891
- Equity at exit
- $11,240
Cash invested: $36,400 (down + closing). Projections, not guarantees.
Landlord ↔ Tenant lean methodology
- Overall (STATE)
- 87 Strongly Landlord-Friendly
- State Arizona
- 87 Strongly Landlord-Friendly · R+3
- County
- — inherits STATE
- City
- — inherits STATE
ZIP-level market 86326
- Home prices YoY
- -32.2%
- Rents YoY
- -0.2%
- Active inventory
- 266
- Price-to-rent
- 5.2×
Monthly cashflow live
- Estimated rent
- $2,075 medium interval (Pro) →
- Mortgage (P&I)
- −$682
- Tax est. 1.5%
- −$162 /mo · $1,950/yr
- Insurance
- −$54
- HOA
- −$0
- Vacancy / Maint / Mgmt
- −$436
- Net cashflow
- $741
Break-even live
UW: 25.0% down · 7.5% · 30yr · 1.5% tax · 5.0% vac · 8.0% maint · 8.0% mgmt
Financing live
Cash to close
- Down payment
- $32,500
- Closing costs
- $3,900
- Reserves months
- —
- Total cash needed
- —
Loan-product check · same deal, 3 products live
Conventional
25% down · 7.5% · 30yr
- Down + closing
- —
- Monthly P&I
- —
- Monthly cashflow
- —
- DSCR
- —
- Eligible?
- —
Personal DTI + credit; lowest rate.
DSCR
20% down · 8.5% · 30yr
- Down + closing
- —
- Monthly P&I
- —
- Monthly cashflow
- —
- DSCR
- —
- Eligible?
- —
No personal income docs; deal must DSCR.
Hard money
10% down · 12.0% · 12mo
- Down + closing
- —
- Monthly P&I
- —
- Monthly cashflow
- —
- DSCR
- —
- Eligible?
- —
Short-term bridge; refi at stabilization.
Rent comps 3 comps
| Address | Beds | Baths | Sqft | Rent | $/sqft | DOM | Units | Dist |
|---|---|---|---|---|---|---|---|---|
| 1910 W Trail Blazer Dr Cottonwood, AZ | 2.0 | 2.0 | 1278 | $2,900 | $2.27 | 13d | 1 | 1.05mi |
| 844 Tiablanca Rd Clarkdale, AZ | 2.0 | 2.0 | 1333 | $1,995 | $1.50 | 13d | 1 | 1.13mi |
| 905 N 2nd St Cottonwood, AZ | 2.0 | 1.0 | 752 | $1,305 | $1.74 | 21d | 1 | 1.27mi |
Listing history 22 events
-
2026-06-18days on market $130,000 Active 182 DOM
-
2026-06-17days on market $130,000 Active 181 DOM
-
2026-06-16days on market $130,000 Active 180 DOM
-
2026-06-15days on market $130,000 Active 179 DOM
-
2026-06-14days on market $130,000 Active 177 DOM
-
2026-06-13days on market $130,000 Active 176 DOM
-
2026-06-10days on market $130,000 Active 174 DOM
-
2026-06-09days on market $130,000 Active 173 DOM
-
2026-06-08days on market $130,000 Active 172 DOM
-
2026-06-07days on market $130,000 Active 171 DOM
-
2026-06-05days on market $130,000 Active 168 DOM
-
2026-06-03days on market $130,000 Active 167 DOM
-
2026-06-02days on market $130,000 Active 166 DOM
-
2026-06-01days on market $130,000 Active 165 DOM
-
2026-05-31days on market $130,000 Active 164 DOM
-
2026-05-30days on market $130,000 Active 163 DOM
-
2026-05-25status Active
-
2026-05-20status Pending
-
2026-04-23price $130,000
-
2026-02-12price $143,000
-
2026-01-06price $148,000
-
2025-12-13$149,000 Active
ⓘ Source: listings_history table (triggers on properties + properties_extension) + one-shot
backfill from property_details.listing_events for pre-trigger history.
Climate risk First Street
- Flood 1/10 Low FEMA zone X (unshaded) · 0% chance over 30 yrs
- Wildfire 5/10 Major
- Heat 6/10 Major 8 d/yr ≥103°F today · 20 d/yr by 30 yrs out
- Wind 1/10 Low
- Air quality 1/10 Low 0 unhealthy d/yr today · 0 by 30 yrs out
Nearby sold comps map
Loading sold comps map…
Walkable amenities ~0.75 mi
Loading nearby amenities…
Taxation est. · year 1
- Rental income
- $24,904
- − Mortgage interest
- −$7,282
- − Property taxes
- −$1,950
- − Insurance
- −$650
- − Repairs & maintenance
- −$1,992
- − Management
- −$1,992
- − Depreciation
- −$3,782
- Taxable income
- $7,255
- Est. tax owed @ 24.0%
- −$1,741
- After-tax cash flow
- $7,152/yr
For passive investors: Depreciation is non-cash, so a rental often shows a tax loss while cash-flowing — sheltering income. Rental losses are passive: they offset passive income freely, and up to $25,000/yr can offset ordinary (W-2) income if you actively participate and your MAGI is under $100k (phasing out to $0 by $150k); unused losses carry forward. On sale, claimed depreciation is recaptured at up to 25%, and gains may owe capital-gains tax (a 1031 exchange can defer both). Figures are a year-1 estimate at your 24.0% rate — not tax advice; consult a CPA.
Schools (NCES district)
- District
- Cottonwood-Oak Creek Elementary District (4487)
- NCES district ID
- 0402370
- Math proficiency
- 17% ▼ -10.00%
- Reading proficiency
- 28% ▼ -7.00%
- Median HH income
- $41,740
- Composite
- 19.16/100
- National rank
- #8822
- State rank
- #174 of 249 in AZ
Livability — Cottonwood
- Score
- 79/100
- State rank
- #7
- US rank
- #2176
Category grades
Schools grade is shown separately in the Schools card above.
Census & demographics
- Census place
- Cottonwood, AZ
- County
- Yavapai County · 190,406 people
- City population
- 24,852
- Metro
- Prescott Valley-Prescott, AZ
- Population (ZIP)
- 24,852
- Household income
- $57,378
- Rent vs Own
- Severe rent burden
- 894.0
Population outlook (Yavapai County) Hauer SSP2
- Today (2025)
- 241,389 people
- By 2030
- 249,523 · +3.4%
- By 2040
- 259,966 · +7.7%
- By 2050
- 264,736 · +9.7%
- By 2075
- 269,334 · +11.6%
- By 2100
- 256,505 · +6.3%
Race, ethnicity, and origin ACS 2023
- Neighborhood character
- Predominantly White (73%)
- Race & ethnicity
- White 73% Hispanic / Latino 20% Two or more races 14% Native American 1%
- Hispanic origin (detail)
- Mexican 17%
- Common ancestry
- Italian 3% Romanian 3% Lithuanian 2%
- Foreign-born
- 12% · Canada
- Languages at home
- 84% English-only · Spanish 14% German/W. Germanic 1%
Political lean MEDSL · Yavapai
- 2024 margin
- Solid R (+33.9) · D 32.6% · R 66.5%
- 2008→2024 swing
- -9.5pp toward R · 2008: -24.4pp · 2024: -33.9pp
- All cycles
- 2024: R+33.9 2020: R+29.3 2016: R+31.4 2012: R+30.7 2008: R+24.4
Not yet ingested
- Civics
- —
Market trends
- HPI YoY
- ▼ -165.27%
- Current HPI
- 347.5058
- Rent YoY
- ▼ -0.22%
- Metro
- Prescott Valley-Prescott, AZ
- State GDP YoY
- ▲ 4.54%
- F500 in state
- 20
Industry mix (Fortune 500 HQ in AZ)
| Industry | F500 HQs | Revenue |
|---|---|---|
| Technology | 2 | $13B |
|
||
| Mining / Metals | 1 | $23B |
|
||
| Environmental Services | 1 | $16B |
|
||
| Metals / Steel | 1 | $14B |
|
||
| Technology Distribution | 1 | $9B |
|
||
| Homebuilding | 1 | $8B |
|
||
Price history
-12.8% since first listed6 events — show timeline
- 2026-05-25 Relisted — ARMLS
- 2026-05-20 Pending — ARMLS
- 2026-04-23 Price Changed $130,000 ARMLS
- 2026-02-12 Price Changed $143,000 ARMLS
- 2026-01-06 Price Changed $148,000 ARMLS
- 2025-12-13 Listed $149,000 ARMLS
Cash-flow waterfall
monthlySold comps — $/sqft
last 12 mo · ≤1 miLoading sold comps…