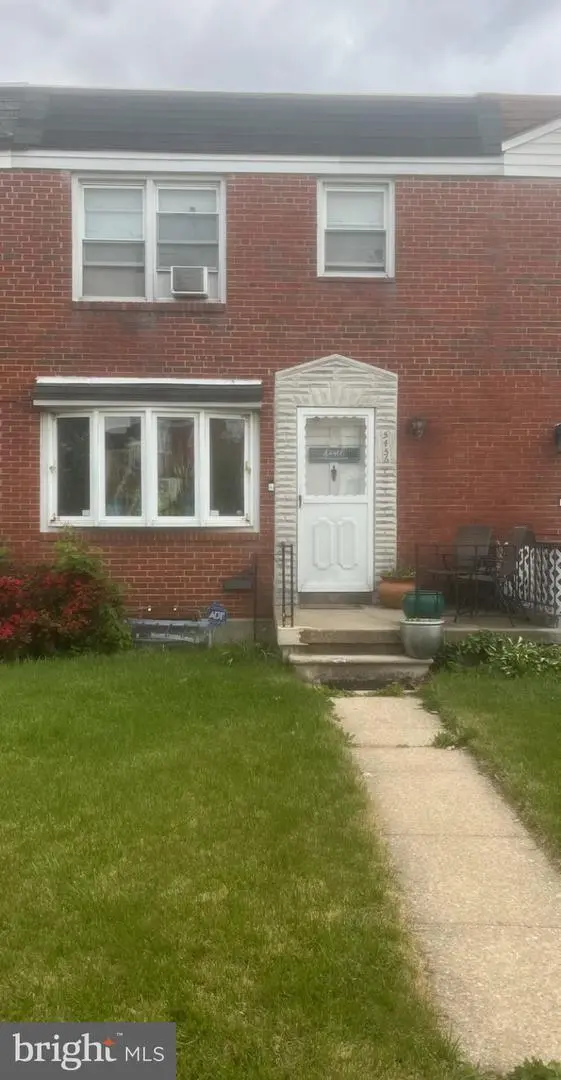
5456 Whitwood Rd · Baltimore, MD
Flood risk 1/10 · Minimal
- FEMA flood zone
- X (unshaded)
- Chance of flooding over 30 yrs
- 0.0%
- Est. flood insurance / yr
- $473 – $860
Fire risk 1/10 · Minimal
- Est. fire insurance / yr
- $755 – $1,403
Heat risk 8/10 · Major
- Hot days now (above 103°F)
- 7 days/yr
- Hot days in 30 yrs
- 15 days/yr
Wind risk 6/10 · Moderate
- Chance of severe wind over 30 yrs
- 27.0%
Air-quality risk 5/10 · Moderate
- Unhealthy air days now
- 6 days/yr
- Unhealthy air days in 30 yrs
- 8 days/yr
Risk factors via First Street. Map © Google.
Why this score? — see what drove the C+ grade
The composite is a weighted blend of 9 inputs, each scored 0–100. Each bar is that input's sub-score; the figure is the points it added to the 100-point composite (weight × sub-score).
- Cash flow +23.9/30.0
- ARV discount +15.0/15.0
- DSCR +7.7/10.0
- 1% rule +6.4/10.0
- Livability +3.8/5.0
- Rent growth +3.6/5.0
- Condition / age +2.5/5.0
- Schools +1.0/10.0
- Appreciation +0.0/10.0
$162,500
🖨 Deal sheet (PDF) 📄 Offer letter ✓ Due diligence
Listing remarks MLS
A coat of paint will do wonders! Air conditioning unit needs a coil. Roof and ceiling will be repaired before closing. Not leaving frig. Contributing $3,500 to closing/repairs. Seller not making any repairs. Cash or conventional only! Security sys. to be activated by Buyer. Knock first. Allow Seller time to come to door before using keybox. Repla. windows. Leave a card. Thank you!
Key facts
- Rear parking pad
- Finished basement
- Updated kitchen
Tags
Property features AI
Finance
- Other: Pets allowed with no restrictions
Exterior
- Parking: On-street parking
- Utilities: Public water; Public sewer; Municipal trash service
- Home design: Interior townhouse/rowhouse; Fee simple ownership; Estimated year built; Property in average condition
- Construction: Brick construction; Block foundation; Shingle roof; Above- and below-grade finished spaces
- Exterior features: Chain link fencing; Not in a federal flood zone
Interior
- Bedrooms: Three bedrooms on the main upper level
- Flooring: Carpet; Hardwood
- Bathrooms: One full bathroom; One half bathroom
- Heating & cooling: Forced air heating (natural gas); Central air conditioning (electric); Natural gas hot water
- Interior features: Drywall walls and ceilings; Fully finished basement; Estimated living area
- Laundry & utility: Laundry in the basement
Neighborhood map
What this means for you Summary
Snapshot
- This is a 3-bed/1.0-bath townhouse listed at $162k.
Deal economics
- At list price, monthly cash flow is $314 ($4k/yr) — positive.
- The deal already cash-flows at list — no discount required.
- Meets the 1% rule at list price ($2k rent vs $162k).
- Cap rate 8.6% vs local median 6.0% in Baltimore — top-decile yield for the area; either an underpriced asset or a hidden risk that comps aren't pricing in. Stress-test before assuming the spread holds.
Location & tenants
- Location reads 76/100 on livability (#90 in MD, #3,396 nationally) — a middle-class / working-renter tenant base. Strengths: amenities A+, commute A+, housing A+; Watch: schools D, crime F.
- Baltimore City Public Schools (urban): math 7% / reading 16% proficiency, ranked #24 of 24 in MD (top 100%) — low school quality limits family demand, transient renter base, plan for 1-2y turnover; 79% free/reduced lunch — lower-income household profile, screen leases tightly.
- Market conditions: Rents rising fast (+4.4%/yr); 180 active listings in the ZIP; 33 comparable units currently listed for rent nearby; rentals at typical pace (median 25d on market — plan ~3-4 weeks tenant-placement turnaround); 1,273 units permitted in Baltimore city in 2024 (1,104 in 5+ unit buildings).
- This rent runs 34% of the median local income ($65k/yr) — at the standard rent-burdened threshold; future hikes will face affordability resistance.
Forward outlook
- Local home prices are declining (-3.0%/yr); year-one equity from $1k of loan paydown is wiped out by about $5k of value loss. Plan a longer hold.
- Baltimore County population projected to shrink 4% by 2050 — rents likely to lag national; underwrite the cash flow, not the appreciation.
- At projected returns (-3.0% appreciation + 4.4% rent growth), your $46k cash investment doubles in ~10 years — after that, you're playing with house money.
Negotiation context
- Only 9 days on market — expect competitive offers; lowballing is unlikely to land.
- 4 sale attempts since 30y ago with the ask held roughly flat each time — persistent listings suggest the price (not the market) is what's stuck; bring a comps-based counter.
- Current owner paid $100k; list at $162k implies a 62% gain — meaningful room to come down on a strong offer.
Risks & watch-outs
- Watch-outs: built in 1959 — expect roof / HVAC / electrical / plumbing capex.
- Climate carrying-cost: major wind risk, 27% chance of damaging wind over 30y; extreme-heat days projected 7→15/yr by 2055 (HVAC capex compounding) — expect insurance premiums to compound above CPI over the hold.
Questions for the listing agent
- Built in 1959 — when were the roof, HVAC, electrical panel, plumbing, and water heater last replaced?
- Is there a deadline driving the sale (1031 exchange, divorce, estate, relocation)? That informs how much negotiation room exists.
- Schools are D-rated, which usually means shorter tenancies and higher turnover. Who's the typical renter profile here, and what's been the actual vacancy rate?
- Crime grade is F in this area — have there been break-ins, vandalism, or insurance claims at this property in the last 3 years? What carrier currently insures it and at what premium?
- What's the average days-on-market for RENTAL listings here right now (not sales)? A rising rental-DOM trend means longer vacancies and softer asking-rent achievability than the comps imply.
- What's the recent tenant-quality profile in this submarket — average credit score on applications, eviction rate, late-payment / NSF rate, and stable-employment percentage? A property-management company in the area should have these aggregated.
- How much new for-sale + rental construction is in the pipeline within 1–3 miles? Heavy new supply typically softens prices + rents 12–24 months out; constrained supply supports both.
Investment metrics
- 1% rule
- 1.14% ✓
- Cap rate
- 8.61%
- Cash-on-cash
- 8.29%
- DSCR
- 1.37
- GRM
- 7.3
CMA / ARV
- ARV (median comp)
- $230,275
- List price
- $162,500
- Delta
- -29.43%
- Verdict
- UNDERPRICED
- Comps
- 20 within 1.0 mi
Show comp detail 12 sales within ~0.75 mi
| Address | Dist | Beds/Ba | Sqft | Sold | Price | $/sf | Match |
|---|---|---|---|---|---|---|---|
| 6021 Arizona Ave | 0.21mi | 3/1.5 | 1,152 (0%) | 6mo | $164,900 | $143 | 84 |
| 5454 Cedonia Ave | 0.15mi | 4/2.0 (+1) | 1,152 (0%) | 1mo | $215,000 | $187 | 83 |
| 5536 Whitby Rd | 0.23mi | 3/1.5 | 1,152 (0%) | 6mo | $137,500 | $119 | 82 |
| 5516 Seward Ave | 0.33mi | 3/1.5 | 1,164 (+1%) | 2mo | $140,000 | $120 | 80 |
| 4540 Hazelwood Ave | 0.46mi | 3/1.5 | 1,080 (-6%) | 10mo | $180,000 | $167 | 57 |
| 8124 Bartholomew Ct | 0.71mi | 3/2.5 | 1,148 (-0%) | 6mo | $330,900 | $288 | 56 |
| 5327 Todd Ave | 0.37mi | 4/2.0 (+1) | 1,024 (-11%) | 1mo | $259,900 | $254 | 54 |
| 5006 Anntana Ave | 0.44mi | 3/2.5 | 1,024 (-11%) | 2mo | $260,000 | $254 | 53 |
| 4843 Greencrest Rd | 0.75mi | 3/1.0 | 1,088 (-6%) | 8mo | $210,000 | $193 | 49 |
| 4921 Greencrest Rd | 0.67mi | 3/1.5 | 1,280 (+11%) | 1mo | $112,500 | $88 | 47 |
| 4332 Berger Ave | 0.72mi | 3/2.0 | 1,212 (+5%) | 8mo | $175,000 | $144 | 47 |
| 5904 Willet Ave | 0.71mi | 2/1.0 (-1) | 1,258 (+9%) | 5mo | $180,000 | $143 | 43 |
Match score weights: distance 35% · size 25% · config 20% · recency 20%. Top-matched comps best support the ARV.
Projected returns pro-forma
-3.0% appreciation · 4.43% rent growth · sell at horizon
- IRR
- -2.1%
- Equity multiple
- 0.92×
- Total profit
- $-3,587
- Equity at exit
- $24,229
- IRR
- 9.2%
- Equity multiple
- 1.75×
- Total profit
- $34,189
- Equity at exit
- $14,050
Cash invested: $45,500 (down + closing). Projections, not guarantees.
Landlord ↔ Tenant lean methodology
- Overall (CITY)
- 12 Strongly Tenant-Friendly
- State Maryland
- 27 Tenant-Leaning · D+14
- County
- — inherits STATE
- City Baltimore
- 12 Strongly Tenant-Friendly · D+58
ZIP-level market 21206
- Rents YoY
- 4.4%
- Active inventory
- 180
- Price-to-rent
- 7.3×
Monthly cashflow live
- Estimated rent
- $1,846 high interval (Pro) →
- Mortgage (P&I)
- −$852
- Tax from tax record
- −$224 /mo · $2,689/yr
- Insurance
- −$68
- HOA
- −$0
- Vacancy / Maint / Mgmt
- −$388
- Net cashflow
- $314
Break-even live
Sensitivity live
| Price | -10% $406 | -5% $360 | +0% $314 | +5% $268 | +10% $222 |
|---|---|---|---|---|---|
| Rent | -10% $168 | -5% $241 | +0% $314 | +5% $387 | +10% $460 |
| Rate | -1.0pp $396 | -0.5pp $356 | base $314 | +0.5pp $272 | +1.0pp $229 |
UW: 25.0% down · 7.5% · 30yr · 1.5% tax · 5.0% vac · 8.0% maint · 8.0% mgmt
Financing live
Cash to close
- Down payment
- $40,625
- Closing costs
- $4,875
- Reserves months
- —
- Total cash needed
- —
Loan-product check · same deal, 3 products live
Conventional
25% down · 7.5% · 30yr
- Down + closing
- —
- Monthly P&I
- —
- Monthly cashflow
- —
- DSCR
- —
- Eligible?
- —
Personal DTI + credit; lowest rate.
DSCR
20% down · 8.5% · 30yr
- Down + closing
- —
- Monthly P&I
- —
- Monthly cashflow
- —
- DSCR
- —
- Eligible?
- —
No personal income docs; deal must DSCR.
Hard money
10% down · 12.0% · 12mo
- Down + closing
- —
- Monthly P&I
- —
- Monthly cashflow
- —
- DSCR
- —
- Eligible?
- —
Short-term bridge; refi at stabilization.
Rent comps 33 comps
| Address | Beds | Baths | Sqft | Rent | $/sqft | DOM | Units | Dist |
|---|---|---|---|---|---|---|---|---|
| 5904 Arizona Ave Unit B Baltimore, MD | 3.0 | 2.0 | 925 | $1,550 | $1.68 | 24d | 1 | 0.16mi |
| 4909 Hamilton Ave Baltimore, MD | 2.0–3.0 | 2.0 | 862 | $1,550 | $1.80 | 4d | 5 | 0.17mi |
| 4907 Hamilton Ave Unit B Baltimore, MD | 3.0 | 2.0 | 925 | $1,699 | $1.84 | 44d | 1 | 0.20mi |
| 4903 1/2 Hamilton Ave Unit A Baltimore, MD | 2.0 | 2.0 | 800 | $1,450 | $1.81 | 24d | 1 | 0.20mi |
| 4903 1/2 Hamilton Ave Apt B Baltimore, MD | 3.0 | 2.0 | 925 | $1,550 | $1.68 | 24d | 1 | 0.20mi |
| 4905 Hamilton Ave Apt B Baltimore, MD | 3.0 | 2.0 | 925 | $1,550 | $1.68 | 24d | 1 | 0.20mi |
| 5738 Cedonia Ave Baltimore, MD | 2.0 | 1.0 | 797 | $1,385 | $1.74 | 4d | 3 | 0.37mi |
| 5253 Cedgate Rd Unit 1 Baltimore, MD | 3.0 | 1.5 | 1152 | $2,200 | $1.91 | 44d | 1 | 0.43mi |
| 5313 Todd Ave Baltimore, MD | 3.0 | 1.5 | 1280 | $1,800 | $1.41 | 17d | 1 | 0.43mi |
| 6042 Barstow Rd Baltimore, MD | 1.0–3.0 | 1.0 | 736 | $1,527 | $2.07 | 3d | 1 | 0.47mi |
| 4924 Frankford Ave Baltimore, MD | 4.0 | 2.0 | 1176 | $2,600 | $2.21 | 24d | 1 | 0.47mi |
| 4308 Hamilton Ave Baltimore, MD | 2.0 | 1.0 | 1110 | $1,416 | $1.28 | 24d | 1 | 0.66mi |
| 5632 Belair Rd Baltimore, MD | 3.0 | 1.5 | 1260 | $2,100 | $1.67 | 24d | 1 | 0.83mi |
| 1732 Chesaco Ave Rosedale, MD | 3.0 | 1.0 | 1260 | $2,295 | $1.82 | 44d | 1 | 0.86mi |
| 5611 Force Rd Baltimore, MD | 3.0 | 1.5 | 1296 | $1,850 | $1.43 | 44d | 1 | 0.87mi |
| 4111 Century Rd Baltimore, MD | 3.0 | 1.5 | 1432 | $2,500 | $1.75 | 44d | 1 | 0.90mi |
| 5938 Clayton Ave Baltimore, MD | 4.0 | 2.0 | 1296 | $2,872 | $2.22 | 17d | 1 | 0.98mi |
| 5906 Benton Heights Ave Baltimore, MD | 2.0 | 1.0 | 780 | $1,350 | $1.73 | 44d | 1 | 0.98mi |
| 4517 Woodlea Ave Baltimore, MD | 2.0 | 2.0 | 1326 | $1,900 | $1.43 | 3d | 1 | 0.99mi |
| 4901 Gunther Ave Baltimore, MD | 1.0–3.0 | 1.0–2.0 | 742 | $1,463 | $1.97 | 3d | 1 | 1.00mi |
| 5424 Belle Vista Ave Baltimore, MD | 2.0 | 1.0 | 932 | $1,300 | $1.39 | 44d | 1 | 1.04mi |
| 4007 Biddison Ln Apt 1 Baltimore, MD | 2.0 | 1.0 | 1000 | $1,279 | $1.28 | 18d | 1 | 1.08mi |
| 5305 Moravia Rd Baltimore, MD | 3.0 | 1.0 | 679 | $1,993 | $2.93 | 3d | 1 | 1.09mi |
| 4023 Belwood Ave Baltimore, MD | 3.0 | 1.0 | 1080 | $1,995 | $1.85 | 44d | 1 | 1.09mi |
| 4104 Parkwood Ave Baltimore, MD | 3.0 | 1.0 | 1224 | $2,800 | $2.29 | 24d | 1 | 1.10mi |
| 2009 Longview Ave Rosedale, MD | 3.0 | 2.0 | 1062 | $2,500 | $2.35 | 15d | 1 | 1.19mi |
| 3802 Biddison Ln Baltimore, MD | 4.0 | 1.5 | 1443 | $2,024 | $1.40 | 12d | 1 | 1.23mi |
| 6004 Amberwood Rd Baltimore, MD | 2.0 | 1.0 | 751 | $1,220 | $1.62 | 21d | 1 | 1.26mi |
| 5731 Denwood Ave Baltimore, MD | 3.0 | 1.5 | 1152 | $1,700 | $1.48 | 22d | 1 | 1.29mi |
| 5731 Denwood Ave Baltimore, MD | 3.0 | 1.5 | 1440 | $1,700 | $1.18 | 24d | 1 | 1.29mi |
| 4409 Moravia Rd Baltimore, MD | 2.0 | 1.0 | 861 | $1,385 | $1.61 | 44d | 3 | 1.29mi |
| 8212 Dorset Ave Rosedale, MD | 4.0 | 1.5 | 1479 | $2,250 | $1.52 | 44d | 1 | 1.30mi |
| 3607 Bayonne Ave Unit 2 Baltimore, MD | 2.0 | 1.0 | 900 | $1,300 | $1.44 | 24d | 1 | 1.35mi |
Listing history 12 events
-
2026-05-15$162,500 Active 490-char remark
-
2005-10-12soldstatus $100,000
-
2005-07-31soldstatus $100,000 385-char remark
Show marketing remark (385 chars)
A coat of paint will do wonders! Air conditioning unit needs a coil. Roof and ceiling will be repaired before closing. Not leaving frig. Contributing $3,500 to closing/repairs. Seller not making any repairs. Cash or conventional only! Security sys. to be activated by Buyer. Knock first. Allow Seller time to come to door before using keybox. Repla. windows. Leave a card. Thank you!
-
2005-05-26historical 385-char remark
Show marketing remark (385 chars)
A coat of paint will do wonders! Air conditioning unit needs a coil. Roof and ceiling will be repaired before closing. Not leaving frig. Contributing $3,500 to closing/repairs. Seller not making any repairs. Cash or conventional only! Security sys. to be activated by Buyer. Knock first. Allow Seller time to come to door before using keybox. Repla. windows. Leave a card. Thank you!
-
2005-05-24$95,000 385-char remark
Show marketing remark (385 chars)
A coat of paint will do wonders! Air conditioning unit needs a coil. Roof and ceiling will be repaired before closing. Not leaving frig. Contributing $3,500 to closing/repairs. Seller not making any repairs. Cash or conventional only! Security sys. to be activated by Buyer. Knock first. Allow Seller time to come to door before using keybox. Repla. windows. Leave a card. Thank you!
-
1999-11-14historical
-
1999-09-05
-
1996-06-24soldstatus $65,900
-
1996-06-24soldstatus $65,900
-
1996-06-14soldstatus $65,900
-
1996-03-27historical
-
1996-03-20$65,900
ⓘ Source: listings_history table (triggers on properties + properties_extension) + one-shot
backfill from property_details.listing_events for pre-trigger history.
Tax reassessment forecast MD · Partial reset (capped growth)
- Current annual tax
- $2,689 · $224/mo
- Projected year-2 tax
- $2,689 · $224/mo
- Expected delta
- $0/yr ($0/mo · 0.0%)
ⓘ Screening estimate from a state-policy table — verify with the county assessor before closing.
Climate risk First Street
- Flood 1/10 Low FEMA zone X (unshaded) · 0% chance over 30 yrs
- Wildfire 1/10 Low
- Heat 8/10 Severe 7 d/yr ≥103°F today · 15 d/yr by 30 yrs out
- Wind 6/10 Major 27% chance of damaging wind over 30 yrs
- Air quality 5/10 Major 6 unhealthy d/yr today · 8 by 30 yrs out
Nearby sold comps map
Loading sold comps map…
Walkable amenities ~0.75 mi
Loading nearby amenities…
Taxation est. · year 1
- Rental income
- $22,149
- − Mortgage interest
- −$9,103
- − Property taxes
- −$2,689
- − Insurance
- −$812
- − Repairs & maintenance
- −$1,772
- − Management
- −$1,772
- − Depreciation
- −$4,727
- Taxable income
- $1,274
- Est. tax owed @ 24.0%
- −$306
- After-tax cash flow
- $3,465/yr
For passive investors: Depreciation is non-cash, so a rental often shows a tax loss while cash-flowing — sheltering income. Rental losses are passive: they offset passive income freely, and up to $25,000/yr can offset ordinary (W-2) income if you actively participate and your MAGI is under $100k (phasing out to $0 by $150k); unused losses carry forward. On sale, claimed depreciation is recaptured at up to 25%, and gains may owe capital-gains tax (a 1031 exchange can defer both). Figures are a year-1 estimate at your 24.0% rate — not tax advice; consult a CPA.
Schools (NCES district)
- District
- Baltimore City Public Schools
- NCES district ID
- 2400090
- Math proficiency
- 7% ▼ -9.00%
- Reading proficiency
- 16% ▼ -5.00%
- Median HH income
- $42,108
- Composite
- 10.08/100
- National rank
- #9805
- State rank
- #24 of 24 in MD
Livability — Baltimore
- Score
- 76/100
- State rank
- #90
- US rank
- #3396
Category grades
Schools grade is shown separately in the Schools card above.
Census & demographics
- Census place
- Baltimore, MD
- County
- Baltimore City · 558,601 people
- City population
- 588,727
- Metro
- Baltimore-Columbia-Towson, MD
- Population (ZIP)
- 48,902
- Household income
- $64,531
- Rent vs Own
- Severe rent burden
- 2317.0
Population outlook (Baltimore County) Hauer SSP2
- Today (2025)
- 624,249 people
- By 2030
- 621,541 · -0.4%
- By 2040
- 609,756 · -2.3%
- By 2050
- 597,249 · -4.3%
- By 2075
- 552,236 · -11.5%
- By 2100
- 513,934 · -17.7%
Race, ethnicity, and origin ACS 2023
- Neighborhood character
- Predominantly Black (73%)
- Race & ethnicity
- Black 73% White 20% Two or more races 3% Hispanic / Latino 3% Asian 2%
- Common ancestry
- Romanian 3% Ukrainian 1%
- Foreign-born
- 8% · Canada
- Languages at home
- 92% English-only · Spanish 2% Arabic 2% Other Indo-European 1%
Political lean MEDSL · Baltimore
- 2024 margin
- Solid D (+73.0) · D 85.2% · R 12.2% · Other 2.6%
- 2008→2024 swing
- -2.5pp toward R · 2008: 75.5pp · 2024: 73.0pp
- All cycles
- 2024: D+73.0 2020: D+76.6 2016: D+74.6 2012: D+76.4 2008: D+75.5
Not yet ingested
- Civics
- —
Market trends
- HPI YoY
- ▼ -191.83%
- Current HPI
- 284.5645
- Rent YoY
- ▲ 4.43%
- Metro
- Baltimore-Columbia-Towson, MD
- State GDP YoY
- ▲ 2.97%
- F500 in state
- 12
Industry mix (Fortune 500 HQ in MD)
| Industry | F500 HQs | Revenue |
|---|---|---|
| Aerospace / Defense | 1 | $71B |
|
||
| Utilities | 1 | $25B |
|
||
| Hotels | 1 | $24B |
|
||
| Consumer Goods | 1 | $7B |
|
||
| Real Estate | 1 | $6B |
|
||
| Chemicals | 1 | $2B |
|
||
Price history
+146.6% since first listed13 events — show timeline
- 2026-05-25 Listing Removed — BRIGHT MLS
- 2026-05-15 Listed $162,500 BRIGHT MLS
- 2005-10-12 Sold (Public Records) $100,000 Public Records
- 2005-07-31 Sold (MLS) $100,000 MRIS
- 2005-05-26 Delisted — MRIS
- 2005-05-24 Listed $95,000 MRIS
- 1999-11-14 Delisted — MRIS
- 1999-09-05 Listed — MRIS
- 1996-06-24 Sold (Public Records) $65,900 Public Records
- 1996-06-24 Sold (Public Records) $65,900 Public Records
- 1996-06-14 Sold (MLS) $65,900 MRIS
- 1996-03-27 Delisted — MRIS
- 1996-03-20 Listed $65,900 MRIS
Property tax history
+0.5%/yrLatest (2025): $2,689 · +2.7% YoY. Source: county tax records.
Cash-flow waterfall
monthlySold comps — $/sqft
last 12 mo · ≤1 miLoading sold comps…